HAL Id: hal-00318113
https://hal.archives-ouvertes.fr/hal-00318113
Submitted on 9 Aug 2006
HAL is a multi-disciplinary open access
archive for the deposit and dissemination of
sci-entific research documents, whether they are
pub-lished or not. The documents may come from
teaching and research institutions in France or
abroad, or from public or private research centers.
L’archive ouverte pluridisciplinaire HAL, est
destinée au dépôt et à la diffusion de documents
scientifiques de niveau recherche, publiés ou non,
émanant des établissements d’enseignement et de
recherche français ou étrangers, des laboratoires
publics ou privés.
Estonia for 1955?2004
K. Eerme, U. Veismann, S. Lätt
To cite this version:
K. Eerme, U. Veismann, S. Lätt. Proxy-based reconstruction of erythemal UV doses over Estonia
for 1955?2004. Annales Geophysicae, European Geosciences Union, 2006, 24 (7), pp.1767-1782.
�hal-00318113�
www.ann-geophys.net/24/1767/2006/ © European Geosciences Union 2006
Annales
Geophysicae
Proxy-based reconstruction of erythemal UV doses over Estonia for
1955–2004
K. Eerme1, U. Veismann1, and S. L¨att2 1Tartu Observatory, T˜oravere, Tartumaa, Estonia 2Tartu University, Tartu, Estonia
Received: 12 September 2005 – Revised: 21 April 2006 – Accepted: 17 May 2006 – Published: 9 August 2006
Abstract. A proxy-based reconstruction of the
erythemally-weighted UV doses for 1955–2004 has been performed for the Tartu-T˜oravere Meteorological Station (58◦16’ N, 26◦280E, 70 m a.s.l.) site. The pyrheliometer-measured daily sum of direct irradiance on partly cloudy and clear days, and the pyranometer-measured daily sum of global irradiance on overcast days were used as the cloudiness influence related proxies. The TOMS ozone data have been used for detect-ing the daily deviations from the climatic value (averaged annual cycle). In 1998–2004, the biases between the mea-sured and reconstructed daily doses in 55.5% of the cases were within ±10% and in 83.5% of the cases within ±20%, on average. In the summer half-year these amounts were 62% and 88%, respectively. In most years the results for longer intervals did not differ significantly, if no correction was made for the daily deviations of total ozone from its cli-matic value. The annual and summer half-yearly erythemal doses (contributing, on average, 89% of the annual value) agreed within ±2%, except for the years after major volcanic eruptions and one extremely fine weather year (2002). Using the daily relative sunshine duration as a proxy without de-tailed correction for atmospheric turbidity results in biases of 2–4% in the summer half-yearly dose in the years after major volcanic eruptions and a few other years of high atmo-spheric turbidity. The year-to-year variations of the summer half-yearly erythemal dose in 1955–2004 were found to be within 92–111% relative to their average value. Exclusion of eight extreme years reduces this range for the remaining to 95–105.5%. Due to the quasi-periodic alternation of wet and dry periods, the interval of cloudy summers 1976–1993 reg-ularly manifests summer half-yearly erythemal dose values lower than the 1955–2004 average. Since 1996/1997 mid-winters have been darker than on average.
Keywords. Atmospheric composition and structure
(Biospheric-atmospheric interaction) – Meteorology and atmospheric dynamics (Climatology; Radiative processes)
Correspondence to: K. Eerme
1 Introduction
In recent years there has been more attention to the recon-struction of UV doses for the past years and the UV climate in general. The reconstructions of erythemal doses based on proxy data and radiative transfer calculations have recently been made by several authors (Kaurola et al., 2000; Ziemke et al., 2000; Fioletov et al., 2001; Eerme et al., 2002b; Lind-fors et al., 2003; Fioletov et al., 2004; Kry´scin et al., 2004; Lindfors and Vuilleumier, 2005; den Outer et al., 2005).
Climate in Northern Europe manifests an alternation of dominantly fine-weather and cloudy summers, as well as cold and mild winters. Favorable weather regimes affect the productivity of natural ecosystems and agricultural crops. Human health also depends on weather conditions, among them the amount of available sunshine. Variations of the ground-level ultraviolet (UV) irradiance and dose are the key factors in the atmosphere-biosphere relationships. UV radia-tion has certain beneficial effects but may also be harmful and destructive. The time series of UV radiation measurements cover a relatively short period in recent past. Hence, there is an urgent need for proxy data based reconstruction of the UV doses. The clear-sky UV doses depend on the annual and daily cycles of solar elevation and the annual cycles of total ozone and aerosol attenuation. A smoothed annual cycle of clear weather doses can be modeled or interpolated from the observed values. Against that background, the measured ery-themally weighted daily doses are most sensitive to the extent of the Sun being obscured by clouds and to the optical depth of these clouds. The interplay of the UV radiation between the clouds and the surface depends on the ground albedo and becomes complex in the presence of snow. For the correc-tions of the deviacorrec-tions of the total ozone and aerosol optical depth from the current calendar day, long-term average val-ues, hereinafter referred to as climatic valval-ues, are also neces-sary. Data sets of proxies, available at the measurement sites, may be of different content and not always of uniform qual-ity. In the case of UV radiation climate reconstruction over larger areas, data sets of the same content could not be ex-pected to be available for all sites. Therefore, the comparison
of the results of reconstruction based on different key proxy data from the same site would also be useful.
2 Method
In the present paper the reconstruction of the ground-level erythemally weighted daily doses has been performed for one site during the whole year. In our previous reconstruc-tions only the period from the vernal equinox to the autumnal equinox was treated (Eerme et al., 2002b, 2003) and also a smaller data set of measured erythemal doses was used for deriving the statistical relationships between the daily ery-themal dose and its proxies.
The reconstruction, based on statistical relationships, is performed relative to the climatic clear weather dose. As noted above, the daily climatic value here corresponds to the long-term average conditions of the atmospheric character-istics for each calendar day. The smoothed climatic annual cycle of clear weather erythemal doses, corresponding to cli-matic annual cycles of total ozone and aerosol optical depth, could be either calculated, using radiative transfer codes or interpolated from the observed clear-sky values. The true all-weather ground-level daily erythemal dose D against that average annual background can be expressed as
D = DclearKcloudinessKalbedoKozoneKturbidity. (1)
In Eq. (1) Dclear is the climatic average clear-sky dose for
the corresponding calendar day, Kcloudinessis the daily cloud
modification factor (CMF), Kalbedo is the factor accounting
for the albedo difference from the seasonal average, Kozone
is the factor accounting for the deviation of total ozone daily value from that of the climatic value for that particular day, and Kturbidityis the factor accounting for the deviation of
at-mospheric turbidity from that of the climatic. All the neces-sary data for taking these factors into account are not always available. Therefore, it is better to consider their influence separately and to reserve the possibility of performing some minor corrections in the future.
3 Ranges of variance and uncertainties of the dose
mod-ulating factors
The most variable and often the largest factor among those used in Eq. (1) is Kcloudiness. The factor has been expressed
through its proxies X by a linear regression
Kcloudiness=aX/Xclear+b . (2)
While testing different combinations of proxies, the most promising version was found using the daily relative sum of broad-band direct irradiance on clear and partly cloudy days and the daily relative sum of broad-band global irradiance on
overcast days. The daily sum of direct irradiance is a mea-sure of sunshine duration, similar to the daily sunshine dura-tion itself. The disadvantage of the last quantity is that it con-tains neither information on atmospheric turbidity, nor on the solar elevations of the sunshine episodes. On overcast days the CMF for the daily sum of global broad-band irradiance was found to vary in a wide range from 0.055 to 0.55. The corresponding range for the erythemal dose is from 0.085 to 0.87. The uncertainty of CMF depends on the accuracy of the measurement of global irradiance and on the accuracy of the calculation of climatic clear dose. The measurement accuracy relative to the international scale is ±5% (Russak and Kallis, 2003). The large variation of CMF values comes from the high variability of the cloud structure. The thicker the clouds, the better the relative penetration is of erythemal irradiance, as compared to the global broad-band irradiance. The average ratio of the penetration decreases from 2.3 for the darkest clouds to 1.3 for the most transparent overcast conditions. On partly cloudy days part of the attenuation of the daily dose comes from Kcloudinesand another part from
Kturbidity.
The total ozone anomalies occupy second place as contrib-utors to the variations of the UV dose. The effect of the ozone influence on UV radiation can be expressed by the radiation amplification factor, RAF, which is a percentage increase of the UV radiation resulting from a 1% decline in total ozone. The absolute error of TOMS total ozone values has been es-timated to be ±3% (WMO, 1998). The correction in clear-sky conditions has been made to the extent of a 1% lower (higher) dose to the total ozone 1% amount higher (lower) than the climatic value. On partly cloudy days a correction was made for the relative contribution of direct irradiance. The correction was not performed on overcast days. 70% of the total ozone deviations throughout the year and 79% in the summer half-year remain within ±10% from the climatic value. Only about 6% of the deviations throughout the year and 2% in summer half-year have exceeded ±20%.
Often aerosol attenuation influences the ground-level UV doses to the same extent as the total ozone day-to-day varia-tions. It is assumed that under sunshine conditions the sum of the broad-band direct irradiance takes into account the de-viation of atmospheric turbidity from its climatic value. The proportionality of aerosol optical depth (AOD) values will be discussed below. The coefficient of the linear correlation between the AOD at wavelengths 340 nm and 500 nm was 0.989. The estimated uncertainty in the ratio of the AOD is approximately ±10%. The variations of Kturbidityin 70% of
the cases remain within the range 0.92–1.08 relative to the climatic value. In a few cases the values have dropped even below 0.75, due to the smoke of forest fires in the dry sum-mer of 2002. In extremely good atmospheric transparency conditions the value has reached a level of 1.15. These data confirm the finding (Jaroslawski and Kry´scin, 2005) that the forcing of clear-sky irradiance by the AOD variations is as important as that by the column ozone variations. If the daily
relative sunshine duration is used as a proxy instead of the daily sum of direct irradiance and there are no data to correct for the turbidity, then those biases in dose can occur.
The albedo effect gains importance in the presence of snow. The landscape pattern around the station consists of fields and patches of coniferous forest. In the cold season when there is a strong mutual influence between the chang-ing surface albedo and CMF, it was easier to consider snow influence by using separate regressions for CMF in snow and in snow-free conditions. In this case Kcloudinessincludes the
albedo factor Kalbedo. The uncertainty of the albedo effect
for the snow-covered conditions reaches ±50% in midwinter due to highly variable snow characteristics.
4 Available proxy and ancillary data
The proxy data (used and available), except for satellite total ozone, have been recorded at the Tartu-T˜oravere Meteoro-logical station (58◦160N, 26◦280E, 70 m a.s.l.) of the Esto-nian Meteorological and Hydrological Institute (EMHI). The station is the successor of the Meteorological Observatory of Tartu University, and has been regularly operating since 1865. First attempts of solar radiation measurements were made there in the 1930s. In 1949, a set of instruments for solar radiation measurements was obtained and a few years later the observations of the radiation budget components be-came a major research subject. Since January 1950, regular measurements have been performed outside the town and, since 1965, the station has been operating at the present site, 20 km from the center of Tartu and about 15 km from its pre-vious location. During one year the measurements were per-formed simultaneously in both sites, located amidst similar rural landscapes. Analysis of the data showed no system-atic differences. In 1999 the station was included in the Baseline Surface Radiation Network (BSRN). Since 2002 the AERONET Cimel-18 Sun photometer has been operat-ing at the station, providoperat-ing data on aerosol spectral opti-cal depth. The main features of the Estonian radiation cli-mate are described in the Handbook of Estonian Solar Radi-ation Climate (Russak and Kallis, 2003). The pyranometer-measured global irradiance has been recorded since 1950 with some prolonged gaps in 1952. The continuous record of the pyrheliometer-measured direct irradiance has been avail-able since 1955. The direct normal radiation S is measured perpendicularly to the solar beam. The values transformed to the horizontal surface have been used here. The daily relative sunshine duration, detected by the Campbell-Stokes helio-graph, is available for the years 1953–1958 and since 1967. The radiation data collected in 1950–1954 had a somewhat different content as compared to those collected since 1955. For the present paper only the radiation data from 1955–2004 have been used.
During 1936–1965 routine observations of clouds in the meteorological stations of the former Soviet Union were
car-ried out with a 6-h resolution, and since 1966 with a 3-h resolution. The amounts of medium- and upper-level clouds were not separately recorded. The detected cloud types were recorded without any quantitative measure (Sun and Grois-man, 2000). At the Tartu-T˜oravere Meteorological Station, specialized in radiation measurements, cloud detection has been performed with a 3-hour resolution since the beginning of radiation measurements. Since July 1957 the hourly cloud detection has been performed regularly during the day. For the hourly data, the cloud amounts in measurements of tenths at each of the three basic levels are detected and the domi-nating cloud types are also recorded. Such high frequency of detection is unique among the stations of the former So-viet Union. The results of visual cloud detection by different observers have been regularly compared. If the daily sums of broad-band global irradiance and direct irradiance or sun-shine duration are available, data on clouds present supple-mentary information from the point of view of the UV dose reconstruction. Cloud data can help if only global irradiance data are available. In the previous stages of our UV dose reconstruction activities, the daily average cloud amounts on each of the three basic levels were calculated from the hourly data and the relative contribution of dominating cloud genera on overcast and heavily cloudy days, as well, was found to determine the average CMF. In the time range from the vernal equinox to the autumnal equinox, the use of CMF, detected from cloud genera data, gives satisfactory results (Eerme et al., 2002b, 2003). In midwinter, especially if snow and snow-free periods are alternating, the variance of CMF for all cloud genera turned out to be too high for such a use.
The albedo effect gains importance in the presence of snow. The hourly broad-band albedo data have been used for detecting the daily average albedo and for distinguishing between the snowy and snow-free days. In snow-free con-ditions the surface was covered either by grass or by dead grass and had low albedo. The landscape pattern consists of fields and patches of coniferous forest. The regional albedo around the year contains a contribution by the forest-covered area. If the local albedo corresponds to snow, then usually at least about 50% of the surroundings act as a snow-covered surface. The statistical relationships between the daily ery-themal doses and their proxy values in snow-covered condi-tions are different from those in snow-free condicondi-tions. After the spring equinox, snow has been met in few years, though in some cases it has lasted for three to four weeks. Snow increases the daily doses both on sunny and overcast days.
The Estonian total ozone climatology, based on available data until 2000, has been published recently (Eerme et al., 2002a). No local measurements of atmospheric total ozone had been performed before 1994. TOMS daily values of to-tal ozone have been available since November 1978, with gaps in 1993–1996. Local direct Sun measurements of to-tal ozone, performed in 1994–1999, partly fill the gap in the warm season. In very recent years the direct Sun mea-surements using the MICROTOPS-II instrument have also
Table 1. Average aerosol optical depth of total direct irradiance at the Tartu-T˜oravere Meteorological Station. Interval Average value Median value StDev Values < 0.1% Values > 0.2%
1955–1960 0.099 0.083 0.059 61.5 16 1961–1970 0.114 0.102 0.063 49 14 1971–1981 0.135 0.118 0.074 35 16.5 1986–1991 0.130 0.106 0.089 43.5 16 1996-2003 0.083 0.064 0.070 76 6 1982–1985 0.165 0.145 0.110 28.5 25 1992–1995 0.0 0.1 0.1 0.2 0.2 0.3 0.3 0.4 0.4 0.5 0.5 0 0.1 0.2 0.3 0.4 0.5 0.6 AOD Pr ob ab ilit y de ns ity Average 1955-2003 Average in 1982-85 and 1992-95 Average 1996-2003
Fig. 1. Probability density distribution of aerosol integral optical depth: in 1996–2004, in 1955–2004 and in 1983–1985 + 1992– 1995 for Tartu-T˜oravere Meteorological Station.
been performed. The values interpolated between the nearest stations in Riga and St. Petersburg are available for 1973– 1978. Rough interpolated data on the monthly level (London et al., 1976) also exist for the period 1957–1967. Most of the data obtained before 1979 can be used on the monthly level. Atmospheric turbidity is characterized by transparency and by the contribution of diffuse radiation. Atmospheric in-tegral transparency has been monitored at the Tartu-T˜oravere Meteorological Station, under the conditions when the Sun was shining and the sky around it was cloud-free. The re-sults have been transformed to the atmospheric mass m=2 (solar elevation 30◦) situation. After June 2002, when the AERONET Cimel-18 Sun-photometer started to operate at the Tartu-T˜oravere Meteorological Station, the data on AOD in the range 340 to 1020 nm are available.
5 Aerosol optical depth variations
Using the daily sum of broad-band direct irradiance as a proxy for the daily erythemal dose, it is assumed that the influence of atmospheric turbidity in the UV region is pro-portional to that in the integral radiation. The atmospheric AOD data in the present work were used for selecting the adequate clear day data, in order to construct the climatic
clear-sky annual cycles. The AOD used for solar integral radiation was calculated from the data of the atmospheric integral transparency, with the contribution by water vapor subtracted. The water vapor optical depth has been relatively stable during 1955–2003 and its variance is nearly 10 times less than that of the AOD. The Gueymard method (1995, 1998) for subtraction of the water vapor contribution and a simple method for water vapor column retrieval proposed by Okulov (2003) were used by Russak et al.,(2005) for retriev-ing the integral AOD values. A simpler method for water vapor subtraction, proposed by Zvereva (1968) and resulting in about 0.01–0.02 higher aerosol optical depth values is also suitable.
The large (small) average value of AOD during a cer-tain period does not mean that all values are systematically higher (lower). Usually both large and small values oc-cur during any period, and the average value depends on their relative frequency. The integral AOD, as well as its value in the visible region does not necessarily need to be directly related to the AOD in the UV region (Jaroslawski et al., 2003; Jaroslawski and Kry´scin, 2005), assuming the invariable wavelength dependence of the AOD through the
˚
Angstr¨om’s formula. In any case the AOD in the UV region increases with the increase of the AOD in the visible range and often the UV-B transmission can be estimated success-fully by the AOD values in the visible region (Wenny et al., 1998) or at longer wavelengths of the UV region. For exam-ple, the measurement data from Ispra manifest a stable ratio of the Brewer retrieved AOD at 320 nm and AERONET AOD at 340 nm (Gr¨obner and Meleti, 2004). The biases between the AOD, retrieved from Brewer direct Sun observations and calculated using the ˚Angstr¨om’s law, can partly be explained by neglecting the error sources in the Brewer AOD retrieval (Arola and Koskela, 2004). The extrapolation based on the
˚
Angstr¨om exponent is related to the size distribution of the aerosol particles. The values of spectral AOD depend on the aerosol size distribution and its optical properties, related to the origin of air mass. The prevailing air mass with its aerosol loading and composition depends on the wind direction and aerosol source locations.
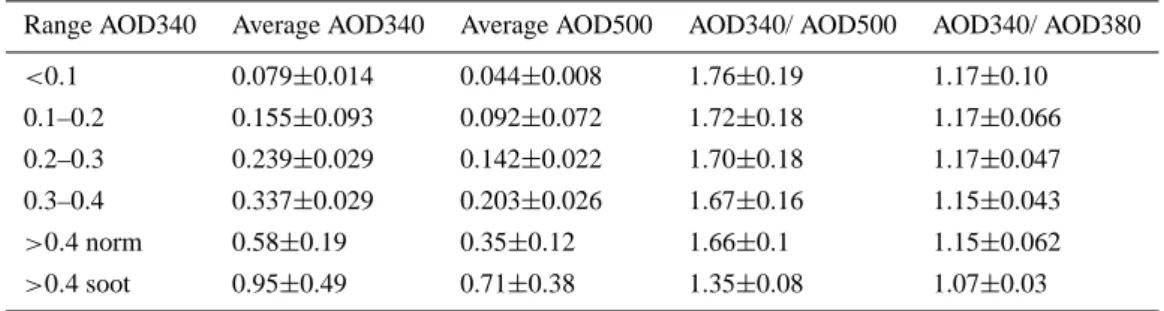
Table 2. AERONET spectral AOD grouped average values and ratios with StDev at the Tartu-T˜oravere Meteorological Station. Range AOD340 Average AOD340 Average AOD500 AOD340/ AOD500 AOD340/ AOD380
<0.1 0.079±0.014 0.044±0.008 1.76±0.19 1.17±0.10 0.1–0.2 0.155±0.093 0.092±0.072 1.72±0.18 1.17±0.066 0.2–0.3 0.239±0.029 0.142±0.022 1.70±0.18 1.17±0.047 0.3–0.4 0.337±0.029 0.203±0.026 1.67±0.16 1.15±0.043 >0.4 norm 0.58±0.19 0.35±0.12 1.66±0.1 1.15±0.062 >0.4 soot 0.95±0.49 0.71±0.38 1.35±0.08 1.07±0.03
Before June 2002, the only data available at our site were those concerning the integral AOD. The average value for the whole period of 1955–2004 was 0.11 and its modal value near 0.1. The average atmospheric turbidity since about 1996 has been lower than during the observed period, on average, especially in the 1970s and 1980s (Table 1), when large values occurred more frequently. The higher than usual AOD values dominate in the years after the El Chi-chon (1982–1985) and Pinatubo (1992–1995) major volcanic eruptions. Small values also occurred in these years but less frequently. The probability density of AOD is asymmetri-cally distributed. There is a sharp peak around the AOD modal value 0.1 and a long tail towards the higher values, affecting the average but presenting low probabilities of oc-currence (Fig. 1).
The real studies of spectral AOD became possible when the AERONET Cimel-18 Sun-photometer (http://aeronet. gsfc.nasa.gov/) started to operate at the Tartu-T˜oravere Me-teorological Station. The relationships were found between the integral AOD and the AOD at 500 nm (Teral et al., 2004; Russak et al., 2005). We have studied the relationship be-tween the AOD in the visible region and the UV region at our site. The spectral AOD data on the level 2.0 were avail-able for 334 days in 2002–2004. In 2005, 97 more days on level 1.5 were also included. The data were grouped ac-cording to the AOD value at 340 nm into five ranges: be-low 0.1, 0.1–0.2, 0.2–0.3, 0.3–0.4 and above 0.4. More than 60% of the values fell into two ranges 0.1–0.2 and 0.2–0.3, about 10% were below 0.1 and 14% exceeded 0.4. The re-sults of the statistical study of the grouped AOD and their ratios are presented in Table 2. For each range, the aver-age AOD values at 340 nm and 500 nm, as well as the ratios AOD340/AOD500 and AOD340/AOD380 with the standard deviation limits have been calculated. The data in the range of the largest values were divided into two groups, contain-ing the usually occurrcontain-ing aerosol and the soot aerosol, related to extended forest and bog fires in the summer and autumn of the dry 2002. One can see that the ratio AOD340/AOD380 for usually occurring aerosol in all ranges is almost the same and the ratio AOD340/AOD500 decreases slowly while the AOD increases. The AOD of the soot aerosol is less
depen-dent on wavelength. The coefficient of the linear correlation between the AOD at wavelengths 340 nm and 500 nm was as high as 0.989. Taking into account the similarity of ratios for different ranges of AOD values and their relatively small variance, it can be concluded that on most days the deviations from the average ratio of the aerosol attenuation in the ery-themally weighted and pyrheliometer-measured broad-band region cannot be large. Unfortunately, the data correspond-ing to the conditions after major volcanic eruptions are out of scope of the AERONET data set for our site.
6 Average clear-sky background
The estimated daily doses are usually presented as those rel-ative to the climatic clear-sky background D/Dclear
(Josefs-son and Landelius, 2000; Schwander et al., 2002). As noted above, the clear-sky climatic dose can be calculated, using radiative transfer codes for inserted realistic AOD and to-tal ozone data. Also, it can be interpolated from the ob-served data corresponding to average “normal” conditions by checking the daily AOD and the total ozone values. We have used the latter version. Ozone non-influenced symmetric cy-cle, relative to the summer solstice annual cycles of daily sums of direct irradiance and global irradiance, as well as the ozone influenced asymmetric cycle of clear-sky daily erythe-mal dose are presented in Figs. 2 and 3.
The presented smoothed curves have been compiled, us-ing the measured clear-weather values of 1955–2003 for the daily sums of direct and global irradiance (Fig. 2) and the values obtained in 1998–2003 for the daily erythemal dose (Fig. 3). The total number of the daily sums used of broad-band direct and global irradiance exceeded 800. Only about 90 values were available for the daily erythemal dose. The drastic leaps in the erythemally weighted dose curve (Fig. 3) are related to transitions of average albedo conditions from snow to snow-free and vice versa. Between 15 Decem-ber and the vernal equinox the snow conditions have been considered to be typical and were used for constructing the curves. It was found that a better agreement between the calculated and measured daily dose values is achieved, using
0 5 10 15 20 25 30 35 1 32 63 94 125 156 187 218 249 280 311 342 Day in year D aily su m (M J/m² ) Clear global Clear direct
Fig. 2. Climatic annual cycles of the clear-weather daily sums of global and direct broad-band irradiance in MJ/m2 for Tartu-T˜oravere Meteorological Station site.
the separate regressions for snow and snow-free conditions. The effect of alteration of the distance between the Earth and the Sun is included in the data used. The construction of the smoothed curve was performed using the moving average of 5 to 10 days with balanced positive and negative deviations. The average value of broad-band AOD within each current interval was checked from the point of view of how well it agreed with its climatic value during the corresponding time interval. In the case of the smoothed erythemal dose curve, the agreement of the total ozone value with that of the cli-matic was also checked. As noted above, the average atmo-spheric turbidity since about 1996 has been lower that during the whole period of 1955–2004. The lower average AOD means lesser large values. The selection of data from the years 1955–1995 for construction of the curves of Fig. 2 has been made in agreement with the average values during the erythemal measurements period since 1998.
If the daily relative sunshine duration is used as a proxy instead of the daily sum of direct irradiance, the UV doses could be overestimated or underestimated if the real devi-ations of AOD from the climatic value are not taken into account. The average atmospheric transparency at our site is quite stable from April to August when it is at its lowest level (Russak and Kallis, 2003). Quite often the AOD values are not available for days with a large contribution of sun-shine. Using monthly averages instead of real daily values can result in significant biases of daily erythemal doses. In the cold period of the year the AOD is measured much less frequently, the values are usually small, however, large val-ues are also recorded. Specific aerosol conditions have been met during two shorter periods, 1982–1985 and 1992–1995, after major volcanic eruptions when the optical depth levels were systematically higher than usual.
Due to a relatively small amount of clear-sky values of erythemal doses, the calculations using the LibRadtran codes (Mayer and Kylling, 2005) were performed. The calculated clear-sky daily sums of broad-band irradiation, as well as the
0.0 0.5 1.0 1.5 2.0 2.5 3.0 3.5 4.0 4.5 1 32 63 94 125 156 187 218 249 280 311 342 Day in year E ry .dos e (k Jeff /m² )
Fig. 3. Climatic annual cycle of the clear-weather daily erythemal dose in kJef/m2for Tartu-T˜oravere Meteorological Station site.
clear-sky erythemal doses turned out to be nearly 10% lower than the measured values. For broad-band daily sums this is out of the range of the uncertainty limits. The codes con-centrated on UV calculations are probably not appropriate for the broad-band region. For the erythemal dose the bias is close to the uncertainty of scale. The correction of our radiometric scale is not excluded in the future. New instru-ments were obtained and the calibration facilities improved only very recently.
7 Regression-based estimation of cloud modification
factor
The relationships between the daily erythemal dose and the cloudiness dependent proxies X through the CMF Kcloudiness
have been expressed by a linear regression (2). The coef-ficients a and b for different proxies were found, using the data for 1998 to 2003, which provided quite a representa-tive range of weather conditions and allowed one to com-pare the estimated and measured values for the year 2004. The use of some nonlinear regression is not excluded either. Fortunately, the nonlinearities have been found to be small, therefore they do not cause systematic deviations. To ex-clude the influence of daily deviations of total ozone from its climatic value the Kcloudiness should be fitted to the total
ozone climatic cycle. The ascent a in regression (2) indicates the difference of the erythemal dose reaction to the changes in proxy ratio X/Xclear in the broad-band region. The
in-tercept b in the regression (2) expresses the average back-ground contribution of the sky in the erythemal dose. On clear and partly cloudy days the relative contribution of di-rect irradiance depends on the solar elevation at noon. At our site it reaches 50% only at noon around the summer sol-stice (Eerme et al., 2003) and decreases with the lowering of solar elevation and increasing atmospheric turbidity. In mid-summer the appearance of cumuli clouds at noon is frequent, reducing the contribution of higher solar elevation into the
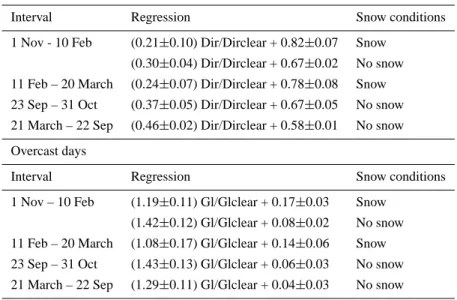
re-Table 3. Linear regressions utilized.
Partly cloudy or clear days
Interval Regression Snow conditions
1 Nov - 10 Feb (0.21±0.10) Dir/Dirclear + 0.82±0.07 Snow (0.30±0.04) Dir/Dirclear + 0.67±0.02 No snow 11 Feb – 20 March (0.24±0.07) Dir/Dirclear + 0.78±0.08 Snow 23 Sep – 31 Oct (0.37±0.05) Dir/Dirclear + 0.67±0.05 No snow 21 March – 22 Sep (0.46±0.02) Dir/Dirclear + 0.58±0.01 No snow Overcast days
Interval Regression Snow conditions
1 Nov – 10 Feb (1.19±0.11) Gl/Glclear + 0.17±0.03 Snow (1.42±0.12) Gl/Glclear + 0.08±0.02 No snow 11 Feb – 20 March (1.08±0.17) Gl/Glclear + 0.14±0.06 Snow 23 Sep – 31 Oct (1.43±0.13) Gl/Glclear + 0.06±0.03 No snow 21 March – 22 Sep (1.29±0.11) Gl/Glclear + 0.04±0.03 No snow
gression ascent a at that time. The linear regressions for both proxies used, i.e. for partly cloudy + clear and for overcast days are presented in Table 3. The limits of the coefficients a and b at the 95% confidence level are included. Separate sets of coefficients a and b for snow and snow-free conditions were used for the darkest 100 days (±50 days from the win-ter solstice), as well as for the late autumn and early spring periods from 23 September to 31 October and from 11 Febru-ary to 20 March. In 1955–2004, persistent snow in October occurred only in 2002 for 11 days. In a few cases it has oc-curred for 1–2 days at that time. In the summer half-year from 21 March to 22 September the regressions were calcu-lated only for snow-free conditions and, in the cases when snow occurred after 20 March the regression for the previous period was extended.
The confidence level depends on the number of points used in calculation of regression and on the variance of the rela-tionship between the studied quantities. The availability of points for the regressions of the selected above time intervals was different. The amount of points as large as 840 occurred available for the partly cloudy and clear days in the sum-mer half-year. The most restricted number (33) was found for snow-free conditions during 1 November–10 February; in other cases the number remained between 66 and 201. In most cases the coefficient of the linear correlation of con-structed regressions remained between 0.84 and 0.95. Ex-ceptionally low values of 0.38 and 0.61 were found for partly cloudy and clear days during the winter half-year intervals in snow-covered conditions. The regression manifesting the lowest linear correlation was based on 97 points and another one on 66 points.
The albedo of fresh snow is high, about 80–90%, and that of old snow about 30–40% (Blumthaler and Ambach, 1988). The enhancement of UV irradiance is larger for cloudy skies because of the increased backscattering by clouds. Under clear-sky conditions the enhancement by a factor of about 1.3 was established by Lenoble et al. (2004) at the Alpine station 500 m above sea level. An increase by 28% of global UV-A irradiance and by 22% of UV-B irradiance under clear-sky conditions, due to snow, was established by McKenzie et al. (1998). At our site the low adequacy of regressions in snow-covered conditions tend to be low due to the high vari-ability of snow properties and snow influence on the back-ground. On separate days the snow contribution often has been similar to that refered to just above.
8 Selection of overcast days
In total, 109 fully overcast days per year is considered the annual average at the Tartu-T˜oravere Meteorological Station. Most of these days occur in the winter months. If correctly defined, on overcast days the sum of direct irradiance, as well as the sunshine duration are zero. This selection crite-rion excludes days with short sunshine duration whose daily doses resemble those of fully overcast days. We have used a softer criterion of an overcast day. The selection was based on the values of direct solar irradiance, sunshine duration, and visual cloud inspection data. The basic criteria were the daily sum of direct irradiance and the daily sunshine dura-tion. Checking their mutual agreement helps to avoid pos-sible errors. The detected daily average cloud amount of 10 tenths does not guarantee that the day is overcast, because
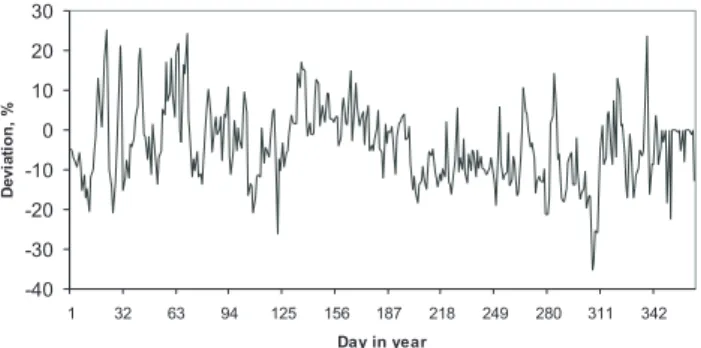
-40 -30 -20 -10 0 10 20 30 1 32 63 94 125 156 187 218 249 280 311 342 Day in year D evi at io n, %
Fig. 4. Daily percent deviations of total ozone from its climatic value in year 2004 at Tartu-T˜oravere Meteorological Station site.
the cloud situations are recorded as samples after each hour. If small daily sums of direct irradiance coming from very early or late hours have been recorded, the heliograph often records no sunshine. If a short sunshine episode is recorded near noon, its relative contribution is much higher than that of the sunshine duration. From the point of view of using the daily relative sum of direct irradiance as a proxy for the UV dose, very small values are not representative. For those days the sum of global irradiance is more respective. It was used in the cases when direct irradiance contributed less than 5% of the clear day value. This relatively voluntarily chosen threshold proceeds from the fact that the contributions below 5% occur more often than the values between 5 and 15%. For the last range, the average of the values based on both proxies was in the best agreement. The 5% criterion used here roughly means that the days with less than one hour of sunshine in the summer half-year and less than half an hour sunshine in the winter half-year were classified as the overcast days. In most cases those above-zero sunshine du-ration values have been 0.1–0.2 h. In the summer half-year, the average number of overcast days by the criterion used was 36.5 days in 1955–2004, of these 20.3 in astronomical spring and 16.2 in astronomical summer. The annual values have varied between 15 and 51. In the winter half-year the average number was 104 or 58% of all days. In the darkest period (November - February) the overcast days contribute 67%. On average, 23.5 days have been overcast in Decem-ber. The lowest average value, 2.8 days or 9%, has occurred in June and July. Situations without any overcast days have occurred from May to August, 5–6 times per month during 50 years.
As a result of the criterion used for classifying the days into overcast ones for nearly 40% of the days, the daily sum of broad-band global irradiance and, for nearly 60% of the days the daily sum of broad-band direct irradiance were used as the cloudiness influence related proxies.
On overcast days the difference in CMF for broad-band ir-radiance and erythemal irir-radiance depends on the cloud op-tical depth. Relative transmittance of the UV-A radiation is better for thicker clouds. Due to absorption by tropospheric
ozone in clouds, the transmission of UV-B radiation becomes lower (Mayer et al., 1998). It has been shown (Schwander et al., 2002) that in overcast conditions the CMF increases with decreasing wavelength in the UV-A region and decreases again below wavelength 315 nm.
9 Correction for total ozone
A mean annual cycle of total ozone over Estonia in 1979– 2000 was composed, using the averaged ten-day values (Eerme et al., 2002a). The years subjected to strong stochas-tic forcing by El Chichon (1983) and Mt. Pinatubo (1992 and 1993) volcanic aerosol were excluded. Due to the gap in the data set used, the year 1995 and partly 1996 have also been excluded. The total ozone systematic deviations tend to ap-pear in spring as the quasi-biennial oscillation (QBO) related anomalies. A systematic trend above the 95% significance level in seasonally averaged total ozone could be detected only in late winter and spring. In 1979–2000 the trend of decrease in late winter/spring (Feb–April) corrected for the QBO influence was found to be 3.0±2.6% per decade within ±2σ limits. No detectable trend was found neither in autumn nor in summer. If the data after 2000 are appended, then small negative trends also appear in summer and autumn. Such a trend is related to the increased amount of tropo-spheric highs in recent years rather than to the chemical loss of ozone. In the upper tropospheric persistent highs, the total ozone tends to be lower and in lows higher than the climatic value. For the period since the vernal equinox to the autum-nal equinox the coefficient of linear correlation between the percent of negative deviations of total ozone from its climatic value and the half-yearly sum of broad-band direct irradiance was 0.67. The negative deviations have contributed 28% in the cloudiest summer half-year 1987 and 75% in the sunniest 2002. As an example, the yearly course of total ozone per-centage deviations in 2004 is shown in Fig. 4. In most years the total ozone negative and positive deviations compensate each other over longer time intervals and the total dose is not greatly influenced by the total ozone daily values. Systematic differences arise in the years of persistent extreme weather.
In any case, the further back we try to expand the recon-struction, the higher the probability of a total lack of the total ozone daily data. Therefore, is seems reasonable to study how much the reconstructed UV doses for longer intervals, based on climatic ozone, differ from those based on real daily values of total ozone. For the period when the daily values of total ozone were available, the reconstructions based on the climatic value were made in parallel, and the results were compared.
The effect of ozone influence on UV radiation can be ex-pressed by the radiation amplification factor, RAF, which is a percentage increase of the UV radiation resulting from 1% decline in total ozone. RAF, relating differential changes in total ozone and UV irradiance, is dependent on solar zenith
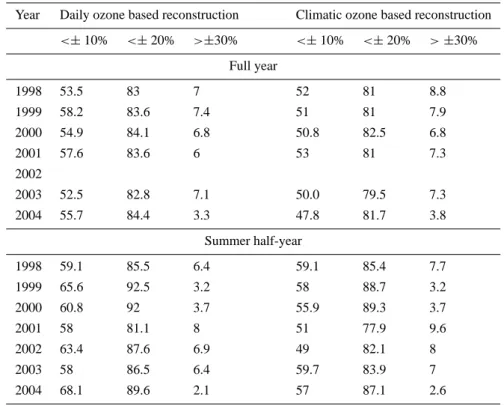
Table 4. Percent of biases between reconstructed and measured daily erythemal doses within certain limits in 1998–2004. Year Daily ozone based reconstruction Climatic ozone based reconstruction
<±10% <±20% >±30% <±10% <±20% > ±30% Full year 1998 53.5 83 7 52 81 8.8 1999 58.2 83.6 7.4 51 81 7.9 2000 54.9 84.1 6.8 50.8 82.5 6.8 2001 57.6 83.6 6 53 81 7.3 2002 2003 52.5 82.8 7.1 50.0 79.5 7.3 2004 55.7 84.4 3.3 47.8 81.7 3.8 Summer half-year 1998 59.1 85.5 6.4 59.1 85.4 7.7 1999 65.6 92.5 3.2 58 88.7 3.2 2000 60.8 92 3.7 55.9 89.3 3.7 2001 58 81.1 8 51 77.9 9.6 2002 63.4 87.6 6.9 49 82.1 8 2003 58 86.5 6.4 59.7 83.9 7 2004 68.1 89.6 2.1 57 87.1 2.6
angle and wavelength. For the zenith angle values less than 80◦, the value for the CIE weighted integral was found to be close to 1% (Fioletov et al., 2001). In other sources it was found to be 1.1–1.2% for the zero zenith angle (Ziemke et al., 2000). For the equatorial region it was found (Herman et al., 2000) that the deviation of 6% in total ozone causes the deviation of 6% in irradiance and a dose at 310 nm, as well as in the erythemally weighted region.
On the daily level the corrections of the reconstructed dose for total ozone deviation were made for the period since 1979. The correction under clear-sky conditions has been made to the extent of a 1% lower (higher) dose to the total ozone 1% amount higher (lower) than the climatic value. On partly cloudy days a similar correction was made for the rel-ative contribution of direct irradiance. The correction was not performed on overcast days. Despite the fact that ozone absorption mostly occurs in the stratosphere, the total effect in the cases of direct and diffuse solar UV-B radiation is dif-ferent. Due to the multiple scattering in clouds, the light path of diffuse radiation and the probability of being absorbed by tropospheric ozone are higher (Mayer et al., 1998). The ef-fect reduces the relationship between the erythemal irradi-ance and column ozone through the increase in the relative contribution of UV-A radiation. We have made attempts to take into account the influence of total ozone deviations dur-ing the obscured Sun period on partly cloudy days. The
devi-ations from the measured values turned out to be larger than in the version used.
Between the spring equinox and 15 May, 60–70% of the total ozone deviations from their climatic value exceed ±20 DU (±5.5%). In some years these are mostly due to QBO related enhanced or reduced ozone transport from the trop-ics. A contribution also comes from the modulation by the alternation of highs and lows in the upper troposphere. Usu-ally the largest deviations occur in February, when both the highest (548 DU) and the lowest (190 DU) total ozone val-ues have been recorded at our site. Due to low solar elevation and mostly cloudy days, the ozone influence on the erythe-mal doses in winter is rather moderate.
10 Comparison with measured values
The reconstructed values of erythemal doses for the years 1998–2004 were compared with the measured ones on the daily level and also on monthly and half-year scales. As the measured values of 1998–2003 were used for constructing the versions of regression (2), only in the case of one year -2004 – were its data not included in the statistical relation-ships. The agreement between the reconstructed and mea-sured daily values in that particular year, as well as other years was similar, as can be seen in Table 4. Unfortunately part of the measured values in the winter 2002 has been lost,
1999 0.4 0.6 0.8 1.0 1.2 1.4 1.6 1.8 1 32 63 94 125 156 187 218 249 280 311 342 Day in Year R eco ns tr uc te d /M easu re d (a) 2004 0.4 0.6 0.8 1.0 1.2 1.4 1.6 1 32 63 94 125 156 187 218 249 280 311 342 Day in Year R eco ns tr uc te d /M easu re d (b)
Fig. 5. Ratios of daily and monthly reconstructed/measured erythemal doses for year 1999 and year 2004.
Table 5. Ratio of erythemal doses calculated using climatic ozone versus daily ozone in 1979–2004 for different intervals.
Interval Average Max Min
01.01.–10.02. 1.01 1.068 0.97 11.02.–20.03. 1.01 1.049 0.93 21.03.–21.06. 0.997 1.023 0.96 22.06.–22.09. 0.994 1.025 0.97 23.09.–31.10. 0.995 1.017 0.965 01.11.–31.12. 0.997 1.031 0.963
thus the results were not compared on an annual level. The reconstruction has been done in two versions by consider-ing the total ozone influence: on the daily data and on the climatic data basis. In the first version the influence of daily deviations from the climatic value was taken into account and in the second it was not.
The examples of the behavior of the ratio of the recon-structed/measured daily and monthly dose are presented in Fig. 5 for the years with the best and the worst agreement. Most of the large biases occur in winter in the case of very low values of the daily doses. A few cases have also occurred in summer, and some of them could be detected and excluded quite easily. In some cases something has happened to the sensors (something on the diffusor, extreme weather, inter-ruption in power supply, etc.). In winter 3–4% of the mea-sured daily values could be influenced by a blizzard or heavy precipitation and manifest, to some extent an anomalous re-lationship between the erythemal and broad-band data.
The agreement with the measured values for about 60% of the calculated monthly doses was within ±5%. Nearly 10% of the monthly doses deviated from the measured ones by more than 10%. Most of these larger deviations occurred in
the dark period of the year and constituted 10–13%, only in three cases did the biases of the monthly values from Novem-ber to February reach 16–20%.
The summer half-year from the vernal equinox to the au-tumnal equinox contributes, on average 89%, of the yearly erythemal dose. Extreme values of the contribution have been 87.6% in the cloudy summer of 1987 and 91% in the sunny 1999. The variations of the yearly dose are almost to-tally determined by the summer half-year contribution. Due to better penetration of the UV-A part of the radiation through the clouds, the amplitude of the year-to-year variations in the erythemal dose is less than that of its proxy quantities.
In the past the calibration of broad-band sensors was reg-ularly performed in the Voeikov Main Geophysical Observa-tory (St. Petersburg), and now it is done in the World Radi-ation Center (Davos). Between the comparison campaigns, the absolute radiometer PMO-6 No R850405 is used as a secondary standard for regular assurance of the calibration. The previous standard, the ˚Angstr¨om pyrheliometer M-59-8 No. J-1981, has been in use for more than 20 years and the scales of old and new standards have been in agreement with the World Radiation Reference within ±0.1% (Russak and Kallis, 2003). The scale of the Scintec UV SET erythemal sensor is based on the manufacturer calibration; its labora-tory checking has been regularly performed, using a standard quartz halogen FEL lamp, calibrated by Oriel Instruments, in spectral irradiance traceable to the USA National Institute of Standards and Technology (NIST) standards. The calibra-tion was also checked, using the portable erythemal sensor PMA2000. The latter has been compared to the Brewer in-struments located at Jokioinen (Finland) and Belsk (Poland) in recent years. Unfortunately, the weather conditions dur-ing both campaigns were not the best. The cosine response of any erythemal instrument at low solar elevations has de-viations from the ideal but under those conditions the con-tribution of direct irradiance is very small. For most diffuse radiation from the sky the cosine response is almost correct.
11 Results of erythemal dose reconstruction
The daily erythemal doses at the Tartu-T˜oravere site were re-constructed for the period January 1955 to December 2004. In 1979–2004 total ozone influence was considered on the daily data and climatic values basis. In the winter-spring pe-riod the biases between the daily ozone corrected and cli-matic ozone calculated daily doses exceed 30% in extreme cases. In 1979–2004, the biases between the daily doses, based on the daily total ozone and the climatic value, re-mained within ±10% in 95% of cases. The extremes were 92.5% (2000) and 98% (1992). On the monthly level, the de-viations were the highest in February and March. In March the ratios of the monthly dose reached the margins from 0.915 to 1.073. The narrowest range of the monthly ratios 0.965 to 1.02 was found in June and also in September-October. The value of the monthly ratio after April and be-fore January did not fall below 0.95 and rose above 1.03. The ratios of estimated to measured monthly doses for 1999 and 2004 are shown in Fig. 5. A comparison was also made for the periods when different regression coefficients were used in the reconstruction or for the periods usually manifesting different weather or ozone variability. The results are pre-sented in Table 5. The average dose ratio for all these peri-ods was within 0.99 to 1.01. The deviations were found to be close to the extremes in a few cases.
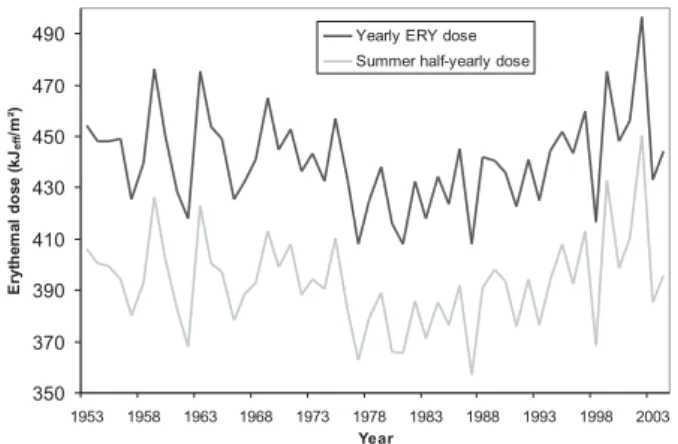
The biases of the summer half-yearly doses, as well as the annual doses, reconstructed on the daily ozone basis and on the basis of climatic values, exceeded 2% in the years 1983 and 1992, after major volcanic eruptions. The largest devia-tion, 3.5%, was met in the extremely fine weather year 2002. Similar summers in the past occurred in 1959 and 1963. In the summer of 2002, due to the prevailing high pressure in the upper troposphere, the measured total ozone was reg-ularly lower than the climatic and the UV doses based on ozone climatic value were underestimated. In the case of an assumed completely clear weather summer half-year the deviation should reach 4%. The summer half-year recon-structed dose of 2002, based on the total ozone daily values, was in agreement with the measured value within ±0.1%. In other years, except the noted three, both versions of re-construction were in agreement within ±2% and in 12 cases out of 22, within ±1%. In Fig. 6, the yearly and summer half-yearly reconstructed dose variations in 1955–2004 are presented. The amplitude of the deviations from the average in the summer half-yearly dose was within 92–111%. The range of variation of all proxy quantities is larger. The sum of global broad-band irradiance varies within 89.7–114.4%, the sum of direct irradiance within 74.4–132.2%, and the sun-shine duration within 79.8–132.9% (no data for 1959–1966). One can see that the interval of 1976–1993 regularly mani-fests values lower than the average. Also, a quite impressive linear trend showing increase in the erythemal dose in 1980– 2002 is evident. Such a trend is as impressive in broad-band global irradiance and even more impressive in broad-band
350 370 390 410 430 450 470 490 1953 1958 1963 1968 1973 1978 1983 1988 1993 1998 2003 Year E ry the m a l dos e (k Jeff /m² )
Yearly ERY dose Summer half-yearly dose
Fig. 6. Reconstructed yearly and summer half-yearly erythemal
dose in 1955–2004.
direct irradiance, both not affected by ozone. The summer half-yearly broad-band dose is modulated by cloudiness and, to lesser extent, by atmospheric turbidity year-to-year vari-ations. In 1976–1993 the summer half-yearly average sum of broad-band direct irradiance was 20% less than it was in 1994–2004. In two most cloudy summers of this “dark” pe-riod the averaged half-year total ozone has been 4.5% higher than that of 1976–1993. Thus, in extremely cloudy summers use of climatic ozone in reconstruction tends to lead to over-estimation of the dose.
Figure 7 presents the reconstructed erythemal doses sep-arately for astronomical spring (21 March to 21 June) and summer (22 June to 22 September). The spring period tributes, on average, 42.9% and the summer period con-tributes 46.2% of the yearly dose. The year-to-year varia-tions in the spring period were in the range of 88.3–114.1% of the average and in the summer period in the range of 89.9– 112.6%. The probability density distribution (not shown) of the values in the spring period is closer to a normal distribu-tion than in the summer period.
After discovery of the Antarctic ozone hole the interest in harmful effects of UV radiation has increased. The stud-ies of its biologically beneficial impacts have been largely overlooked until recently. Among the useful qualities vi-tamin D production in human skin is one of huge impor-tance. Its synthesis occurs when the incident UV-B irradi-ance exceeds a certain threshold. At latitudes above 50◦the natural synthesis stops for the period of “vitamin D winter” whose duration depends on several factors (Engelsen et al., 2005). An erythemally weighted UV radiation dose is not a direct measure of the vitamin D synthesis intensity. It is only proportionally related to it. The dose variations dur-ing the periods when small values are produced are also of interest. The darkest 102 (roughly 100) days of the winter from 1 November to 10 February, when the noon solar ele-vation remains below 15◦, contribute, on average, only 2.7%
150 160 170 180 190 200 210 220 230 1955 1962 1969 1976 1983 1990 1997 2004 Year E ry the m a l dos e (k J /m 2) (a) 170 180 190 200 210 220 230 240 1955 1962 1969 1976 1983 1990 1997 2004 Year E ry the m al dos e (k J/ m 2) (b)
Fig. 7. Reconstructed erythemal doses in spring (a) and summer (b) seasons in 1955–2004.
70 75 80 85 90 95 100 105 110 115 120 1953/ 54 1956/ 57 1959/ 60 1962/ 63 1965/ 66 1968/ 69 1971/ 72 1974/ 75 1977/ 78 1980/ 81 1983/ 84 1986/ 87 1989/ 90 1992/ 93 1995/ 96 1998/ 99 2001/ 02 Winter pe r cen t Gl to aver % Ery to aver % (a) 50 60 70 80 90 100 110 120 130 140 150 1953/ 54 1956/ 57 1959/ 60 1962/ 63 1965/ 66 1968/ 69 1971/ 72 1974/ 75 1977/ 78 1980/ 81 1983/ 84 1986/ 87 1989/ 90 1992/ 93 1995/ 96 1998/ 99 2001/ 02 Winter pe r cen t (b)
Fig. 8. Erythemal dose (a), sum of global irradiance (a) and sum of direct irradiance (b) of darkest 100 days in winters 1955/56 – 2003/04 as percent deviations from the whole period mean.
of the yearly erythemal dose and the period corresponds al-most exactly to local “vitamin D winter”. The year-to-year variations of the erythemal dose during that period, as well as the sum of global broad-band irradiance in the scale of percentage deviation from the average values are presented in Fig. 8. The year-to-year variations of the erythemal dose occurred in the range ±20%. The range and the nature of year-to-year variations of broad-band global irradiance have been similar. The minimum values were met in the win-ters which manifested high cyclonic activity and extended snow-free episodes. Since 1996/97 the midwinters have been darker than average. To a lesser extent, dark winters also oc-curred in 1959–1962, 1971–1975 and 1990–1992. The range of variation of broad-band direct irradiance during the dark-est 100 days has been close to ±40%. In winter the correla-tion between the daily erythemal doses and global irradiance totals has been higher (0.96–0.97) than in the summer sea-son. In the summers with extended intervals of anomalous ozone the correlation has been as low as 0.9.
The intervals from 11 February to 20 March and from 23 September to 31 October contribute 4.5% and 4.1% of the annual erythemal dose, on average. The shortage of UV radi-ation due to higher levels of total ozone in spring is compen-sated by snow reflectance and more sunshine as compared to autumn. Only in 13 cases out of 50 has the autumnal dose exceeded that in spring. Seven of these cases occurred after 1990.
12 Comparison with results obtained using sunshine
duration
The daily sum of broad-band direct irradiance is recorded in a small number of sites. The data on daily sunshine duration are more often available. At our site their linear correlation in 1967–2003 has been 0.95–0.965 in the summer half-year and 0.89–0.93 in the winter half-year. As mentioned above, the daily sunshine duration is less sensitive to the atmo-spheric transparency than the daily sum of direct irradiance.
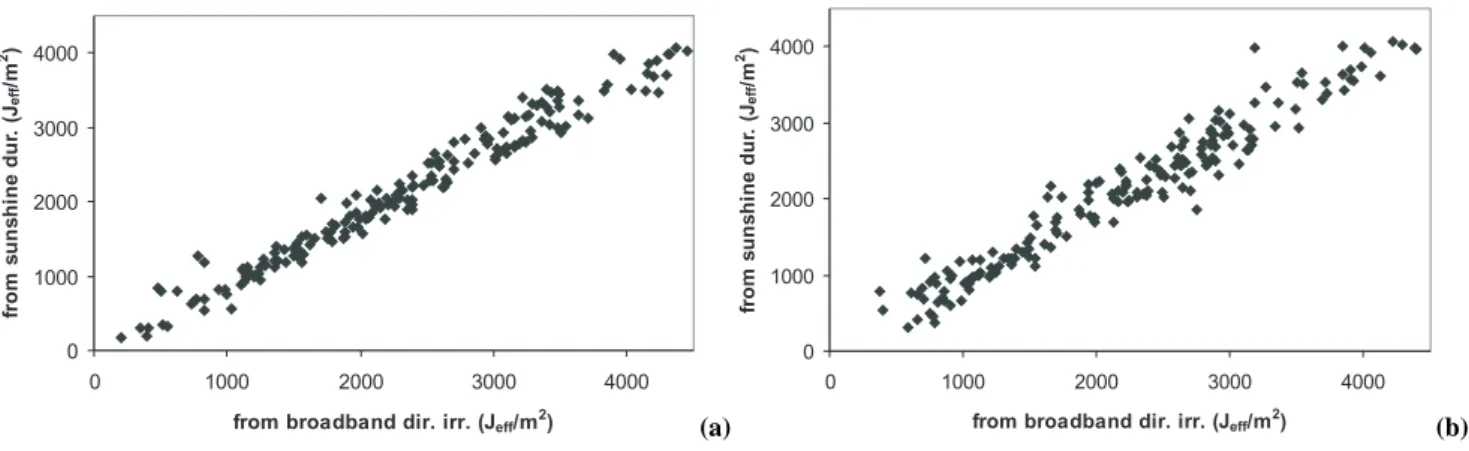
0 1000 2000 3000 4000 0 1000 2000 3000 4000
from broadband dir. irr. (Jeff/m2)
fr om suns hi ne dur .( Jeff /m 2) (a) 0 1000 2000 3000 4000 0 1000 2000 3000 4000
from broadband dir. irr. (Jeff/m2)
fr om suns hi ne dur .( Jeff /m 2) (b)
Fig. 9. Comparison of reconstructed daily erythemal doses based on broad-band direct irradiance and on sunshine duration in summer half-year of normal atmospheric transparency 1999 (a) and in summer half-year with soot aerosol episodes 2002 (b).
The reconstructions of erythemal dose using both proxies have been performed for the summer half-year (Eerme et al., 2003). The average ratio of both reconstructed daily values in the summer half-years was very close to 1 (mean value 0.9998 with the standard deviation 0.062). In 90% of cases the biases were within ±10% and only in about 1% cases did the biases exceed ±20%. In recent years, when the measured values have been available, both reconstructed doses for the entire half-year agreed with them within ±2%. Systematic biases in the daily values were most noticeable in 2002 when soot aerosol from forest fires strongly reduced the daily sums of direct irradiance and erythemal doses in several cases. The doses estimated by the sunshine duration without considering the AOD influence then became significantly overestimated. A comparison of both reconstructions for the summer half-year 2002 and that of for “normal” summer half-half-year are presented in Fig. 9. In the 1970s and 1980s, the summer half-yearly doses based on sunshine duration were also over-estimated in several cases by more than 2% due to AOD, which was often larger than the average. Using the relative sum of direct irradiance as a proxy, the values of X/Xclear
exceeding 1 in Eq. (2) arise in the cases when atmospheric transparency is better as compared to the average. In case of better-than-average transparency the doses calculated on the basis of sunshine duration will be underestimated, as this better transparency is not taken into account.
13 Discussion and conclusions
The major goal of the proxy-based reconstruction of the UV doses for the past years is to achieve realistic results on an-nual, seasonal and monthly scales for studying the year-to-year variations, long-term changes and their probable causes. The reconstructed daily values must also be as realistic as possible, to avoid significant biases after integration over longer periods.
In climatic conditions of Estonia and its surroundings the major modulating factor of the daily erythemal doses, as well as the daily sums of broad-band irradiance is cloudi-ness. From among the available cloudiness influence related proxies, the daily sum of pyrheliometer-measured direct ir-radiance and the daily sum of pyranometer-measured global irradiance were chosen as manifesting the best agreement be-tween the reconstructed daily erythemal doses and the mea-sured values. The former turned out to be suitable on partly cloudy and clear days and the latter on overcast days.
The AERONET spectral aerosol optical depth data and the data of local broad-band measurements of atmospheric trans-parency confirmed that the aerosol influence in the erythe-mal radiation has been proportional to that in the visible and pyranometer-measured broad-band ranges. Based on this it was assumed that the value of broad-band direct irradiance takes into consideration the aerosol attenuation deviations from its climatic value. Regardless of the higher contribution of diffuse radiation in the daily erythemal doses as compared to the broad-band radiation daily sums, the daily differences in values basically depend on the amount of solar direct irra-diance reaching the ground.
Daily sunshine duration as a measure of direct irradiance does not consider the solar elevation of the sunshine episodes and is also less related to the atmospheric turbidity. Its advan-tage as compared to the daily sum of broad-band irradiance, is that it is recorded in more sites. At our site linear corre-lation between these quantities in 1967–2003 has been 0.95– 0.965 in the summer half-year and 0.89–0.93 in the winter half-year. The average ratio of the reconstructed daily values of erythemal dose based on both quantities in summer half-years was very close to 1. In 90% of the cases the biases were within ±10% and only in about 1% of the cases did the biases exceed ±20%.
In about 70% of the clear days did the coefficient of atmo-spheric turbidity influence on the daily erythemal dose re-main in the range of 92–108%. The extremes have reached
Table 6. Variations of monthly erythemal dose in 1955–2004.
Month Average dose Jef/m2 Clear dose Jef/m2
Ratio Real dose/Clear dose Average% Min.% Max.%
January 2732 3889 70 51 87 February 8646 11626 74.5 55 90 March 22 348 29 449 76 59 97 April 40 198 56 605 71 52.5 83.5 May 75 334 100 610 75 59 94 June 90 396 120 045 75.5 65.5 85.5 July 86 470 115 692 74.5 61 89.5 August 63 810 86 545 73.5 55.5 93.5 September 32 316 46 512 69.5 56.5 84.5 October 11 865 18 379 64.5 49.5 79.5 November 3241 5596 58 43.5 76.5 December 1844 2753 67 40.5 83.5
115% in the case of a very clean atmosphere and 75% during the strong influence of forest fires. If the extended anomalies of atmospheric turbidity are not quantitatively detected and considered in reconstucton based on daily sunshine duration, then the biases in the summer half-year erythemal dose can exceed ±2%.
Usually the daily doses are examined in relation to the as-sumed clear sky doses. Here, the clear-sky values for each day were interpolated from the measured data and smoothed to obtain the annual cycle, corresponding to the average total ozone and aerosol attenuation annual cycles. When the daily deviations of the total ozone from their climatic value taken into account, the biases between the reconstructed and mea-sured values of the daily erythemal doses remained within ±10% in 55.5% of the days throughout the year and in 62% of the days in the summer half-year. In 83.5% of days around the year and in 88% of the days in the summer half-year the biases remained within ±20%.
The averaged annual erythemal dose at our site corre-sponds to about 70% of its assumed clear-sky value. The mean monthly percent, as well as its extremes are presented in Table 6. Relatively large values, around 75%, are met in February–March and in May–August. An average value significantly below 70% occurs in October-November. The year-to-year variations are the smallest in June.
Using the climatic total ozone values without any correc-tion for the daily deviacorrec-tions results in about a 4–5% decrease in the daily dose values within ±10% and in about a 3% decrease in the values within ±20%. In most years since 1979 the annual and summer half-yearly doses, calculated with and without considering the daily values of total ozone, were in agreement within ±2%. Exceptions occurred in the years after major volcanic eruptions and in the year 2002,
when extended episodes of lower than average total ozone occurred in summer due to prevailing highs. It inspires us to extend our reconstructions towards the years when the total ozone data are poor or not available.
On average, at the site of study the period from the ver-nal equinox to the autumver-nal equinox contributes 89% of the annual erythemal dose (the extremes 87.6% and 91%).
Due to larger contribution of diffuse irradiance, the annual and the summer half-yearly values of the erythemal dose are more stable than those of broad-band irradiance. The year-to-year variations of the summer half-yearly erythemal dose in 1955–2004 were found to be within 92–111% relative to its average value, with a standard deviation of 4.2%. The range of variation of the sum of broad-band global irradi-ance has been 89.7–114.4% with the standard deviation of 5.6%. If the four most sunny summers and also the four most cloudy summers were excluded, then the range of variation of the summer half-year erythemal dose for the remaining 42 years would reduce to 95–105.5% of the average, with the standard deviation of 2.7%. Despite the seemingly large variations of weather conditions, the available summer half-yearly and half-yearly erythemal dose is a stable quantity. The deviations from the average of more than 5% to both sides appear about once per decade. The alternation of higher than average and lower than average erythemal doses man-ifests a quasi-periodic nature and is related to wet and dry periods of the 30–40-year cycle. The interval 1976–1993 regularly manifests summer half-yearly erythemal dose val-ues lower than the 1955–2004 average. The doses are in a deficit by 3% in relation to the 1955–2004 average and by 4.5% in relation to the 1994–2004 average. The major reason for the smaller doses in 1976–1993 is more cloudy weather in that period. On average, the summer half-yearly sum of
broad-band direct irradiance of that time has been 20% less than in 1994–2004. Sunshine duration has also been reduced approximately by that much. The total ozone values in low pressure dominated summers have been larger rather than the average. Their contribution to the UV deficit is less than that of the cloudiness.
Only very recently has the importance of the wintertime UV radiation level studies grown. Vitamin D synthesis re-lated UV-B radiation and the duration of the “vitamin D win-ter” are considered important. Our study remains within the limits of erythemally weighted irradiance. In the winter half-year the erythemal dose, as well as the sum of broad-band ir-radiance have been more variable than in summer. The range of variation of the erythemal dose has been 87–114% as com-pared to the average value, with the standard deviation of 6.4%, whereas the sum of the broad-band global irradiance has varied in the range of 75–119%.
In winter the linear correlation between the daily erythe-mal dose and the daily sum of global irradiance has been higher, (0.96–0.97), than in the summer season. Frequent cloudy days and low solar elevation reduce the total ozone influence. In the summers, with extended intervals of anoma-lous ozone, the correlation has been as low as 0.9.
During the darkest 100 days around the winter solstice, the range of variation of the erythemal dose as compared to the average has been ±20%, which is close to the range of broadband global irradiance variation. The low values oc-curred in the winters with extended snow-free episodes and high cyclonic activity. During high cyclonic influence there are larger cloud amounts and the CMF value is smaller. Since 1996/1997 the midwinters have been darker than average on record.
Acknowledgements. This work was supported by the EC research contract No. EVK2-2002-00521, and by research grant No. 5348 from the Estonian Science Foundation. The work is also related to the COST 726 action. The authors thank the EMHI for the radiation data and NASA for the possibility to use the AERONET data for our site. The authors also wish to thank V. Russak for the kindly pro-posed possibility to use the aerosol optical depth data. The authors would like to thank the two anonymous referees for their valuable comments.
Topical Editor F. D’Andrea thanks two referees for their help in evaluating this paper.
References
Arola, A. and Koskela, T.: On the sources of bias in aerosol op-tical depth retrieval in the UV range, J. Geophys. Res., 109, doi:10.1029/2003JD004375, 2004.
Blumthaler, M. and Ambach, W.: Solar UV-B: Albedo of various surfaces, Photochem. Photobiol., 48, 85–88, 1988.
den Outer, P. N., Slaper, H., and Tax, R. B.: UV radiation in the Netherlands: Assessing long-term variability and trends in relation to ozone and clouds, J. Geophys. Res., 110, D02203, doi:10.1029/2004JD004824, 2005.
Eerme, K., Veismann, U., and Koppel, R.: Estonian total ozone climatology, Ann. Geophys., 20, 247–255, 2002a.
Eerme, K., Veismann, U., and Koppel, R.: Variations of erythemal ultraviolet irradiance and dose at Tartu/T˜oravere, Estonia, Clim. Res., 22, 245–253, 2002b.
Eerme, K., Veismann, U., and Koppel, R.: Retrospective estima-tion of the erythemal ultraviolet doses, Publicaestima-tiones Instituti Ge-ografici Universitatis Tartuensis (in Estonian with English sum-mary), 93, 295–307, 2003.
Engelsen, O., Brustad, M., Aksnes, L., and Lund, E.: Daily duration of vitamin D synthesis in human skin with relation to latitude, total ozone, altitude, ground cover, aerosols and cloud thickness, Photochem. Photobiol., B, 81, 1287–1290, 2005.
Fioletov, V. E., McArthur, L. J. B., Kerr, J. B., and Wardle, D. I.: Long-term variations of UV-B irradiance over Canada estimated from Brewer observations and derived from ozone and pyra-nometer measurements, J. Geophys. Res., 106, 23 009–23 027, 2001.
Fioletov, V. E., Kimlin, M. G., Krotkov, N., McArthur, L. J. B., Kerr, J. B., Wardle, D. I., Herman, J. R., Meltzer, R., Mathews, T. W., and Kaurola, J.: UV index climatology over the United States and Canada from ground-based and satellite estimates, J.Geophys. Res., 109, D22308, doi:10.1029/2004JD004820, 2004.
Gr¨obner, J. and Meleti, C.: Aerosol optical depth in the UVB and visible wavelength range from Brewer spectrophotometer direct irradiance measurements: 1991–2002, J. Geophys. Res., 109, D09202, doi:10.1029/2003JD004409, 2004.
Gueymard, C.: SMARTS2, a simple model of atmospheric radia-tive transfer of sunshine:algorithms and performance assessment, Techn. Rep. FSEC-PF-270-95, 78, 1995.
Gueymard, C.: Turbidity determination from broadband irradiance measurements: a detailed multicoefficient approach, J. Appl. Meteorol., 37, 414–435, 1998.
Herman, J. R., Piacentini, R. D., Ziemke, J., Celarier, E., and Larko, D.: Interannual variability of ozone and UV-B ultraviolet expo-sure, J. Geophys. Res., 105, 29 189–29 193, 2000.
Jaroslawski, J., Kry´scin, J. W., Puchalski, S., and Sobolewski, P.: On the optical thickness in the UV range: Analysis of the ground-based data taken at Belsk, Poland, J. Geophys. Res. 108(D2), 4772, doi:10.1029/2003JD003571, 2003.
Jaroslawski, J. P. and Kry´scin, J. W.: Importance of aerosol vari-ations for surface UV-B level. Analysis of ground-based data taken at Belsk, Poland, 1992–2004, J. Geophys. Res., 110, D16201, doi:10.1029/2005JD005951, 2005.
Josefsson, W. and Landelius, T.: Effect of clouds on UV radi-ance: As estimated from cloud amount, cloud type, precipita-tion, global radiation and sunshine duraprecipita-tion, J. Geophys. Res., 105, 4927–4935, 2000.
Kaurola, J., Taalas, P., Koskela, T., Borkowski, J., and Josefsson, W.: Long-term variations of UV-B doses at three stations in northern Europe, J. Geophys. Res., 105, D16, 20 813–20 820, 2000.
Kry´scin, J. W., Eerme, K., and Janouch, M.: Long-term variations of the UV-B radiation over Central Europe as derived from the reconstructed UV time series, Ann. Geophys., 22, 1473–1485, 2004.
Lenoble, J., Kylling, A., and Smolskaja, I.: Impact of snow cover and topography on ultraviolet irradiance at the