HAL Id: hal-02457295
https://hal.univ-lorraine.fr/hal-02457295
Submitted on 8 Oct 2020
HAL is a multi-disciplinary open access
archive for the deposit and dissemination of
sci-entific research documents, whether they are
pub-lished or not. The documents may come from
teaching and research institutions in France or
abroad, or from public or private research centers.
L’archive ouverte pluridisciplinaire HAL, est
destinée au dépôt et à la diffusion de documents
scientifiques de niveau recherche, publiés ou non,
émanant des établissements d’enseignement et de
recherche français ou étrangers, des laboratoires
publics ou privés.
Thermal conductivity and porosity maps for different
materials: A combined case study of granite and
sandstone
Sébastien Haffen, Yves Géraud, Michel Rosener, Marc Diraison
To cite this version:
Sébastien Haffen, Yves Géraud, Michel Rosener, Marc Diraison. Thermal conductivity and porosity
maps for different materials: A combined case study of granite and sandstone. Geothermics, Elsevier,
2017, 66, pp.143-150. �10.1016/j.geothermics.2016.12.005�. �hal-02457295�
Thermal
conductivity
and
porosity
maps
for
different
materials:
A combined
case
study
of
granite
and
sandstone
Sébastien
Haffen
a,b,∗,
Yves
Géraud
a,
Michel
Rosener
c,
Marc
Diraison
da GeoRessourceslab.,UMR7359,EcoleNationaleSupérieuredeGéologie,UniversitédeLorraine,CNRS,CREGU,2RueduDoyenMarcelRoubault, Vandœuvre-lès-Nancy,
F-54501,France b TeranovSAS,2RueduDoyenMarcelRoubault,Vandœuvre-lès-Nancy,F-54501,France c 78,84e AvenueEst,Blainville,QcJ7C3T3,Canada d InstitutdePhysique
duGlobedeStrasbourg(IPGS),UMR7516CNRS-UniversitédeStrasbourg/EOST,5rueRenéDescartes,StrasbourgCedex67084,France Keywords:Thermalconductivitymap, Porositymap, Heterogeneity, Geothermal
a
b
s
t
r
a
c
t
Thankstothermalconductivitymaps,obtainedfromOpticalScanningmethod,and porositymaps, inferredfromthermalconductivitymaps,wehavestudiedpetrophysical heterogeneitiescommonly presentinagraniticandsandstonegeothermalreservoir(fault zoneandpermeablelayers,respectively). Themapsalloweddeterminationofthermal conductivityandporosityvariationtomillimeterresolution,atacorescale.They permittedprecisequantification and determination ofthesize ofpetrophysical heterogeneities(thermalconductivityandporosity)inducedbyrockvariability.
.
1.Introduction
Inthecurrentcontextofcommitmenttosustainableandrenewableenergy, manycountriesworldwidearedevelopinggeothermal energy(Dicksonand Fanelli,2003;Lundetal.,2011;Bertani,2012). Toenhanceandensurethe economicandtechnicalviabilityof theheatexchangeratdepth,itappears importanttoimprovethe knowledgeofthermalandhydraulicpropertiesofthe targeted reservoirandtheirbehaviorsduringtheexploitationperiod(see for exampleBirsch,1966;CermakandRybach,1982;Haeneletal., 1988;Clauserand Huenges1995;Clauser2006;Hartmannetal., 2008).Indeed,theseproperties playamajorroleintheplanningof geothermalinstallationandingeothermal modeling.
Throughageothermalreservoirexchanger,fluidflowsoccurin thefractures and faultsconnectednetworkand indifferent sedimentarylevelsofhigh permeability(Haffenetal.,2013;Siffert etal.,2013).Thesefluidspresent differenttypesofdisequilibrium withrespecttothesurroundingrocks,aswellto temperatureand chemicalcomposition.Indeed,interactionprocessesbetween fluidsandrock,whichoccurovertimeintheporousspaceconnected
tothemainfluidflowzone(masstransferinducedbydissolutionandprecipitation phenomenaormechanicaldisplacementof clayedparticles),canprovokedamageto theheatexchangerby modifyingitspermeabilityandalsoaffectthesurfacepower plant (NortonandKnapp,1977;Norton,1979;SeibtandKellner,2003; Ungemach, 2003;Fritzetal.,2010;Civan,2011;Meieretal.,2014).
Thus,thermalconductivityandporositymapsappeartobetwo keyparameters, sincetheyallowtheimprovementofthetargeted rockcharacterization,notablyfrom information(quantification andsize)aboutpotentialrockheterogeneities.
Variousexperimentaltechniquesallowedthecharacterizationofthethermal conductivityandporosityofrocksamples (ZinsznerandPellerin,2007;Tritt,2004). WedevelopedanewnondestructivemethodbasedonOpticalScanning(Popovetal., 1999), toquicklymapthethermalconductivityandporosityofsamples. Wepresent theacquired2Dthermalconductivitymapsandthe computed2Dporositymaps.
Inthispaper,wepresentresultsfortwokindsofrock:graniteandsandstone,which both have specific structures (fractures and sedimentary heterogeneities, respectively).Theserocksare ofspecialinterestbecause,forcontinentalEurope,high enthalpy geothermaltargetsarelocatedinthedeeppartofthesedimentary basin,its basementanditslowerlevels,includingthebottomof thesedimentarycover,whichis generallysandstone(Genteretal., 2003;Bourquinetal.,2011).
2.Geologicalsettingandthermalconductivity/porosity mapselaboration
2.1.Sampledescription
Theselectedsamplesareexpectedtoillustratetwokindsoffluid flownetworksin deepgeothermaltargets.First,agranitesample affectedbyafracturezonewithquartz infillingattheedgeofan openfractureisakindofstructurecurrentlydescribedin granitic geothermalfields(Géraudetal.,2010).Second,asandstonesample is analyzed,whereasedimentologicalheterogeneitywasinduced bygrainsize variation.
Thegranitesample(K195-4777)wastakenfromtheEPS1 borehole,partofthe deepexperimentalgeothermalsiteofSoultzsous-Forêts(France)intheUpperRhine Graben(Genterand Traineau,1992;Rosener,2007)(Fig.1a).Thesampleislocated approximately 2162 m deep, in a granite zone that corresponds to a silicified/cataclasedhydrothermalalterationfacies(Rosener, 2007).Thisallowsthe differentcompartmenttypicallyencounteredinfaultzonestobestudied:theprotolith, thedamagedzone andthefaultcore(Caineetal.,1996;Géraudetal.,2010;Faulkner et al.,2010).Thesampleisdividedintothreezones(Fig.1a). Zone1correspondstoa damaged zoneand isanalteredzone composedof massiveorangefeldspar (orthoclase)associatedwith alteredfeldspar,somesmallsecondaryquartzandblack mica.It hasanincreaseinporosityduetoanalterationprocessinduced by hydrothermalfluids.Zone2ischaracterizedbyasizableconcentrationofsecondary quartzandhardlyanyalteredfeldspar.It correspondstotheprotolith.Zone3showsa partiallysealedlocalizedquartzfaultcore.
Thesandstonesample(EPS161)alsocamefromtheEPS1borehole(Haffen, 2012)(Fig.2a),andwasextractedatadepthof approximately1214m,fromthe Buntsandsteinsandstonesformation:“GrèsVosgiens”facies(Vernouxetal.,1995;
Bourquin etal.,2006).Thepetrographicfaciescorrespondstoclayedcoating sandstonealternatingwithcleansandstone(seeHaffen,2012; fordetails).Thesample canbedividedintotwozones(Fig.2a):zone 1iscomposedmainlyoffinetoveryfine darkbrowngrainedsandstone,andzone2ismainlymadeofmediumtofinebrown grained sandstone.Asmallfaultismarkedbyagapofapproximately5mm, whichis sealedoffbyextremelythinbariteprecipitation.
2.2.Measurementtechniques:thermalconductivityscanner (TCS)
OpticalScanningmeasurementsperformedwithaTCS(Popov etal.,1999;Popov etal.,2003)deliveralargesetofthermalconductivityvaluesfasterthanclassical laboratorytechniques,suchas withadivided-baroraliningsource(Sassetal.,1971, 1984).The OpticalScanningapparatuscorrespondstoamobileblockcomposedof twotemperaturesensorsoneithersideofaconstantand continuousheatsource.These threefixedelementsarelined-up onthemobileblock,paralleltothemobile displacementaxis.The blockmovesunderarailonwhichthesampletobemeasured
had beenpreviouslyplaced.Heatsourceandtemperaturesensorsmove at the same relative speed (TCS mobile block velocity: 4.99mms−1)
alongthescanningsurface,whichismaintainedataconstantdistancefromboth sensors.Thus,measuringthesampletemperature beforeandafteritsheatingis renderedfeasible.Thesedata,associatedwiththoseofthetwostandardssituated eithersideofthe measuredsampleandhavingathermalconductivityknowntobe closetothatofthesample,allowcalculatingtheabsolutethermalconductivityofthe sampletobecomepossible.Thistechnique thereforepermitstheobtainmentofa profileofthermalconductivityofthesamplealongascanline,witharesolutionof1 mm. Thescanlineisatamaximumof500mm,duetothelengthofthe apparatus,while therelativemeasurementerrorisapproximately 3%ofthemeasuredvalue(Popovet al.,1999).Theroomwheremeasurementswerecarriedoutwaskeptataconstant
temperature (20◦C±1◦C).Duringthemeasurements,theincreaseinsample temperaturewaslimitedto3◦C,rangingfrom20±1◦Ctoamaximumof23±1◦C.Abrief coolingtimewassystematicallyimposed betweentwoscanlinestorestricttheheating ofthesampleand ofthestandards.Thermalconductivityvariationsinducedbythe heatingofthesampleduring themeasurementwere neglected, sinceatthis temperaturerangethethermalconductivityvariation isinferiortothemeasurement error(VosteenandSchellschmidt, 2003).
2.3.Thermalconductivityandporositymap 2.3.1.Method
Thermalconductivityinrocksdependsmainlyonthreeparameters(e.g.
Farouki, 1981; Brigaudand Vasseur1989; Clauserand Huenges, 1995; MidttommeandRoaldset,1998):mineralogical composition,porosityand texture.Otherparameterscanalsocontrolthethermalconductivityofrocksaspore fluidspropertiesand structural/texturalpropertiesof rocksincludingrockanisotropy Theporosityofarock canbeestimated(SchärliandRybach,1982) atconstanttemperatureandpressure, usingcomparisonsbetween thermalconductivityvaluesobtainedforair-and water-saturated samples,whilemineralogyandothermicrostructuralparameters aretakenasbeingconstant.Foreachstate,thegeometricmean modelbasedon mixinglaws(Eq.(1),ClauserandHuenges,1995) isconsidered,asfollows: = × 1− (1) f
where (Wm−1 K−1)istheeffectivethermalconductivity,
f
(Wm−1 K−1) is the thermal conductivity of the fluid (air or water)
1 1
presentintheporosity((−)),andm (Wm− K− )isthethermal conductivityofthesolidmatrix.
Forasample,afirstsetofthermalconductivitymeasurementsunder air-saturatedconditionsandasecondsetofthermal conductivitymeasurementsunder water-saturatedconditionsare necessaryandtheseleadtotheporositycalculation (Eq.(2))asfollows(PribnowandSass,1995;Pribnowetal.,1996;Surmaand Geraud,2003;Haffen,2012):
satdry
= (2)
watair
1 1
wheresat (Wm− K− )isthethermalconductivityofthewater- saturated sample, (Wm−1 K−1) is the thermal conductivity of
dry
theair-saturatedsample,wat isthethermalconductivityofwater (0.6Wm−1 K−1,ClauserandHuenges,1995)and is the thermal
air conductivity of air (0.02Wm−
1 K−1,
Clauser and Huenges, 1995).
Thus,tocalculateporosity,wehaveconsideredasimplifiedcase, without needingtobuildanempiricalmodel(Somerton,1992).Satisfyingresultswere obtainedwiththeappliedmathematicalmodel, basedonamixinglaw(Pribnowet al.,1996;Hartmannetal.,2005).
Thismathematicalmodel(Eq.(2))wasusedtodeterminethe meanporosity valuefrommeasurementsofthethermalconductivityinbothdryandwetsamples. Here,weusetheOpticalScanning methodtomeasurethethermalconductivity. Fromthesemeasurementsandtheexperimentalmeasurementprotocolfirst proposed byRosener(2007),wecanbuilda2Dporositymapfrom2Dthermal conductivitymaps.Thisapproachletusobservemillimeterscale variationsof thermalconductivityandporosityforpluri-decimeter rocksamples.
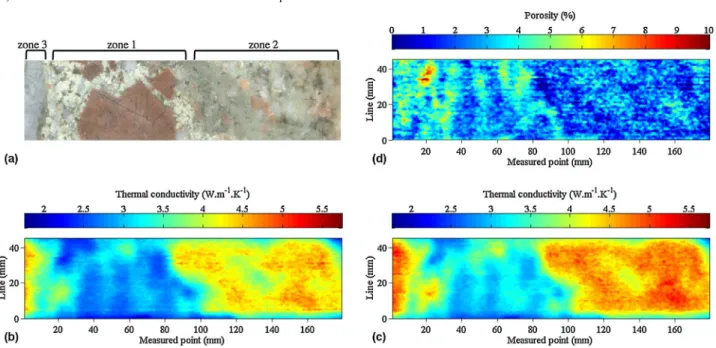
thewatersaturatedgranitesample;(d)Computedporositymapofthegranitesample. Fig.1.(a)Analyzedsurfaceofthegranitesample;(b)Measuredthermalconductivitymapoftheairsaturatedgranitesample;(c)Measuredthermalconductivitymapof
145
2.3.2.Mapconstruction
Beforemeasurements,surfacesofthesamplesthatweregoing tobe mappedweresawedwithadiamondsawandthesurfaces werecarefully brushedtoremovedust.Sothatallthesurfaceshave thesamealbedoandto avoidinterferencewiththemeasurements theywerepaintedblackwithspray paint,suchthatpaint-crushing thicknesswaslimited.Thenthesampleswere driedat60◦Cuntil theyreachedaconstantweight.Severalhoursbefore startingthe test,thesampleswereplacedinthemeasurementroom,soasto keepthematthermalequilibriumunderdryconditions.
ThesampleswerefirstplacedontheTCSrail,atthebeginning ofthe measurements.Aprofileofthermalconductivitywasthen determinedalonga
scanline(line000),ateachmillimeter(point1, point2,etc.,tothemthpoint). Later,withgreataccuracy,thesampleswereshifted1cmperpendiculartothe measurementaxisand anewprofilewascreated(line010).Themeasurement sequence hasbeendefinedasfollows(Fig.3): line000,line010,line020, line030,etc. line001,line011,line021,line031,etc. line002,line012,line022, line032,etc. line003,line013,line023,line033,etc.
...
untilthesurfaceswerecompletelyscanned.Thissequence wasdevelopedtolimit theheatingofthesample,whichcould
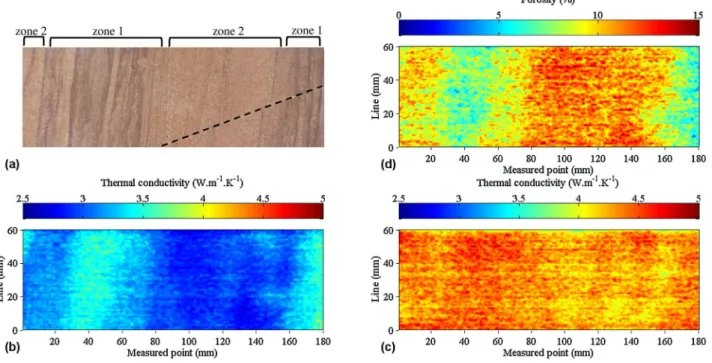
Fig.2.(a)Analyzedsurfaceofthesandstonesample,blackdottedlineindicatesthesealedfault;(b)Measuredthermalconductivitymapoftheairsaturatedsandstone sample;(c)Measuredthermalconductivitymap ofthewatersaturatedsandstonesample;(d)Computedporositymapofthesandstonesample.
Fig.3.(a)Photographofagranitesamplepreparedformeasurement,(b)Schematicrepresentationofthesample’sscannedsurface,indicatingthepositionofthemth measuredpointofthenthmeasuredline.
modifythethermalconductivitywithanincreaseintemperature (e.g.Abdulagatova etal.,2009).Asaresult,eachmeasuredpointis about1mmawayfromtheother measuredpointssurroundingit. Thesedataledtoa2Dthermalconductivitymapof air-saturated samples(nline×mpoint/line)witharesolutionof1mm.
Afterobtainingthefirstthermalconductivitymap,thesamples were water-saturatedbysubmergingthemindistilledwaterinside asealedvacuumchamberfor48 h.Thethermalconductivitymaps forwater-saturatedsampleswerederivedsimilarly totheprevious drytest.Theobjectivewastoaccuratelysuperposethetwomeasured
surfaces:lineXXX(underdryconditions)hadtobeinstrictly thesamepositionas lineXXX’(underwater-saturatedconditions). Tolimittheevaporationrisk,each sample except the measured surfaces waswrapped in plastic film.Weight measurementtests, performedonwater-saturatedsamplesbeforeandafterthermal conductivitymeasurementsindicatedthatwaterlosswaslower than1%.
Thermalconductivitymapscouldbedrawnforeachsample, underair-and water-saturated conditions and a porositymap could be computed fromthese by transformingEq.(2)inthefollowing way(Eq.(3)):
ln(sat)dryi,j
i,j = (3)
wat
wherei,j (−)istheporosityatthemthpointofmeasurementof thenthline,(sat)i,j (Wm− K− )isthethermalconductivityofthe
1 1
water-saturatedsampleatthemthpointofmeasurementofthe nthlineand(dry)i,j (Wm−
K− )thethermalconductivityofthe
1 1
drysampleatthemthpointofmeasurementofthenthline.
2.3.3.Watersaturationtest
Foreachsample,themeanporosityvalueobtainedfromthermal conductivity measurementscouldbecomparedtothetotalporositymeasuredfromthewater saturationtest(Melnyk andSkeet, 1986).This valuewasobtainedfrom an experimentalprotocol basedonthewatersaturationofasampleaftervacuum degassing. Initially,samplesweredriedat60◦Cuntiltheirweightbecameconstant(m1 ing)andwerelaterplacedinavacuumchamberfor 24h(afterthermalconductivity measurementswereperformed ondrysamples).Inthemeantime,distilledwaterwas degassed andthenusedtofillthesamplesbycapillarity.Thelevelofwater inthe sampleswasregularlyadjustedaccordingtothecapillary fringe.Oncetheywere entirelysubmersed,thevacuumwasbrokenandthesamplesretainedinwaterfor24h untiltheyreacha constantweight.Priortothermalconductivitymeasurements being carriedoutonwater-saturatedsamples,thesampleswere weighedtwice:firstly, under water-saturatedconditions(m2 in g) andsecondly,under hydrostatic conditions(m3 ing).Porosity( in%)wascalculatedasfollows(Eq.(4)):
m2 −m1 × 100 (4) m2 −m3
3.Results
UsingTCS,bothair-and-watersaturatedthermalconductivity2Dmapswere obtainedforthegraniteandsandstonesamples. Fromthesemaps,aporosity2D mapwascalculated.Histogramsof thermalconductivityandporositydistribution wereplottedfrom thepreviousmaps,todefinearelationshipbetweenporosityand mineralogy.
Forthetwosamplesanalyzed,statisticaldataofthermalconductivityand porosityaregiveninTable1.Thermalconductivity andporositymapsforthe graniteandsandstonesamplesare presentedinFigs.1and2,respectively. Histogramsofthermalconductivityandporositydistributionforthegraniteand sandstone samplesaregiveninFigs.4and5respectively.Thedistribution of thermalconductivitydependingonporosityisalsogivenin Figs.4and5, respectively,forthegraniteandsandstonesamples.
3.1.Granitesample
ThethreestructuralzonesdescribedinFig.1awereidentifiedonthermal conductivitymapsofthesampleunderbothairandwater-saturatedconditions (Fig.1b,c).Thethermalconductivity values for zone 1 ranged from about 1.80– 3.60Wm−1 K−1 for
the air-saturated sample and from about 2.00–4.25Wm−1 K−1 for
thewater-saturatedsample.Forzone2,thethermalconductivity values ranged from about 3.60–5.00Wm−1 K−1 and from 3.75 to
5.25Wm−1 K−1 for the air- and water-saturated samples, respec-
tively.Thethermalconductivityvaluesforzone3rangedfrom about 3.60–4.90Wm−1
K−1 and from about 3.75–5.50Wm−1 K−1
forthesamesamples.Theporositymap(Fig.1d)indicatesthatthe valuesofzone1 rangedfromzerototen%,thoseofzone2ranged betweenzeroandfive%andthe porosityvaluesofzone3ranged fromzerouptoabouteight%.Thus,thequartz cementationin the matrix (zone2)tended toincrease thelocal thermal conductivity andtodecreasethelocalporosity,whileconverselyfeldspar alterationdecreasedthelocalthermalconductivityandincreasedthe local porosity(zone1).
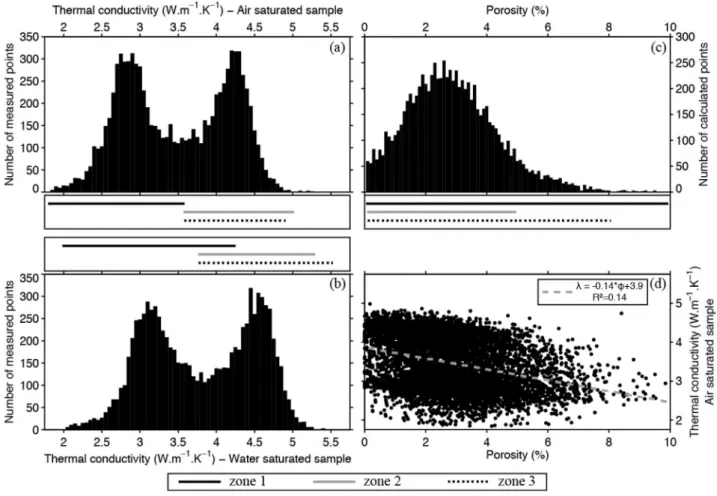
Histogramsofthermalconductivitydistribution,underbothairand water-saturatedconditionsforthegranitesample(Fig.4a,b) presentedthesamebimodal globaltrend,withtwowell-marked peaksofmeasuredthermalconductivity values.Intheair-saturated case (Fig. 4a), peaks were centered on 2.90 and 4.17Wm−1 K−1,
with a gap of about 1.27Wm−1 K−1. In the water-saturated case
(Fig. 4b), peaks were centered on 3.25 and 4.50Wm−1 K−1, with
a gap of about 1.25Wm−1 K−1. A comparison between thermal
conductivityhistogramsandmapssuggestedthatforbothairandwater-saturated cases,thelowervaluepeakscorresponded tozone1,composedmainlyofmassive feldsparassociatedwith alteredfeldsparandsomesmallsecondaryquartz (theoretical thermal conductivity values: Quartz=7.8Wm−1 K−1, Feldspar-
Table1
Statisticaldataofthermalconductivityandporosityforthetwostudiedsamples(std.:standarddeviation;m1:weightoftheairsaturatedsample;m2:weightofthewater saturatedsample;m3:weightofthesampleunder
hydrostaticcondition).
Sample Scanned surface
(length×width) (mm)
Thermal conductivity map (W m−1 K−1)
Saturation mean std. min. max.
Porositymap(%)
mean std. min.
max.
Waterporosity
m1 (g) m2 (g) m3 (g) (%) Granite (K195-4777) 180 × 50 air water 3.49 ± 0.10 3.81 ± 0.11 0.70 0.72 1.84 2.04 6.36 7.08 2.87 ± 0.14 1.52 0.01 9.85 602.80 609.61 374.67 2.90 ± 0.09 (EPS1 6 1) 181×61 4.283.13±±0.130.090.180.23 2.533.59 4.93 9.27±0.46 1.98 0.72 16.22 1048.45 1092.44 649.08 9.92±0.30
147
K=2.3Wm−1 K−1, Clauser and Huenges, 1995; Fjeldskaar et al.,
2009).Atthesametime,peaksofthehighervaluesofthermalconductivity,forboth air-andwater-saturatedcases,corresponded toamixtureofzone2andzone3,both mainlycomposedof quartz.Thegapbetweenthetheoreticalandmeasured thermalconductivityinthesetwozonescanbeexplainedbythe porosityandthe presenceofsmallamountsoffeldsparand mica,whichhavelowerthermal conductivityvaluesthanquartz andcanmodifythecontactbetweengrains
(theoretical thermal conductivity values: Biotite=2.3Wm−1 K−1, air=0.02Wm−1 K−1,
water=0.6Wm−
1 K−1,ClauserandHuenges,1995;Fjeldskaaretal.,
2009).Thehistogramofporositydistribution(Fig.4c)showsaunimodalglobaltrend (Gaussianshape)withamaximumofcalculated pointsforaporosityvalueofabout 2.60%.Thisbehaviorcanbe explainedbyconstantgapsbetweenpeaksofthermal conductivity, whateverthesaturationcondition.Thesaturationofthesampleby waterprovokedalinearincreaseinthermalconductivityinallthree structuralzonesof thesample.Thedistribution ofthermalconductivity(air-saturatedcondition) dependingontheporosity(Fig.4d)
Fig. 4. Granite sample: (a), (b), distribution of measured thermal conductivity values, in the air and water saturated sample respectively (column width: 0.05Wm−1 K−1);
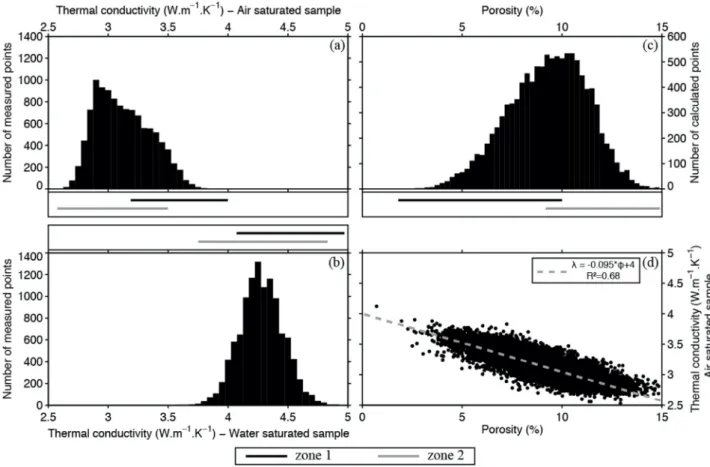
Fig. 5. Sandstone sample: (a), (b), distribution of measured thermal conductivity values, in the air and water saturated sample respectively (column width: 0.05Wm−1 K−1);
(c)distributionofthecalculatedporosityvalues(columnwidth:0.25%);(d)relationshipbetweencalculatedporosityvaluesandmeasuredthermalconductivityvaluesof theairsaturatedsample.
indicatedaglobalbutnotwell-markeddecreaseofthermalconductivity,whilethe porosityincreased(simplelinearregression: ThetwopeaksobservedinFig.4aandb werealso denotedbyapoorly-markeddecreaseofthermal conductivityanda porosityincrease.Thus,mineralogicaldistributionthroughoutthe sampleplaysamajorroleinthethermalconductivity,whereasthe porosityisless sensitivetomineralogicaldistribution.
Themeanporosity(Table1)calculatedfromthermalconductivitymapsis2.87± 0.14%,closetothewaterporosityvalueof 2.90±0.09%.
3.2.Sandstonesample
ThetwozonesdescribedinFig.2acouldbeidentifiedon thethermalconductivity mapofthedrysample(Fig.2b).Zone 1indicatedthermalconductivityvaluesranging between3.20 and 4.00Wm−1 K−1 whereas zone 2 showed thermal conductivity
values ranging from 2.60 to 3.50Wm−1 K−1. The thermal conduc-
tivitymapofthewater-saturatedsample(Fig.2c)appearedmore homogeneousthan thatofthedrysample.Inzone1,thethermal conductivity values ranged between 4.10 and 5.00Wm−1 K−1
whereasinzone2valueswerecomprisedbetween3.75and 4.80Wm−1 K−1. The porosity map (Fig. 2d) displayed two main
zoneslocatedatthelevelofthemainstructures(Fig.2a).Zone1had porosityvalues rangingbetweentwoandten%whereastheporosityvalueswerecomprisedbetween nineandfifteen%forzone2. However,thesmallfaultdoesnotappearonthermal conductivity andporositymaps.Thus,thedecreaseinthegrainsize(fromzone 2to zone1)resultedinanincreaseinthethermalconductivity associatedwithadecreasein thelocalporosity.
Forthesandstonesample,histogramsofthermalconductivitydistribution underbothair-andwater-saturatedconditions (Fig.5a,b)presentedthesame unimodalglobaltrend,withone peakofmeasuredthermalconductivityvalues.In theair-saturated case (Fig. 5a), the peak showed a maximum at 2.9Wm−1 K−1, while
inthewater-saturatedcase(Fig.5b),theequivalentwasabout 4.25Wm−1 K−1. The comparison between thermal conductivity
histogramsandmapsinair-saturationconditions,suggestedthat thelowervalues ofthermalconductivityinthepeakscorresponded tozone2,composedmainlyof mediumgrains,whereasthehigher valuesofthermalconductivitycorresponded tozone1,composed mainlyoffinegrains.Thesametrendwasless-markedunder water-saturationconditions.Thehistogramofporositydistribution (Fig.5c) showedaunimodalglobaltrend,withamaximumofcalculatedpointsfora porosityvalueofabout10.40%.Thelowervalues inthepeakofporosity correspondedtozone1,whereasthehigher valuescorrespondedtozone2.The globalhighvaluesofporosity inthesampleandthepresenceofaclayedcoating couldexplain thelowthermalconductivitymeasuredunderdryconditions (theoretical thermal conductivity values for Illite grains=1.9Wm−1 K−1,
149
ClauserandHuenges,1995;Fjeldskaaretal.,2009)andtheincrease ofthermal conductivityvaluesunderwater-saturatedconditions (Thegapbetweenthe maximumthermalconductivityunderairor water-saturated conditions is about 1.35Wm−1 K−1). The distri-
butionofthermalconductivity(air-saturatedcondition) depending onthe porosity(Fig.5d)indicatedaglobaldecreaseofthermal conductivitywiththe porosityincrease(simplelinearregression: Thus,thegrainsizevariationin laminae, associatedwithmineralogicalsmall variations,ledtoa modificationinthethermalconductivityand porosity distributionatthe millimeterscale.Thesevariationsseemtobecontinuousatthe core scale.
Themeanporosity(Table1)deducedfromthermalconductivity mapsis9.27± 0.46%,closetotheporosityvalueobtainedfrommass weightduringawater saturationtest:9.92±0.30%.
4.Discussion • Mapconstruction
Thethermalconductivityandporositymapswereobtainedfrom successive measurements,throughthescanningofasamplesaturatedwithbothairandwater. TheTCSallowsmeasurementsof thethermalconductivityprofiletobemade,ata densityofone pointpermillimeter.Fromaprofilecarriedoutateachmillimeter, thecalculationofaporosityvalueforeachmillimetersquareof asamplesurfaceis madepossible.Foreachsampleanalyzed,relativelysimilarporosityvalueshave beendeterminedfromboth thermalconductivityandwatersaturationtests(Table 1).Nevertheless,variationsareobservedandthesecanbeexplainedby the followingthreeparameters:thefirstistheresultofthedifferencebetweenthe volumesinvestigatedbythetwomethods. Theentirevolumeofasampleis analyzedduringwaterporosity measurements,whereasamorelimitedvolume underthescanningsurfaceisanalyzedbythethermalconductivitymeasurements (Popov,1997),wherethevolumeinvestigatedis2.5cmmaximum thick.The secondinvolvesthemodificationofthecontactresistancebetweenthedifferent componentsofarocksampleresulting fromwatersaturationandcouldthusalter thethermalconductivitycharacteristics(e.g.Farouki,1981).Thethirdisinduced bya relativelysignificantgapbetweenthethermalconductivityofthe standards andthatofthesample:alargergapwouldtriggeramore extensivemistakeofthe thermalconductivityvalue.Indeed,forthe granitesample,thermalconductivity variationsbetweentheairandwater-saturatedconditionsarelowandinduceno changein standardswhentheexperimentalvaluesremainclosetostandard ones. Forthesandstonesample,therelativehighporosityofthe materialimpliesa changeinstandardsbetweentheair-andwatersaturatedconditions.Standards usedfortheair-saturatedsample measurementshavearelativelylowthermal conductivityvalue forthewater-saturatedsamplemeasurements.Thisgap induces theunderestimationoftheporosityfromthethermalconductivity measurements.
• Informationaboutsamples
Thegraniteandsandstonesamplesarebothmainlycomposed ofquartzand feldspar.However,thethermalconductivitymaps andhistogramsofthermal conductivitydistributionaredifferent, withabimodaldistributionforthegranite andaunimodaldistributionforthesandstone.Thesefeaturecanbeexplainedby the well-markeddifferenceofthermalconductivitybetweenquartz andfeldspar, associatedwiththesizeofthegrainsinthesamples: coarseinthegraniteandfineto mediuminthesandstone,and bythefactthattheTCScannotindividualizefine grainproperties (lowertoafew-millimetersinscale).
In granite and sandstone samples, the porosity distribution is quite heterogeneous,i.e.therearevariationsinthelocalizationof themost(andthe lesser)porouszones,althoughthedistribution oftheporosityisunimodalinboth cases. In the granite sample, the porosity is controlled by structural
heterogeneities:theporosityis mainlylocatednearthefaultalonggrainbordersin analteredzone wherehydrothermalfluidshavepartiallydissolvedthegrains.In the sandstone sample, the porosity is controlled by sedimentological heterogeneities:theporosityappearsaccordingtoalayered organization.Inside eachlayer,theporosityisquitehomogeneous. Theporosityvariesinfunctionof thefaciesdistributionandiscontrolledbygrainssizeinsideeachband.Thus, porosityvariations, insidebothsamples,arenot extremely‘cut’,thereis progressive transitionbetweenthemostandthelessporouszones,atthescale of thesample.
Inthegranitesample,constantgapsbetweenpeaksofthermal conductivity distribution,whateverthesaturationcondition,were observed.Thesaturationofthe samplebywaterprovokesalinearincreaseinthethermalconductivityinthestructural zonesof thesample.Thus,thepercentageincreaseinthermalconductivity inducedby waterishigherforthepeakcorrespondingtothelower thermalconductivity,i.e.the feldspar-richzone,thantheonecorrespondingtothehigherthermalconductivity,i.e. thequartz-rich zone.
Thethermalconductivityandporositymapspresentvaluesthat areinagreement withotherclassicalmeasurementsperformedon equivalentmaterials,usingthesame orothertechniques(Vernoux etal.,1995;Sizun,1995;SurmaandGéraud,2003; Haffen,2012). Nevertheless,themappingofthesephysicalpropertiesbringsmore information,notablyconcerningthelocationofthemost,orless, porousand conductivezonesinsamples.Thesezonescanbelinked tostructuralandpetrographic featuresandsoleadtotheimprovementoftheknowledgeoffluidandheatexchangesin reservoirs.
5.Conclusion
Fromthermalconductivityandporositymaps,wehaveput forwardtheimpactof petrophysical heterogeneitiescommonly present in a granite and sandstone geothermalreservoirs,i.e.fault zoneandpermeablelayersrespectively.Themaps allowthestudy ofthermalconductivityandporosityvariation,atmillimetric resolutionandatcorescale.Fromtwoscansofasamplesurface,in air-saturated conditionsontheonehand,andinwater-saturated conditionsontheotherhand, porosity maps can be established. These allow precise quantification and determinationofthesizeof thermalconductivityandporosityheterogeneities inducedbyrock heterogeneities.
Acknowledgments
Theauthorswould liketothankEEIGHeatMining andA.Genter (ES Geothermie),thescientificcoordinator,forallowingaccessto thecoresoftheEPS1 borehole.
References
Abdulagatova,Z.,Abdulagatov,I.M.,Emirov,V.N.,2009.Effectoftemperatureand pressureonthe thermalconductivityofsandstone.Int.J.RockMech.Min.Sci. 46,1055–1071.
Bertani,R.,2012.Geothermalpowergenerationintheworld2005–2010update report.Geothermics41, 1–29.
Birsch,F.,1966.Thermalconductivityanddiffusivity.In:Clark,S.P.(Ed.),Handbook ofPhysical Constants,Rev.Eds.,Memoir,Vol.97.GeologicalSocietyofAmerica, pp.97–173.
Bourquin,S.,Péron,S.,Durant,M.,2006.LowerTriassicsequencestratigraphyof thewesternpartofthe GermanBasin(westofBlackForest):Fluvialsystem evolutionthroughtimeandspace.Sediment. Geol.186,187–211.
Bourquin,S.,Bercovici,A.,Lopez-Gomez,J.,Diez,J.B.,Broutin,J.,Ronchi,A.,Durant, M.,Arché,A., Linol,A.,Amour,F.,2011.ThePermian-Triassictransitionandthe onsetofMesozoic sedimentationatthenorthwesternperi-Tethyandomaine scale:palegeographicmapand geodynamicimplication.Paloegeography, Paleoclimatology,Paleoecology299,265–280.
Brigaud,F.,Vasseur,G.,1989.Mineralogical,porosityandfluidcontrolonthe thermalconductivityof sedimentaryrocks.Geophys.J.98,525–542.
Caine,J.S.,Evans,J.P.,Forster,C.B.,1996.Faultzonearchitectureandpermeability structure.Geology 24,1025–1028.
Cermak,V.,Rybach,L.,1982.ThermalConductivityandSpecificHeatofMinerals andRocksIn Landolt-Börnstein,NewSeries,GroupV(1a):Geophysics.
Springer,pp.305–343.
Civan,F.,2011.PorousMediaTransportPhenomena.JohnWiley&Sons,USA (400p.).
Clauser,C.,Huenges,E.,1995.Thermalconductivityofrockandminerals.In: Ahrens,T.J.(Ed.),Rock PhysicsandPhaseRelation-aHandbookofPhysical Constants,Vol.3.AGUreferenceshelf,pp. 105–126.
Clauser,C.,2006.Geothermalenergy.In:Heinloth,K.(Ed.),Landolt-Börnstein, GroupVIII:Advanced MaterialandTechnologies,Vol.3:EnergyTechnology, Subvol.C:RenewableEnergy.Springer, pp.493–604.
Dickson,M.H.,Fanelli,M.,2003.GeothermalEnergy:UtilizationandTechnology (ISBN 92-3-103915-6.221p.).
Farouki,O.,1981.ThermalPropertiesofSoils,CRRELMonograph81-1.USArmy ColdRegion ResearchandEngineering,HanoverNewHampshire,USA(151p.).
Faulkner,D.R.,Jackson,C.A.L.,Lunn,R.J.,Schlische,R.W.,Shipton,Z.K.,Wibberley, C.A.J., Withjack,M.O.,2010.Areviewofrecentdevelopmentsconcerningthe structure,mechanicsand fluidflowpropertiesoffaultzones.J.Struct.Geol.32, 1557–1575.
Fjeldskaar,W.,Christie,O.H.J.,Midttomme,K.,Virnovsky,G.,Jensen,N.B.,Lohne,A., Eide,G.I., Balling,N.,2009.Onthedeterminationofthermalconductivityof sedimentaryrocksandthe significanceforbasintemperaturehistory.Pet. Geosci.15,367–380.
Fritz,B.,Jacquot,E.,Jacquemont,B.,Baldeyrou-Bailly,A.,Rosener,M.,Vidal,O., 2010.Geochemical modellingoffluid–rockinteractionsinthecontextofthe Soultz-sous-Forêtsgeothermalsystem. C.R.Geosci.342(7),653–667.
Géraud,Y.,Rosener,M.,Surma,F.,Place,J.,LeGarzic,E.,Diraison,M.,2010.Physical propertiesof faultzoneswithinagranitebody:exampleofthe Soultz-sous-Forêtsgeothermalsite.C.R.Geosci. 342,566–574.
Genter,A.,Traineau,H.,1992.BoreholeEPS1:AlsaceFrance:preliminary geologicalresultsfrom granitecoreanalysisforHotDryRockresearch.Sci. Drill.3,205–214.
Genter,A.,Guillou-Frottier,L.,Feybasse,J.L.,Nicol,N.,Dezayes,C.,Schwartz,S., 2003.Typologyof potentialhotfracturedrockressoucesineurope.
Geothermics32,701–710.
Haenel,R.,Rybach,L.,Stegena,L.,1988.HandbookofTerrestrialHeat-FlowDensity Determination. KluwerAcademicPublishers,Dordrecht.
Haffen,S.,Géraud,Y.,Diraison,M.,Dezayes,C.,2013.Fluid-flowzonesina geothermalsandstone reservoir:localizationfromthermalconductivityand temperaturelogs,boreholeEPS1 (Soultz-sous-Forêts,France)and3Dmodels. In:Proceedings,Thirty-EighthWorkshoponGeothermal Reservoir Engineering,StanfordUniversity,Stanford,California,February11–13,2013 (SGP-TR-198).
Haffen,S.,2012.CaractéristiquesgéothermiquesDuréservoirGréseuxDu Buntsandsteind’Alsace. Thesis.InstitutdePhysiqueduGlobedeStrasbourg, UniversitédeStrasbourg,Strasbourg,France (391p.InFrench).
Hartmann,A.,Rath,V.,Clauser,C.,2005.Thermalconductivityfromcoreandwell logdata.Int.J.Rock Mech.Min.Sci.42,1042–1055.
Hartmann,A.,Pechnig,R.,Clauser,C.,2008.Petrophysicalanalysisofregional-scale thermal propertiesforimprovedsimulationsofgeothermalinstallationsand basin-scaleheatandfluidflow. InternationalJournalofEarthScienceGR97, 421–433.
Lund,W.J.,Freeston,D.H.,Boyd,T.L.,2011.Directutilizationofgeothermalenergy 2010worldwide review.Geothermics40,159–180.
Meier,D.B.,Gunnlaugsson,E.,Gunnarsson,I.,Jamtveit,B.,Peacock,C.L.,Benning, L.G.,2014.
Microstructuralandchemicalvariationinsilica-richprecipitatesat theHellisheioigeothermal powerplant.Mineral.Mag.78(6),1381–1389.
Melnyk,T.W.,Skeet,A.M.M.,1986.Animprovedtechniqueforthedetermination ofrockporosity. CanadianJournalofEarthScience23,1068–1074.
Midttomme,K.,Roaldset,E.,1998.Theeffectofgrainsizeonthermalconductivity ofquartzsandsand silts.Pet.Geosci.4,165–172.
Norton,D.,Knapp,R.,1977.Transportphenomenainhydrothermalsystems:the natureofporosity.Am. J.Sci.277,913–917.
Norton,D.,1979.Transportphenomenainhydrothermalsystems:the redistributionofchemical componentsaroundcoolingplutons.Bull.Mineral. 102,471–486.
Popov,Y.A.,Pribnow,D.F.C.,Sass,J.H.,Williams,C.F.,Burkhardt,H.,1999. Characterizationofrock thermalconductivitybyhigh-resolutionoptical scanning.Geothermics28,253–276.
Popov,Y.A.,Pohl,J.,Romushkevich,R.,Tertychnyi,V.,Soffel,H.C.,2003.Geothermal characteristics oftheRiesimpactstructure.Geophys.J.Int.154(2),355–378.
Popov,Y.A.,1997.Opticalscanningtechnologyfornondestructivecontactless measurementsof thermalconductivityanddiffusivityofsolidmatters. Brussels,BelgiumIn:ExperimentalHeat
Transfer,FluidMechanicsand ThermodynamicsProceedingofthe4thWorldConference,1, pp.109–117.
Pribnow,D.F.C.,Sass,J.H.,1995.Determinationofthermalconductivityfordeep boreholes.J. Geophys.Res.100,9981–9994.
Pribnow,D.F.C.,Williams,C.F.,Sass,J.H.,Keating,R.,1996.Thermalconductivityof water-saturated rocksfromtheKTBpilotholeattemperatureof25–300◦C.
GeophysicalResearchLetter23,391–394.
Rosener,M.,2007.EtudepétrophysiqueEtModélisationDesEffetsDesTransferts ThermiquesEntre RocheEtFluideDansLeContextegéothermiqueDe Soultz-sous-Forêts.Thesis.Institutde PhysiqueduGlobedeStrasbourg, UniversitéLouisPasteur,Strasbourg,France(207p.InFrench).
Sass,J.H.,Lachenbruch,A.H.,Munroe,R.J.,1971.Thermalconductivityofrocks from measurementsonfragmentsanditsapplicationtoheat-flow determination.J.Geophys.Res. 76,3391–3401.
Sass,J.H.,Stone,C.,Munroe,R.J.,1984.Thermalconductivitydeterminationson solidrock−a comparisonbetweensteadystatedividedbarapparatusanda commercialtransientline-source device.J.Volcanol.Geotherm.Res.20, 145–153.
Schärli,U.,Rybach,L.,1982.Onthethermalconductivityoflow-porosity crystallinerocks. Tectonophysics103,307–313.
Seibt,P.,Kellner,T.,2003.Practicalexperienceinthereinjectionofcooledthermal waterbackinto sandstonereservoirs.Geothermics32,733–741.
Siffert,D.,Haffen,S.,Garcia,M.H.,Géraud,Y.,2013.Phenomenologicalstudyof temperaturegradient anomaliesintheBuntsandsteinformation,abovethe Soultzgeothermalreservoir,usingTOUGH2 simulations.In:Proceedings, Thirty-EighthWorkshoponGeothermalReservoirEngineering, Stanford University,Stanford,California,February11–13,2013(SGP-TR-198).
Sizun,J.P.,1995.ModificationDesStructuresDePorositéDeGrèsLorsDe Transformations pétrographiquesDansLaDiagenèseEtl’hydrothermalisme Thèse.InstitutdeGéologie. Strasbourg,UniversitéLouisPasteur,Strasbourg, France(297p.InFrench).
Somerton,W.H.,1992.ThermalPropertiesandTemperature–relatedBehaviourof Rock/fluidSystem. ElsevierSciencePublishingCompany,NewYork(257p.).
Surma,F.,Geraud,Y.,2003.Porosityandthermalconductivityofthe soultz-sous-Forêtsgranite.Pure Appl.Geophys.160,1125–1136.
Tritt,T.M.,2004.Thermalconductivity,theory,propertiesandapplication.In:Tritt, Terry(Ed.),Physics ofSolidsandLiquids),IncludesBibliographicalReferences andIndex.KluwerAcademic/Plenum Publishers,NewYork(290p.).
Ungemach,P.,2003.Reinjectionofcooledgeothermalbrinesintosandstone reservoirs.Geothermics 32,743–761.
Vernoux,J.F.,Genter,A.,Razin,P.,Vinchon,C.,1995.Geologicalandpetrophysical parametersofa deepfracturedsandstoneformationasappliedtogeothermal exploitation.In:RapportBRGM R38622.EPS-1borehole,Soultz-sous-Forêts, France(70p.,24fig.,5tabl.,3append).
Vosteen,H.D.,Schellschmidt,R.,2003.Influenceoftemperatureonthermal conductivity,thermal capacityandthermaldiffusivityofdifferenttypesof rock.Phys.Chem.Earth28,499–509.
Zinszner,B.,Pellerin,F.M.,2007.AGeoscientist’sGuidetoPetrophysics.IFP Publication,Edition TECHNIP,Paris,France,pp.384p.