HAL Id: hal-00304703
https://hal.archives-ouvertes.fr/hal-00304703
Submitted on 1 Jan 2002HAL is a multi-disciplinary open access archive for the deposit and dissemination of sci-entific research documents, whether they are pub-lished or not. The documents may come from teaching and research institutions in France or abroad, or from public or private research centers.
L’archive ouverte pluridisciplinaire HAL, est destinée au dépôt et à la diffusion de documents scientifiques de niveau recherche, publiés ou non, émanant des établissements d’enseignement et de recherche français ou étrangers, des laboratoires publics ou privés.
River Tweed, Scotland: an application of the INCA
model
H. P. Jarvie, A. J. Wade, D. Butterfield, P. G. Whitehead, C. I. Tindall, W.
A. Virtue, W. Dryburgh, A. Mcgraw
To cite this version:
H. P. Jarvie, A. J. Wade, D. Butterfield, P. G. Whitehead, C. I. Tindall, et al.. Modelling nitrogen dynamics and distributions in the River Tweed, Scotland: an application of the INCA model. Hydrol-ogy and Earth System Sciences Discussions, European Geosciences Union, 2002, 6 (3), pp.433-454. �hal-00304703�
Modelling nitrogen dynamics and distributions in the River
Tweed, Scotland: an application of the INCA model
H.P. Jarvie
1, A.J. Wade
2, D. Butterfield
2, P.G. Whitehead
2, C.I. Tindall
1, W.A. Virtue
3,
W. Dryburgh
3and A. McGraw
31Centre for Ecology and Hydrology, Wallingford, OX10 8BB, UK
2Aquatic Environments Research Centre, University of Reading. RG6 6AB, UK
3Scottish Environment Protection Agency, Burnbrae, Mossilee Road, Galashiels, TD1 1NF, UK
Email for corresponding author: [email protected]
Abstract
The INCA (Integrated Nitrogen in Catchments) model was applied to the River Tweed in the Scottish Borders, a large-scale (4400km2),
spatially heterogeneous catchment, draining a wide range of agricultural land-use types, and which contributes approximately 20% of UK river flows to the North Sea. The model was calibrated for the first four years’ data record (1994 to 1997) and tested over the following three years (1998 to 2000). The model calibration and testing periods incorporated a high degree of variability in climatic conditions and river flows within the Tweed catchment. The ability of the INCA model to reproduce broad-scale spatial patterns and seasonal dynamics in river flows and nitrate concentrations suggests that the processes controlling first order variability in river water nitrate concentrations have been represented successfully within the model. The tendency of the model to overestimate summer/early autumn baseflow nitrate concentrations during dry years may be linked to the operation of aquatic plant uptake effects. It is, therefore, suggested that consideration be given to incorporating a spatially and temporally variable in-stream plant uptake term for the application of INCA to lowland eutrophic rivers. Scenarios to examine possible impacts of environmental change on nitrate concentrations on the Tweed are examined. These include the effects of (i) implementing different recommendations for fertiliser use and land use change under the Nitrate Sensitive Areas (NSA) Scheme and the Scottish Code of Good Agricultural Practice, (ii) worst case scenario changes linked to a dramatic reduction in livestock numbers as a result of a crisis in UK livestock farming and (iii) changes in atmospheric nitrogen deposition.
Keywords: Nitrate, nitrogen, modelling, Tweed, INCA
Introduction
Nitrogen (N), in combination with phosphorus (P), plays an important role in controlling the trophic status of surface waters. Increasing loadings of N and P from anthropogenic activity (agriculture, wastewater disposal and atmospheric emissions) have resulted in widespread enrichment of nutrients in surface waters and associated problems of eutrophication linked to excessive accumulation of phytoplankton/filamentous algal biomass, toxic algal blooms and dissolved oxygen depletion. Eutrophication is most visibly apparent in lowland rivers which tend to receive greatest nitrogen inputs from agriculture and effluent, and exhibit higher in-stream nutrient concentrations than upland streams. However, there are growing concerns about the nutrient status of upland streams and their sensitivity to
acidification and changes in trophic status (Neal, 2002). Nitrogen saturation (whereby deposition exceeds biotic demand (Emmett et al., 1995; Stoddart, 1994)) is a growing concern in upland catchments, linked to increasing N inputs from atmospheric deposition (Fowler et al., 1989) and enhanced rates of N leaching from forestry (Emmett et al., 1993; Dise and Wright, 1995).
Various strategies are employed to control N inputs to rivers at the national (UK) and European levels. A major instrument for control of N losses to surface and groundwaters is the 1992 European Nitrate Directive, which focuses on prevention at source and provides recommendations for changes in agricultural practice and land use. In the UK, the Nitrate Sensitive Areas scheme introduced by the Ministry for Agriculture, Fisheries and
Food (MAFF, 1989) and the Code of Good Agricultural Practice (MAFF/WOAD, 1991; Scottish Office, 1997) provide specific guidelines to farmers to minimise losses of N from agricultural land, and are discussed further by Parkinson (1993) and Ball (1993). However, the combined impact of these policies on controlling nitrogen pollution in rivers is uncertain.
Nitrate is the predominant form of nitrogen transported in rivers and is derived from a wide variety of sources within catchments: fertilisers, sewage and industrial effluents, atmospheric inputs and mineralisation and nitrification of organic nitrogen in soils (Stewart et al., 1982; Heathwaite
et al., 1996). The release of nitrate and subsequent transport,
exchanges and transformations within the catchment and stream network are controlled by a complex set of biological, physical and chemical processes, which are highly variable in both space and time. Water quality models provide simplified representation of this highly complex system in order to assess and analyse source contributions and flux modifications in catchments (e.g. MAGIC, Cosby et al., 1985a,b; MERLIN, Cosby et al., 1997) and in rivers (e.g. QUASAR, Whitehead et al., 1997). The INCA model (Integrated Nitrogen Model for Multiple Source Assessment in Catchments), used in this study, integrates both catchment delivery of nitrogen and nitrogen transport and transformation along river reaches within one model (Whitehead et al., 1998a,b; Wade et al., 2002). By simulating sources and processes controlling N delivery and transport, models can provide valuable tools for catchment management and policy decision-making. Models can be used to assess possible impacts of measures aimed at reducing and managing nitrogen in river systems.
INCA models the delivery and transport of N through the catchment-river continuum, incorporating hydrological and biogeochemical processes. INCA is designed to be applied at scales appropriate for catchment management and utilises readily-available land use and hydrological data to simulate mean daily soil N leaching loads.
The River Tweed provides a valuable case study for examining N sources and dynamics within the coupled catchment delivery and river reach modelling framework of INCA. The Tweed is a major river system and drains a largely rural catchment, in contrast to some of the other UK and European rivers draining into the North Sea, which have highly populated and industrialised catchments, and thus carry greater pollutant loads (Robson and Neal, 1997; Jarvie
et al., 1998). The Tweed catchment, which covers an area
of 4400 km2, is characterised by large spatial variability in
both physiographic setting, hydrology, land use and nitrate concentrations: from upland areas in the west, which are dominated by high rainfall, moorland and rough grazing
land, to the intensively farmed arable lowland areas of the eastern catchment. The River Tweed is of national ecological importance and was designated a Site of Special Scientific Interest in 1976. This designation recognises that the Tweed represents (i) a nationally important example of a nutrient rich river system, with characteristic hydrological and biological sequences (ii) one of the least polluted of the easterly flowing large eutrophic British rivers (iii) the northern distribution limit of certain plant species in Britain and (iv) one of the most important salmon fisheries in the UK (Clayton, 1997). A wealth of water quality data also exists for the River Tweed, which have been used for application of the INCA model (Table 1). Long-term routine monitoring data have been collected by the Scottish Environment Protection Agency (SEPA) and the Tweed has also been a focus within a major UK community research programme, the Land Ocean Interaction Study (LOIS), with detailed water quality studies at key river sites undertaken between 1994 and 1997 (Robson and Neal, 1997; Neal et
al., 1997).
The major objectives of this study were as follows: 1. To examine the ability of INCA to model the river water
nitrate dynamics and variability across the large-scale and spatially heterogeneous Tweed catchment for a seven year time period (1994 to 2000), which was characterised by large variability in river flow and climatic conditions.
2. To examine the relative contributions of nitrate from different land uses and point sources through time and along a 160 km river continuum from the upland headwaters to the lowland input to the coastal zone. 3. To simulate the impact of possible land use change
scenarios in the Scottish Borders region (linked to current changes in agricultural practices and nitrate control guidelines detailed in the Scottish Code of Good Agricultural Practice (Scottish Office, 1997)). 4. To examine the effects of changes in atmospheric
nitrogen deposition on in-stream nitrate concentrations.
The Tweed catchment
The characteristics of the Tweed catchment are described in detail in Robson et al. (1996) and Robson and Neal (1997). The Tweed drains eastern slopes of the Scottish Southern Uplands, with elevations ranging from 800 m to sea level. Mean annual rainfall across the catchment for 1969 to 1996 was 990 mm (Institute of Hydrology, 1998).
Table 1. Summary of data used in INCA modelling of the River Tweed
Data Description Source of data Reference
Streamwater NO3-N and NH4-N Spot samples from 12 sites SEPA concentrations along the main stem of the
River Tweed. Weekly to monthly sampling for 1994 – 2000
Streamwater NO3-N and NH4-N LOIS weekly sampling at NERC Land Ocean Leeks et al. (1997) concentrations Boleside (Reach 12) and Interaction Study – LOIS
Norham (Reach 23) for database 1994 to 1996
Effluent NO3-N and NH4-N Intermittent spot samples SEPA concentrations and flow used to calculate mean daily
flows and concentrations (assumed to be constant through the year)
River flows Mean daily flows for six National River Flow Institute of Hydrology (1998) gauging stations on the main Archive
stem of the Tweed (1994 – 2000)
MORECS rainfall, temperature Derived daily time series Meteorological Office Meteorological Office, (1981) and soil moisture deficit
Base Flow Index Derived for each flow gauging Institute of Hydrology Institute of Hydrology (1998) station and extrapolated to
ungauged river reaches
Fertiliser application rates Survey of British Fertiliser Fertiliser Manufacturers
Practice Association
However, as a result of the topographic variations, there is a high degree of variation in rainfall across the catchment, ranging from mean annual rainfall of 1892 mm in the uplands to 650 mm in the low-lying eastern part of the catchment (Institute of Hydrology, 1998). The land cover ranges from heather moorlands and rough grazing on the hills, improved pastures on the lower slopes to arable land in the lowlands. The main arable crops are barley, wheat, oats, oilseed rape and potatoes. Conifer plantations occupy about 16% of the land, and are located primarily on the hills in the south and west of the catchment. The geology of the Tweed catchment is predominantly sedimentary and metamorphosed sedimentary rocks (Ordovician and Silurian greywackes, shales and mudstones; old red sandstones, carboniferous shales, greywackes and limestones), with some granitic igneous intrusions and extrusive basic lava
rocks in the Cheviot Hills to the south of the catchment. Soils in the lowlands are well-drained brown earths, with podzols on the higher land and peats and gleys on hilltops and the southern slopes. The Tweed catchment is sparsely populated, with an average population density of 22 people km–2, less than a tenth of the UK average. Centres of
population are concentrated in a few small towns (Hawick, population 16 000; Galashiels, population 14 000, and Selkirk, population 6000). The Tweed catchment has been subject to significant agricultural change during 2001, in terms of livestock farming. The Scottish borders area has seen large-scale livestock culling in response to a serious outbreak of Foot and Mouth Disease. Over 100 000 animals were slaughtered on 117 farms within the Tweed catchment between March and September 2001, although many of the farms have now been restocked, indicating that the effects
of the Foot and Mouth crisis may be relatively short-lived. However, this recent outbreak has followed a series of profound threats to UK livestock farming, which have included BSE (Bovine Spongiform Encephalopathy or ‘Mad Cow Disease’), and, with meat export restrictions in place the long-term economic future of livestock farming systems in areas such as the Scottish Borders is uncertain. These economic drivers may have an important impact on land use change within the Tweed catchment, and need to be considered when designing land use change scenarios for the nitrogen modelling exercise.
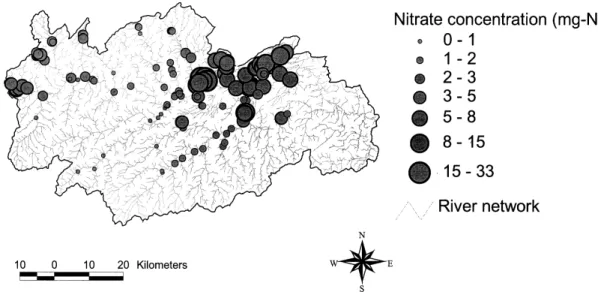
Nitrate accounts for approximately 97% of dissolved inorganic nitrogen (DIN) in the River Tweed, whereas nitrite and ammonium account for only 1.3% and 1.5% of DIN respectively (Jarvie et al., 1998). Organic forms of nitrogen can provide an important contribution to dissolved nitrogen fluxes, particularly in the upland regions of the Tweed catchment during the summer (up to 37% total nitrogen fluxes, Chapman et al., 2001). However, organic nitrogen has not been measured routinely by SEPA or under the LOIS programme and thus the data availability is sparse. Figure 1 shows the distribution of river water NO3-N concentrations across the Tweed catchment. The distribution of NO3-N shows highest concentrations in the eastern lowland parts of the catchment, which correspond with arable land use. However, elevated NO3-N concentrations are also found in some smaller tributaries in the west of the region, linked to sewage inputs and relatively low dilution capacity of small headwater streams.
Concern about nitrogen inputs to the River Tweed and its estuary has been growing over the last few years, with the
prospect of nitrate vulnerable zones being designated within the eastern part of the catchment. Attention has also focused on eutrophication within the Lindisfarne National Nature Reserve, an important European site. Linkages between eutrophication in the coastal waters around Lindisfarne and nitrate discharged from the Tweed have been suggested, and investigations are continuing.
Model setup
To model nitrogen in the River Tweed, using INCA, the main stem of the River Tweed was sub-divided into 23 reaches, of less than 10 km in length (Table 2). Reach boundaries were designed to coincide with key factors controlling flow and water quality, such as sub-catchment tributary inputs, effluent discharges, and the location of flow gauging stations and water quality monitoring sites (Fig. 2). The location of gauging stations and water quality monitoring sites at reach boundaries facilitates comparison of model simulations with observed flow and chemical concentration data at specified sites along the river.
The data used to set up the INCA model for the Tweed and for calibration are outlined in Tables 1 to 3. The data required for application of INCA include mean daily river flow, streamwater nitrate (as nitrogen, NO3-N) and ammonium (as nitrogen, NH4-N) concentrations, and loads from major land use and vegetation types within the catchment, (Whitehead et al., 1998a,b; Wade et al, 1999, 2001, 2002).
Fig. 1. Map of average nitrate concentrations across the Tweed catchment (1994 to 2000). Data supplied by the
Table 2. Reach structure used for INCA modelling of the River Tweed and data on Base Flow Index and effluent inputs
Reach Reach Name Length (m) Base Flow Effluent NO3-N Effluent NH4-N Effluent No. Index* concentration concentration discharge
(mg-N l–1) (mg-N/l) (m3s–1) 1 Source 7000 0.45 0 0 0 2 Fruid 7000 0.45 0 0 0 3 Kingledores 7000 0.5 0 0 0 4 Drummelzier 7500 0.5 0 0 0 5 Stobo 6000 0.5 0 0 0 6 Lyneford 4500 0.56 0 0 0 7 Scots’ Mill 8750 0.55 4.4 5.5 0.008 8 Traquair 8500 0.52 0 0 0 9 Juniper 6000 0.52 9.7 2.3 0.01 10 Peel 6500 0.52 0 0 0
11 Old Tweed Bridge 7000 0.52 0 0 0
12 Boleside 1500 0.51 5.1 2.4 0.095 13 Galafoot 2500 0.52 0 0 0 14 Lowood 2500 0.52 9.2 5.3 0.1 15 Leaderfoot 6500 0.52 8.6 3.8 0.01 16 Mertoun 8500 0.52 4.4 19.2 0.004 17 Rutherford 7000 0.52 15.3 13.1 0.004 18 Upper Floors 7500 0.52 0 0 0 19 Sprouston 6500 0.52 1 21.4 0.025 20 Homebank 8000 0.52 0 0 0 21 Coldstream 8000 0.52 0 0 0 22 St Cuthberts 4000 0.52 1.5 18.3 0.004 23 Norham 6000 0.52 0 0 0 *Gustard et al. (1987)
Fig. 2. Map of the Tweed catchment showing INCA reach boundaries, the sub-catchment area draining to each reach and the location
Table 3
. Sub-catchment areas draining to individual river reaches and the percentage of land use within each sub-catchment
Reach Name Ar ea % For est % Short vegetation % Short vegetation % Short vegetation % Arable % Urban No. km 2 (ungrazed) grazed, unfertilised fertilised (unimpr oved grassland) (impr oved grassland) 1 Source 21 24 0 76 0 0 0 2 Fruid 27 22 0 78 0 0 0 3 Kingledores 87 14 0 86 0 0 0 4 Drummelzier 38 38 0 11 89 0 0 5 Stobo 159 3 4 87 1 5 0 6 L yneford 15 0 0 93 0 7 0 7 Scots’ Mill 34 4 6 6 80 4 3 1 8 T raquair 87 21 3 62 9 5 0 9 Juniper 83 33 8 54 2 2 1 10 Peel 37 13 0 81 1 4 1 11 Old T weed Bridge 50 16 14 52 10 8 0 12 Boleside 47 1 15 0 85 0 0 0 13 Galafoot 4 0 0 75 0 25 0 14 Lowood 254 1 4 73 11 9 2 15 Leaderfoot 17 6 0 12 5 65 12 16 Mertoun 308 1 2 45 9 43 0 17 Rutherford 43 0 0 2 7 91 0 18 Upper Floors 27 0 0 0 7 93 0 19 Sprouston 1139 13 1 50 7 28 1 20 Homebank 159 0 0 4 12 84 0 21 Coldstream 17 9 0 0 0 4 96 0 22 St Cuthberts 9 0 0 0 0 10 0 0 23 Norham 658 3 2 38 15 42 0
WATER CHEMISTRY DATA
LOIS water quality sampling took place on a weekly basis at three sites on the main River Tweed from 1994 to 1996. Two of the LOIS sampling sites were located on the main stem of the Tweed and are used here (Boleside (Reach 12) and Norham (Reach 23)). SEPA sampling provides a good spatial distribution across the catchment, with river water samples collected typically on a monthly basis, except for the Tweed at Galafoot (Reach 13) where samples are collected on a weekly basis. SEPA also collects effluent chemistry and flow data, which provide another important input to the INCA model. For the LOIS programme, NO3-N concentrations were analysed using ion chromatography (Dionex DX1000 system) and NH4-N concentrations were determined by automated colorimetry (Leeks et al., 1997). For the SEPA water quality monitoring programme, both NO3-N and NH4-N concentrations were determined by ion chromatography. The LOIS chemical monitoring programme was subject to strict harmonisation and quality control measures (Leeks et al., 1997), and similarly, the SEPA analytical laboratories operate under UKAS accredited procedures. This meant that there was good agreement between the SEPA and LOIS datasets so that they could be collated and merged on the LOIS rivers database (Tindall and Moore, 1997). This provided a dataset for the Tweed catchment spanning seven years (1994 to 2000, inclusive), for a wide range of river and effluent monitoring sites. Of the SEPA river water quality monitoring sites across the Tweed catchment, twelve sites were located along the main stem of the Tweed. These twelve SEPA sites, in addition to the two LOIS water quality monitoring sites mentioned above (Fig. 2), provided the nitrate concentration data for INCA. Additionally, nine sewage treatment works discharged directly into the River Tweed between the source and Norham (Table 2).
DEPOSITION CHEMISTRY
Nitrogen inputs from atmospheric deposition were estimated using the MATADOR-N model (Model of Atmospheric Transport And Deposition Of Reacting Nitrogen, Rodgers, 1993; RGAR, 1997). This model provides an estimate of long-range transport and wet and dry deposition of oxidised and reduced N (NOx and NHy). Details of calculation methods are provided elsewhere (Whitehead et al., 1998a; Wade et al., 2001). Using MATADOR-N, the mean annual wet and dry deposition over the Tweed catchment was estimated as 3 kg ha–1yr–1 for both NO
3-N and NH4-N, based
on 1994 meteorological and emission data.
HYDROLOGICAL DATA
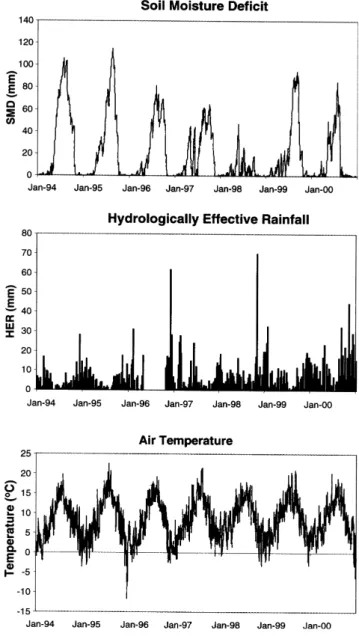
Five flow gauging stations on the main stem of the River Tweed (Fig. 2), supplied observed mean daily river flows. Hydrological input data are required to drive the hydrological component of the INCA model; these inputs are daily timeseries of hydrologically effective rainfall (HER, rainfall which penetrates the ground after allowing for evapotranspiration and interception losses), soil moisture deficit and air temperature (Fig. 3). The hydrological input data demonstrate a high degree of variability in the hydrological conditions experienced over the seven year study period. There were relatively low rainfall inputs and high summer soil moisture deficits during 1994 to 1996,
Fig. 3. MORECS data for the Tweed catchment: hydrological
timeseries input for INCA (Soil Moisture Deficit (SMD),
Hydrologically Effective Rainfall (HER) and air temperature from 1994 to 2000).
including a prolonged period with no HER during the summer of 1996, followed by high rainfall and relatively low soil moisture deficits during 1997 and 1998. The hydrological input data were supplied by the UK Meteorological Office, based on meteorological obser-vations and output from the MORECS soil moisture and evaporation accounting model (Meteorological Office, 1981). However, the high degree of spatial variability in rainfall across the Tweed catchment meant that, to calibrate the hydrological component of INCA, separate timeseries of HER were required for the upland and lowland areas of the catchment, rather than a single catchment average. The IHACRES model (Jakeman et al., 1990) was used to simulate the differences in HER in the upper (Reaches 1 to 12) and lower (Reaches 13 to 23) parts of the catchment, using the method described by Wade et al. (2001). IHACRES was calibrated using the MORECS-derived actual precipitation and air temperature data, together with the observed flow data at the flow gauging stations at Boleside (Reach 12) and Norham (Reach 23). IHACRES was calibrated using hydrological data from 1994 to 1997 and tested using the data from 1998 to 2000.
Velocity-flow information is required to estimate residence times of water within each river reach, and has been derived from tracer experiments conducted by SEPA. These data have been used to define the following flow-velocity relationship:
V = a Q b (1)
where V and Q are mean daily velocity and flow respectively; a and b are constants; for the Tweed, a = 0.02 and b=0.67.
In INCA, the baseflow index (Gustard et al., 1987) is used to partition the water moving between the soilwater and ground water reservoirs (see Wade et al., 2002). The baseflow index is a measure of the proportion of river runoff which is derived from stored sources and, for the River Tweed, the baseflow index ranges from 0.45 to 0.56 (Institute of Hydrology, 1998).
CATCHMENT LAND USE
Sub-catchment areas draining to each of the 23 river reaches were defined using the Institute of Hydrology Digital Terrain Model (IHDTM) within a Geographical Information System (GIS; ARC/INFO). Within each of the subcatchment areas, the land use characteristics were derived from the ITE Land Cover data (Fuller, 1993). The twenty five ITE land cover classes were then grouped into six categories, as defined by Whitehead et al. (1998a) : (i) forest, (ii) short vegetation
ungrazed, (iii) short vegetation grazed not fertilised (unimproved grassland), (iv) short vegetation grazed and fertilised (improved grassland), (v) arable, (vi) urban. Details of the sub-catchment areas draining to each of the Tweed river reaches and percentage cover of each land use type within each sub-catchment are shown in Table 3.
LAND MANAGEMENT AND PLANT/CROP GROWTH PERIODS
Typical fertiliser application rates to arable and improved grassland were obtained from the British Survey of Fertiliser Practice (Fertiliser Manufacturers’ Association, 1994), and estimated as 41 kg-N ha–1yr–1 for both NO
3-N and NH4-N
applications to improved grassland and 53 kg-N ha–1yr–1
NO3-N and NH4-N applications to arable land. The timings of applications were estimated to run between 1st March and 1st September, based on local farming knowledge (see Appendix). It was assumed that fertiliser input occurred evenly over the period of application and was predominantly applied in the form of ammonium nitrate. The main plant growing season was estimated to begin on 1st March and end on 31st October, with the exception of arable land, where the growing season was estimated to end at harvest time (7th September).
Model calibration
The availability of seven years of flow and NO3-N concentrations for the River Tweed meant that a split sample test could be undertaken, with calibration of the model during the first four years (1994 to 1997, inclusive), and model testing during the final three years (1998 to 2000). Model calibration was undertaken in three steps:
1. Hydrology. Simulation of nitrogen concentrations and loads in both catchment and stream components is dependent on water volumes and the routing of water through the soil, groundwater and river reaches. Therefore, it is important to simulate hydrology accurately. Parameters relating to the flow-velocity relationship were set according to experimental tracer observations. Constants defining the residence times of water in the soil and groundwater reservoirs were determined through calibration, until the simulated mean daily flows closely matched the observed mean daily flows for the 1994-1997 period (Fig. 4).
2. Initial conditions. Having set the fertiliser applications and plant growth periods according to local land management practices, the second step in the calibration
procedure involved adjusting initial NO3-N and NH4-N concentrations in the soil, groundwater and in-stream components, so that that the simulated flow and initial NO3-N concentrations in the first few days of the model run matched observed in-stream concentrations. River water NH4-N and NO2-N concentrations in the River Tweed were typically close to or below analytical detection limits, and therefore the INCA model of the Tweed was not calibrated to observed NH4-N and NO2-N data. By running the model to simulate a four-year period with a daily time step, the influence of initial conditions on model results was minimised.
3. Process rates. Parameters relating to soil nitrogen processes (rates of NH4-N immobilisation, NO3-N denitrification, NH4-N nitrification, NH4-N mineral-isation, and plant NH4-N and NO3-N uptake) and in-stream rates of denitrification and NH4-N nitrification were adjusted so that (i) the simulated annual fluxes for catchment processes and annual leaching loads were largely within expected ranges of published data for
relevant land use types (see Table 4), and (ii) the simulated daily NO3-N concentrations matched observed daily NO3-N values closely during 1994 –1997 (Fig. 5). The calibrated parameter values are shown in the Appendix. While these values cannot be compared directly with measured parameters (they have no direct physical process meaning), they serve as a basis for comparison with other INCA applications. Moreover, the loads derived for each process can be compared with measurements made in the field and provide a further means of calibrating the model in addition to matching the observed flows and streamwater nitrate and ammonium concentrations.
Fig. 4. INCA calibration results for hydrology: observed and
simulated river flows at Boleside (Reach 12) and Norham (Reach 23) for 1994 to 1997. Observed flows are shown in dark blue; simulated flows are shown in
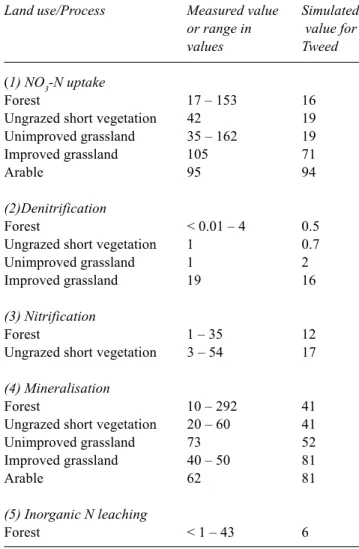
Table 4. Catchment process loads: comparing measured
values (kg-N ha–1yr–1) within the published literature (Wade et al., 2001a) with simulated mean annual fluxes (kg-N ha–1yr–1) during 1994 to 1997 in the Tweed catchment
Land use/Process Measured value Simulated
or range in value for
values Tweed
(1) NO3-N uptake
Forest 17 – 153 16
Ungrazed short vegetation 42 19
Unimproved grassland 35 – 162 19
Improved grassland 105 71
Arable 95 94
(2)Denitrification
Forest < 0.01 – 4 0.5
Ungrazed short vegetation 1 0.7
Unimproved grassland 1 2
Improved grassland 19 16
(3) Nitrification
Forest 1 – 35 12
Ungrazed short vegetation 3 – 54 17 (4) Mineralisation
Forest 10 – 292 41
Ungrazed short vegetation 20 – 60 41
Unimproved grassland 73 52
Improved grassland 40 – 50 81
Arable 62 81
(5) Inorganic N leaching
Forest < 1 – 43 6
(a) Reach 12 (Boleside)
(b) Reach 23 (Norham) 0 100 200 300 400 500 600 Ja n-94 A pr-9 4 Ju l-9 4 Oc t-94 Ja n-95 A pr-9 5 Ju l-9 5 Oc t-95 Ja n-96 A pr-9 6 Ju l-9 6 Oc t-96 Ja n-97 A pr-9 7 Ju l-9 7 Oc t-97 Ja n-98 R iv er fl o w (m 3/s ) 0 100 200 300 400 500 600 700 800 Ja n-94 A pr-9 4 Ju l-9 4 Oc t-94 Ja n-95 A pr-9 5 Ju l-9 5 Oc t-95 Ja n-96 A pr-9 6 Ju l-9 6 Oc t-96 Ja n-97 A pr-9 7 Ju l-9 7 Oc t-97 Ja n-98 R iv er fl o w (m 3/s )
COMPARING OBSERVED AND SIMULATED STREAMFLOW HYDROGRAPHS
Observed mean daily river flows at Boleside and Norham gauging stations from 1994 to 1997 and the corresponding simulated mean daily river flows, following calibration of the INCA model, are shown in Fig. 4. The INCA hydrological calibration reproduces the dynamics of flow in the Tweed, although it tends to underestimate peak flows, especially at the upper site, Boleside. The fit of the calibrated
model simulations to the observed flow data (1994 to 1997) was assessed quantitatively by calculating the coefficient of determination (CoefOD) for each of the flow gauging sites along the River Tweed (Table 5), where the CoefOD is defined as follows (Nash and Sutcliffe, 1970):
CoefOD = 1 – (Σ (Oi – Pi)2/ Σ (Oi – µo)2) (2)
For the ith value of data from 1 to n, O is the observed value, P is the predicted value and µo is the mean of the
observed values (Σi=1 Oi/n)
The coefficients of determination for flow in Reaches 12 to 21 are all approximately 0.5 and above, therefore indicating a successful model fit for the lower river reaches. However, at the two upper gauging stations, the coefficients of determination were less than zero. This is likely to result from reservoir storage and abstractions, which can have significant effects on the river flow at Kingledores, Lyneford and Scots Mill, but which have only a minor effect downstream of Boleside (Institute of Hydrology 1998). COMPARING OBSERVED AND SIMULATED NITRATE CONCENTRATIONS
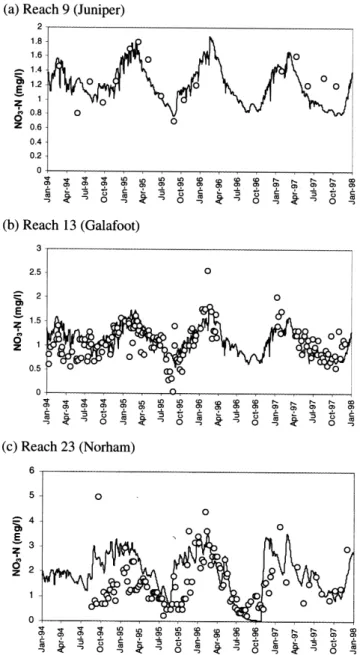
Examples of observed and simulated NO3-N concentrations are shown in Fig. 5 for sites in the upper catchment (Juniper, Reach 9), middle catchment (Galafoot, Reach 13) and lower catchment (Norham, Reach 23), and the coefficients of determination (CoefOD) for NO3-N at the water quality sampling sites along the River Tweed during the 1994 to 1997 calibration period are shown in Table 6. Figure 5 shows that dynamics of NO3-N variability are represented adequately by model simulations, especially in the middle
Table 5. Co-efficients of determination when comparing
observed and simulated river flows for the model calibration phase (1994–1997) and model testing (1998 to 2000). (Co-efficients of determination were calculated using the methods of Nash and Sutcliffe, 1970).
Reach No. 1994 to 1997 1998 to 2000 & Name (model calibration) (model testing)
3 Kingledores <0 <0 6 Lyneford <0 0.21 7 Scots Mill 0.36 0.51 12 Boleside 0.54 0.59 19 Sprouston 0.47 0.61 21 Norham 0.56 0.56
Fig. 5. INCA calibration results for nitrate: observed and simulated
NO3-N concentrations at Juniper (Reach 9), Galafoot (Reach 13) and Norham (Reach 23) for 1994 to 1997. Observed nitrate concentrations are shown as open circles; simulated nitrate concentrations are shown as a solid black line.
and upper catchment, and this is reflected in the CoefOD, which reach values of 0.35 at Juniper and 0.26 at Galafoot. However, at Norham, the coefficient of determination is less than zero for the calibration period. The main problem seems to be an over-estimation of NO3-N concentrations during the low-flow period from July to November 1994, and the subsequent period of wetting up and catchment nitrate delivery during the winter of 1994/1995. This may reflect the inability of INCA to model in-stream uptake of nitrogen by aquatic plants, which are an important feature of the tributaries in the lower agricultural parts of the basin. Indeed, the lower reaches of the main river channel are subject to prolific growth of aquatic plants under extreme summer baseflow conditions. The summer of 1995 was particularly dry, hot and sunny, with prolific filamentous algal growth recorded from Ettrick Foot (Reach 14) to the tidal limit (Tweed River Purification Board, 1996).
The CoefOD across the water quality monitoring sites (Table 6) show a wide variation in the success of the model fit during the 1994 to 1997 calibration phase, ranging from CoefODs of less than zero in Reaches 3, 14, 15, 18 and 23, to a CoefOD of 0.44 in Reach 11 (Old Tweed Bridge). The absence of any obvious patterns in CoefOD values along the river demonstrates that there is a high degree of local variation in the processes controlling nitrogen leaching and transport in the different catchment vegetation/soil systems and within individual river reaches.
Both observed and simulated NO3-N concentrations
demonstrate well-defined seasonality (Fig. 5), with lowest concentrations occurring during the summer and rising NO3-N concentration in the autumn and winter, as soils wet up and nitrogen is flushed from the catchment. Typically, peak NO3-N concentrations occur in late February/early March. The low summer concentrations reflect (a) lower flows and thus reduced delivery of diffuse-source nitrogen from the catchment, and (b) higher water residence times within the river reaches, promoting greater in-stream denitrification.
Model testing
The parameters derived by calibrating INCA for the River Tweed between 1994 and 1997 were then used with data collected between 1998 and to assess whether simulations would reproduce spatial variations in average flow and NO3 -N along the river reaches. Hydrological and -NO3-N dynamics were then tested by comparing simulated mean daily flows and NO3-N concentrations for 1998 to 2000, with corresponding observed flows and NO3-N concentrations using the model parameters derived from the calibration run.
SPATIAL VARIATIONS IN FLOW AND NITRATE CONCENTRATIONS
The simulated mean annual flow values and NO3-N concentrations (calculated from the 1998 to 2000 data) along the 23 reaches of the River Tweed compare well with observed mean annual values (Figs. 6 and 7). For NO3-N, mean annual observed concentrations are based on a restricted number of water quality samples, whereas the simulated mean annual NO3-N concentrations are based on daily simulated values. Therefore, to calculate a CoefOD to
Table 6. Co-efficients of determination when comparing
observed and simulated nitrate concentrations for the model calibration phase (1994–1997) and model testing (1998 to 2000). (Co-efficients of determination were calculated using the methods of Nash and Sutcliffe, 1970).
Reach Name 1994 to 1997 1998 to 2000
No. (model (model
calibration) testing)
3 Kingledores <0 <0
9 Juniper 0.35 0.19
11 Old Tweed Bridge 0.44 0.25
12 Boleside 0.08 N/D 13 Galafoot 0.26 0.25 14 Lowood <0 0.4 15 Leaderfoot <0 0.36 17 Rutherford 0.28 0.18 18 Upper Floors <0 <0 21 Coldstream 0.19 0.14 23 Norham <0 0.13
Fig. 6. Spatial variations in simulated and observed mean river
flows along the River Tweed during the model test period (1998 – 2000). Observed flow values are shown as open circles; simulated flow values are shown as black diamonds, joined by a solid black line. Reach numbers are shown on the graph.
compare observed and simulated mean annual NO3-N concentrations, the simulated means were calculated using only those values corresponding with the dates when observed NO3-N data were available. The CoefOD was 0.80 for flow and 0.78 for NO3-N, indicating a very good model fit for mean annual spatial variations in both flow and NO3 -N along the River Tweed.
The steepest downstream gradients in mean annual flow values correspond with the major tributary inputs: Reach 12, approximately 77 km from the source (the Ettrick Water), and Reach 19, approximately 120 km from the source (River Teviot). The steepest gradients in NO3-N concentrations occur in Reach 5, which represents a transition from upland vegetation to arable land use, resulting in relatively high NO3-N inputs. This reach also receives a relatively small tributary input from the Biggar Water, a headwater stream, receiving high effluent inputs from Biggar sewage treatment works (STW) (Robson et al., 1996). The slight reductions in mean annual NO3-N concentrations from Reaches 7 to 13, 16 to 18 and 21 to 22 may reflect hydrological dilution with water of lower NO3-N concentration and/or in-stream losses of nitrate by in-stream uptake processes along these river reaches. There is a small but steep increase in NO3-N concentrations in Reach 14, which receives tributary input from the Gala Water as well as urban runoff from the town of Galashiels and effluent from Galashiels STW. A major increase in NO3-N concentrations occurs in Reach 19, corresponding with input from the largest tributary, the River Teviot, which drains intensive arable land and areas with high livestock densities. A further steep increase in NO3-N concentrations occurs in Reach 23, which corresponds with the tributary input from the River Till draining an area of intensive arable land and high livestock densities.
FLOW AND NITRATE DYNAMICS
Timeseries of daily variations in simulated and observed flow concentration data for the model test period (1998 to 2000) are shown in Fig. 8, for two river reaches: Boleside (Reach 12) and Norham (Reach 23). The model shows a good fit in terms of flow dynamics but, like the 1994 to 1997 calibration period, INCA fails to predict the extreme high flows (some of which may be associated with snowmelt events in winter) and tends, slightly, to overpredict intermediate flows associated with the falling limb of storm hydrographs at both Boleside and Norham. However, CoefODs are relatively high for river flow at both sites for the model test period (0.59 and 0.56 at Boleside and Norham respectively, Table 5), demonstrating successful model fit. CoefODs at the upper sites (Kingledores and Lyneford) are significantly lower, with poorer model fit reflecting influence of reservoir storage.
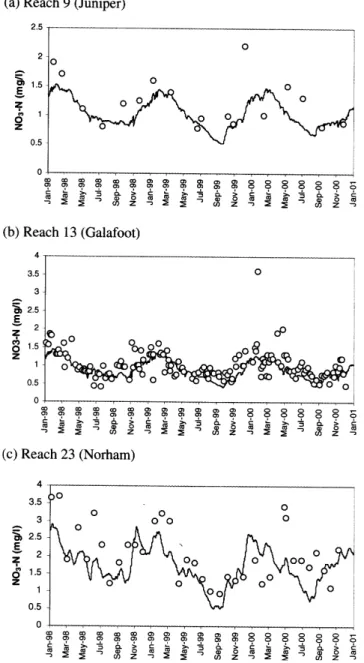
Timeseries of daily simulated and observed NO3-N concentrations for 1998 to 2000 are shown in Fig. 9, for three sites: Juniper (Reach 9), Galafoot (Reach 13) and Norham (Reach 23). The model represents the seasonal Fig. 7. Spatial variations in simulated and observed mean NO3-N
concentrations along the River Tweed during the model test period (1998 – 2000). Observed nitrate concentrations are shown as open circles; simulated nitrate concentrations are shown as black diamond joined by a solid black line. Reach numbers are shown on the graph.
Fig. 8. INCA test results for hydrology: observed and simulated river
flows at Boleside (Reach 12) and Norham (Reach 23) for 1998 to 2000. Observed flows are shown in dark blue; simulated flows are shown in red.
(a) Reach 12 (Boleside)
(b) Reach 23 (Norham) 0 50 100 150 200 250 300 350 400 450 500 Ja n-98 M ar-9 8 Ma y-98 Ju l-9 8 Sep -98 Nov -98 Ja n-99 M ar-9 9 Ma y-99 Ju l-9 9 Sep -99 Nov -99 Ja n-00 M ar-0 0 Ma y-00 Ju l-0 0 Sep -00 Nov -00 Ja n-01 R iv er fl o w (m 3/s ) 0 200 400 600 800 1000 1200 Ja n-98 M ar-9 8 Ma y-98 Ju l-9 8 Sep -98 Nov -98 Ja n-99 M ar-9 9 Ma y-99 Ju l-9 9 Sep -99 Nov -99 Ja n-00 M ar-0 0 Ma y-00 Ju l-0 0 Sep -00 Nov -00 Ja n-01 R iv er fl o w (m 3/s )
Fig. 9. INCA test results for nitrate: observed and simulated NO3-N concentrations at Juniper (Reach 9), Galafoot (Reach 13) and Norham (Reach 23) for 1998 to 2000. Observed nitrate concentrations are shown as open circles; simulated nitrate concentrations are shown as a solid black line.
dynamics in nitrate concentrations at all three sites, with CoefOD values of 0.19 (Juniper), 0.25 (Galafoot) and 0.13 (Norham) (Table 6). Indeed, at Norham, nitrate model fit during 1998 to 2000 is significantly better than during the calibration phase of 1994 to 1997. During the 1998 to 2000 model test period, INCA tends to underestimate winter peaks in nitrate concentrations, linked to high flow events, especially at Norham. The model test period of 1998 to 2000 was characterised by higher HER than during the calibration phase, especially during the summer months. Higher
summer HER has an important control on daily nitrate leaching dynamics, and this produces a better model fit during the summer lower flows at Norham during 1998 to 2000. CoefOD values demonstrate large variation between river reaches and also between model test and calibration periods (Table 6). These results highlight issues of temporal as well as spatial variations in the processes controlling nitrate leaching and transport in neighbouring sub-catchments and river reaches.
Using model simulations to assess
spatial and temporal variability in
nitrate sources and loads
Following successful calibration and testing of the Tweed INCA model, simulations were used to investigate sources of nitrate loads (both point and diffuse source leaching loads) to the river and their variability through time. Firstly model simulations were used to examine the relative contribution of leaching loads from different land uses and effluent discharge to the annual NO3-N load during 1995 along all 23 river reaches. Secondly, seasonal variability in sources was assessed by examining the relative contributions of land-use types and effluents to monthly NO3-N loads within Reach 23 (Norham). Thirdly, daily dynamics in NO3-N leaching loads were examined for two contrasting land-use types, arable and unfertilised grazing land, which represent the greatest contributors to NO3-N leaching loads in the Tweed catchment. The uncertainty in the calibrated parameters means that any simulation results must remain tentative. However, the results are indicative of likely changes in nitrogen dynamics in response to environmental changes.
ATTRIBUTING IN-STREAM NITRATE LOADS ALONG THE RIVER TWEED TO DIFFERENT SOURCES The simulated relative contributions of nitrate leaching from different land uses to the annual nitrate load of the Tweed from the source to the tidal limit are shown for one example year (1995) in Fig. 10. The urban areas and point source contributions are grouped into one category as the greatest contributions from point sources tend to be found in urban areas, and both sources provide only a very small contribution to total nitrate load in the Tweed catchment. The model simulation results indicate an overwhelming dominance of unimproved grassland to the annual nitrate load in the upper and middle reaches of the Tweed. This reflects the rough livestock grazing within the upper and middle parts of the catchment. Moving downstream towards the lowland river reaches, arable contributions to NO3-N
Fig. 10. Simulated relative contributions of different sources to the nitrate load along the River Tweed during 1995.
load increase (as the absolute NO3-N loads increase). Below Reach 15 (Leaderfoot), there is a large increase in the proportion of arable-derived NO3-N, reaching a maximum of approximately 60% of annual NO3-N load at Norham (Reach 23). The Leader tributary which flows into the Tweed in Reach 15, is a predominantly livestock area, but importantly there is a very large broiler chicken farm in the catchment, and nitrate concentrations in the Turfford Burn tributary have increased rapidly with the expansion of this sector. In the reaches below Lyneford (Reach 6), improved grassland contributes a small but near-constant proportion of NO3-N load (around 15%). Ungrazed land contributes no more than 5% of total annual load at any point along the river. While forests contribute over 20% of the annual NO3-N load in the upper two reaches, this contribution tails off to under 5% in the lower reaches of the Tweed. Urban areas and point sources provide the lowest contribution to the annual NO3-N load at any point on the river, owing to the rural nature of the catchment and the low human population. Urban and point source inputs are greatest in the middle reaches, reflecting nitrate inputs from the towns of Selkirk, Galashiels, St Boswells and Kelso.
SIMULATED SEASONAL VARIABILITY IN CONTRIBUTING NITRATE SOURCES
The simulated contributions of the 6 land use categories to the monthly NO3-N loads for Juniper (Reach 9), Galafoot (Reach 13) and Norham (Reach 23) are shown in Fig. 11. Throughout 1995, monthly loads of NO3-N in the upper and middle reaches (Juniper and Galafoot) were dominated by leaching from unimproved grazing land, accounting for up to approximately 65% of monthly NO3-N loads. In the lower river at Norham, monthly loads of NO3-N were dominated by arable leaching which accounted for between
Fig. 11. Simulated relative contributions of different sources to the
monthly nitrate load in the River Tweed at Norham (Reach 23) during 1995. 0% 20% 40% 60% 80% 100% 1 2 3 4 5 6 7 8 9 10 11 12 13 14 15 16 17 18 19 20 21 22 23 Reach number urban&point Arable improved pasture unimproved pasture ungrazed Forest
(a) Reach 9 (Juniper)
0% 20% 40% 60% 80% 100%
jan feb mar apr may jun jul aug sep oct nov dec
(b) Reach 13 (Galafoot) 0% 20% 40% 60% 80% 100%
jan feb mar apr may jun jul aug sep oct nov dec
(c) Reach 23 (Norham) 0% 20% 40% 60% 80% 100%
jan feb mar apr may jun jul aug sep oct nov dec
forest ungrazed unimproved pasture improved pature arable urban & point
50 and 70% of monthly NO3-N loads. At all three sites, there is a seasonal pattern in the proportion of urban and point sources; this reaches a maximum in August, reflecting lower river flows and reduced point source dilution during the summer months. Urban areas and point sources provide the greatest contributions to monthly NO3-N loads in the mid-catchment at Galafoot (up to 10% NO3-N load in August), reflecting urban and sewage inputs from the town of Galashiels. The percentage of NO3-N load from arable and improved grassland increases during the summer at all three sites, whereas unimproved grassland contributes a higher percentage of monthly NO3-N loads during the winter. This may reflect greater precipitation inputs and delivery of diffuse source nitrate inputs from the more upland areas during the winter. The proportion of nitrate from forest and ungrazed land remains largely constant throughout the year at all three sites, with a combined contribution of approximately 10 % at Juniper and Galafoot, but only 5% at Norham.
SIMULATED DYNAMICS IN DAILY NITRATE LEACHING LOAD
Daily nitrate leaching loads, simulated for the subcatchment draining into Reach 13 (Galafoot) are shown in Fig. 12, for the two land-use sources which contribute the largest proportion of nitrate leaching loads within the River Tweed: unimproved grassland and arable. These timeseries demonstrate a high variability in daily simulated NO3-N leaching loads for both arable and unimproved grassland, and the timing of peak NO3-N inputs resembles the daily HER timeseries closely (Fig. 3). NO3-N leaching from both unimproved grassland and arable ceases during the summer/ early autumn period of 1996, because of a lack of hydrologically effective rainfall during this time. Although
nitrogen fertilisers are applied to the arable land from the beginning of March to the end of August, this period corresponds with a time of generally lower simulated NO3-N leaching loads from arable land. In addition to lower rainfall and thus lower runoff generation, rates of biological activity and uptake of N are also highest during the summer, resulting in lower NO3-N export.
Simulating environmental change
within the Tweed catchment and its
implications for nitrate leaching and
river transport
The calibrated INCA model of the River Tweed was used to examine the impact of environmental change on nitrate concentrations and loads in the Tweed catchment. Environmental change within the Tweed catchment was modelled in terms of two factors: land use change and changing atmospheric nitrogen deposition.
Five land use scenarios were examined, related to changes in the proportions of different land-use types and fertiliser inputs:
(i) a 20% reduction in all fertiliser applications;
(ii) all arable land converted to fertilised grassland, receiving no more than 150 kg-N ha–1yr–1;
(iii) all arable land converted to unfertilised ungrazed land; (iv) all grazed land converted to ungrazed land;
(v) all grazed fertilised land converted to arable; all grazed non-fertilised land converted to ungrazed land; and all existing ungrazed land converted to forestry.
Fig. 12. Simulated daily nitrate leaching loads from unimproved pasture and arable to Reach 13 (Galafoot) 1994 to 2000.
0 0.05 0.1 0.15 0.2 0.25 0.3 1- Jan-94 1-A pr -9 4 1-Ju l-94 1-O ct-94 1- Jan-95 1-A pr -9 5 1-Ju l-95 1-O ct-95 1- Jan-96 1-A pr -9 6 1-Ju l-96 1-O ct-96 1- Jan-97 1-A pr -9 7 1-Ju l-97 1-O ct-97 1- Jan-98 1-A pr -9 8 1-Ju l-98 1-O ct-98 1- Jan-99 1-A pr -9 9 1-Ju l-99 1-O ct-99 1- Jan-00 1-A pr -0 0 1-Ju l-00 1-O ct-00 1- Jan-01 NO 3 -N le ach in g ( kg -N /h a/ d ay )
Scenarios (i) to (iii) correspond with Nitrate Sensitive Areas recommendations (Johnes, 1996; Wade et al., 2001). Scenarios (iv) and (v) are linked to worst-case scenarios of land use change in the Tweed catchment linked to a collapse in livestock farming within the catchment (see the discussion of agricultural change in the earlier description of the Tweed catchment). In scenario (iv), all grassland is converted to ungrazed land. Scenario (v) represents a major reorganisation of land use within the Tweed catchment, with an expansion of arable into the more lowland of the existing livestock areas, an expansion of forestry into existing ungrazed areas, and existing unimproved grazing land being converted to ungrazed land.
Changing atmospheric deposition scenarios were modelled as follows:
(vi) 50 % reduction in total N deposition; (vii) 50 % increase in total N deposition; (viii) 100 % increase in total N deposition; (ix) 200 % increase total N deposition.
Whilst current European policy encourages reductions in nitrogen emissions, largely though the use of catalytic converters on vehicle exhausts, it is unclear how nitrogen emissions will change in the future. A potentially important factor in changing nitrogen deposition within the Tweed catchment is a move towards more intensive livestock production and poultry farming and resultant increases in atmospheric ammonia emissions from these sources. Therefore, a range of scenarios was considered to cover possible extremes. The INCA Tweed model was run for each of the nine scenarios for the full modelling period (1994 to 2000), by changing the relevant input parameters. The NO3-N timeseries output for each scenario was then compared with the output for the calibrated parameter set (the model ‘base run’), for two sites characteristic of the upper and lower river reaches (Juniper and Norham). A summary, which compares mean daily NO3-N concen-trations for the model base run and for each scenario is provided in Table 7. Scenario results are provided in terms of mean daily nitrate concentrations for (a) the full long-term data set (1994 – 2000), (b) summer (June to August), and (c) winter (November to February).
LAND-USE CHANGE SCENARIOS
Scenarios (i), (ii) and (iii), which are linked to reduced fertiliser inputs and a reduction in the proportion of arable
land had the greatest impact on reducing in-stream NO3-N concentrations in the lower river reaches, which drain the lowland agricultural parts of the catchment. Scenario (iii) produces the greatest percentage reductions in NO3-N concentrations, with > 50 % reduction in the concentration of NO3-N at Norham throughout the year. Scenarios (i) and (ii) also result in a greater percentage reduction in NO3-N concentrations at Norham during the winter, compared with the summer. This relates to reductions in the availability of fertiliser-derived N for delivery from the catchment to the river during the main period of nitrate flux transport under high flow conditions during the winter months.
Major agricultural re-organisation, linked to a dramatic reduction of livestock farming within the catchment is modelled in scenarios (iv) and (v). The conversion of all grazing land (both improved and unimproved grassland) to ungrazed land produces an average reduction of approximately 20% in simulated in-stream mean daily NO3-N concentrations in the upper catchment, compared with a 15% reduction in the lower river reaches. This higher percentage loss in the upper catchment reflects the dominance of grazing land contributions to NO3-N leaching loads (approximately 70% at Reach 9 – Juniper, compared with approximately 35% at Norham). In scenario (v), the loss of grazing land is buffered to some extent by the conversion of improved grassland to arable land. This results in a much smaller percentage reduction in river NO3-N concentrations in the lower catchment (only 1%), compared with a 6% reduction in NO3-N concentrations in the upper catchment.
ATMOSPHERIC DEPOSITION SCENARIOS
Scenarios of changing atmospheric total N inputs all have the greatest impact in the upper catchment compared with the lower catchment. This is because atmospheric nitrogen sources contribute a greater proportion of total N inputs in the upper catchment, since most upland land uses do not involve intensive application of fertilisers.
Each 50% change in atmospheric total N inputs changes long-term mean daily in-stream NO3-N concentrations by approximately 3.2% in the lower catchment, but 4% in the upper catchment. The percentage change in in-stream NO3-N concentrations is greater in winter than in summer. For example, there is a 5% change in winter mean daily NO3-N concentrations per 50% change in total N deposition in the upper catchment, compared with a corresponding 3.2% change in mean daily summer NO3-N concentrations. A 200% increase in total N deposition is predicted to result in a 21% increase in winter mean daily NO3-N concen-trations in the upper catchment.
Table 7
. Summary ef
fects of dif
ferent land use change and atmospheric deposition scenarios on in-stream nitrate concentrations, in com
parison with the model base run
Scenario R EACH 9 (J UNIPER )R EACH 23 (N ORHAM ) no. calibrated scenario % change calibrated scenario % change (base run) (base run) 1 20% reduction in NO 3 -N and NH 4 -N fertiliser loads long-term 1.14 1.10 -3.4 1.85 1.64 -1 1.6 summer 1.05 1.02 -3.5 1.62 1.47 -9.6 winter 1.33 1.29 -3.5 2.54 2.21 -12.9 2
All arable converted to improved grazing land
long-term 1.14 1.10 -3.1 1.85 1.66 -10.5 summer 1.05 1.02 -3.2 1.62 1.49 -8.3 winter 1.33 1.28 -3.6 2.54 2.19 -13.7 3
All arable converted to ungrazed, unfertilised land
long-term 1.14 0.97 -14.2 1.85 0.79 -57.3 summer 1.05 0.90 -14.8 1.62 0.71 -56.6 winter 1.33 1.14 -14.1 2.54 1.07 -58.0 4
All grazing land (improved and unimproved)
long-term 1.14 0.91 -19.5 1.85 1.57 -15.2
converted to ungrazed land
summer 1.05 0.86 -18.1 1.62 1.38 -15.2 winter 1.33 1.05 -21.1 2.54 2.15 -15.3 5
Existing ungrazed land converted to forestry;
long-term 1.14 1.07 -5.7 1.85 1.83 -1.1
Existing unimproved grazing land converted to
summer 1.05 1.01 -3.9 1.62 1.60 -1.2 ungrazed land; winter 1.33 1.23 -7.6 2.54 2.52 -1.0 winter 1.33 1.23 -7.6 2.54 2.52 -1.0 6
Existing improved grazing land converted to arable
long-term 1.14 1.09 -3.9 1.85 1.79 -3.3
50 % reduction in atmospheric N deposition
winter 1.33 1.23 -7.6 2.54 2.52 -1.0 summer 1.05 1.02 -3.1 1.62 1.58 -2.4 winter 1.33 1.27 -4.9 2.54 2.44 -3.8 7
50 % increase in atmospheric N deposition
long-term 1.14 1.18 4.0 1.85 1.91 3.2 summer 1.05 1.09 3.2 1.62 1.66 2.4 winter 1.33 1.40 5.0 2.54 2.64 3.8 8
100% increase in atmospheric N deposition
long-term 1.14 1.23 8.0 1.85 1.98 6.5 summer 1.05 1.12 6.3 1.62 1.70 4.8 winter 1.33 1.46 10.1 2.54 2.73 7.7 9
200% increase in atmospheric N deposition
long-term 1.14 1.32 16.5 1.85 2.10 13.2 summer 1.05 1.19 12.8 1.62 1.78 9.8 winter 1.33 1.61 20.8 2.54 2.93 15.4
Discussion
In this study, INCA has been applied to a large-scale spatially heterogeneous catchment over a period of seven years, during which there has been a high degree of variability in climatic conditions and river flows. Model calibration was undertaken for the first four years of the data record (1994 to 1997), which incorporated periods of summer drought, the most notable of which occurred in the summer of 1995, resulting in extremely low summer/autumn baseflow conditions. In contrast, the model test period (1998 to 2000) included periods of high summer HER, especially during 1998. The ability of INCA to reproduce broad-scale seasonal dynamics in flow and nitrate concentrations at key sites during these changing river flow conditions suggests that the predominant processes controlling river water nitrate concentrations have been represented successfully within the model. However, the variability in model fit along the river reaches and through time highlights considerable local variability in processes controlling the leaching and transport of nitrogen along the catchment-river continuum.
Extreme summer baseflow conditions during the model calibration phase had important implications for the lowermost reach of the river Tweed (Norham). Observed nitrate concentrations during the summer and autumn periods of 1994 and 1995 (Fig. 5) were significantly lower than simulated baseflow nitrate concentrations at Norham, suggesting that in-stream processes removing nitrate were operating. Long water residence times and a wide, shallow channel cross-section in the lower reaches of the River Tweed promote in-stream plant growth during these extreme summer baseflow conditions in both the main stem and lowland agricultural tributaries. In 1995, low river flows, combined with high river water temperatures (20–25oC) and
sunlight resulted in prolific filamentous green algal growths from Ettrick Foot to the tidal limit. The lower reaches of Whiteadder, Teviot and Leet were also affected. Intense rates of plant growth resulted in maximum values of pH of 10.00– 10.35, with dissolved oxygen % saturation up to 254% (Tweed River Purification Board, 1996). Rapid plant growth and biomass production can result in rapid uptake of nitrate from river water (Svendsen and Kronvang, 1993, Saunders and Kalff, 2001), and this may play a key role in controlling the downstream nitrate flux and concentration reductions observed in the Tweed in the summer-autumn periods during 1994 to 1996. The model fit at Norham was much better during the wetter summers of the model test period (1998 to 2000), when observed nitrate concentrations were significantly higher (Fig. 9). This may reflect higher river flows or poorer growth of aquatic plants and thus reduced in-stream nitrate uptake by plants. These results suggest that,
for applications of INCA to slow-flowing lowland eutrophic rivers, the possibility of incorporating a plant uptake component needs to be investigated. Plant uptake parameters will be variable through space and time, and linked to factors such as differences in reach morphology, water residence times and solar radiation.
While seasonal variability in nitrate concentrations was well represented by model simulations, more short-term variations, linked to individual predicted storm events were less accurate. Extremely high flows and associated intermittent high nitrate concentrations were often poorly simulated. This may be a result of the heterogeneity of response of source mobilisation to individual storm events, linked to differences in nitrate source availability in both time and space and delivery pathways.
However, INCA was successful in simulating downstream average spatial variations in flow and nitrate concentrations, including the effects of flow and nitrate inputs from major tributaries. The model simulations provide valuable clues about key sources of nitrogen within the catchment and their variability in time and space. The simulations demonstrated the importance of leaching from arable land to the loads of nitrate draining from the Tweed catchment (up to approximately 70% of monthly nitrate loads in 1995). Significant increases in river water nitrate fluxes correspond to the transition from the upland to the lowland parts of the catchment, linked to a shift in land use from predominantly unimproved grassland to arable. Highest leaching loads for all vegetation types occurred during the winter high flows, and leaching loads are closely linked to the timeseries of HER and thus runoff generation, with lower summer leaching loads linked to lower rates of runoff generation and biological uptake of N. Analysis of seasonal patterns in simulated nitrate leaching loads suggests that the percentage contributions of agriculture and improved grassland to in-stream nitrate loads increase during the summer, and these are linked to higher contributions from unimproved grassland during the winter. Unimproved grassland is the predominant land-use type in the upper catchment and increases in nitrate leaching from unimproved grassland relative to agriculture and improved grassland may reflect greater runoff generation and nitrate delivery from the upper catchment during the winter months.
Simulated model responses to environmental change scenarios suggest possible catchment responses to perturbations in land use or atmospheric nitrogen inputs. However, caution must be exercised in evaluating model predictions, owing to the complex nature of the catchment system and the multitude of possible feedback processes in the real world, not included within the INCA model. During calibration, the parameters are fixed, which implies that the
relationships between soil nitrogen transformation processes are fixed. As nitrogen processes respond to environmental change, it would be expected that the relationships would change and, therefore, the simulation results of future scenarios must remain tentative. Potential process responses to environmental changes require thorough investigation through field and laboratory studies. Land use scenarios linked to implementation of Nitrate Sensitive Areas recommendations have greatest impact in the lower river reaches; a 20% reduction in fertiliser inputs is predicted to result in average reductions of 12% in-stream nitrate concentration at Norham. However, by allowing all arable land to revert to its semi-natural state (ungrazed, unfertilised grassland), INCA predicts an average nitrate reduction at Norham of 57%. Land use changes associated with dramatic reductions in livestock, have greatest impact on nitrate concentrations in the upper catchment, which is dominated by livestock farming. By allowing all grazing land to revert to its semi-natural state (ungrazed, unfertilised grassland), INCA predicts an average reduction in nitrate concentrations of 20% at Juniper (Reach 9). Atmospheric deposition scenarios similarly have greatest impact in the upper Tweed catchment, with an average 4% change in river-water nitrate concentrations for every 50% change in atmospheric nitrogen deposition. However, the impact of these scenarios of increased atmospheric deposition on the eutrophic status of the River Tweed is likely to be small. The greatest NO3-N contributions in the upper reaches are derived from diffuse-source run-off from unimproved grasssland which occurs predominantly during the winter, rather than during the summer growing season for macrophytes and filamentous green algae. However, these diffuse source increases could potentially exacerbate spring epilithic diatom growths. During the early 1980s, prolific benthic diatom growths were observed in the middle reaches of the Tweed during the spring. These diatom blooms have been attributed to greater diffuse source nutrient inputs, linked to changes in land use in the upper and middle catchment and, in particular, a shift towards winter sown cereal production and increased fertiliser usage (Clayton, 1997). Predicted changes in nitrate concentrations linked to environmental change are not uniform throughout the year. Changes in land use and atmospheric inputs tend to have greatest impact on winter nitrate concentrations, since winter runoff generation provides the main route of delivery of nitrate from the catchment to the river. This means that measures to reduce in-stream nitrate have greatest proportional effect during the winter. However, greatest risk of eutrophication occurs under summer low flows. Therefore, the scale of differences in response to environmental perturbation between winter and summer needs to be taken into account when assessing
potential impacts of change. Predicted increases in nutrient inputs in response to environmental change may be buffered to some extent by enhanced aquatic plant growth and in-stream uptake, especially if nitrogen increases are accompanied by enhanced rates of phosphorus leaching (Neal, 2002).
Concluding remarks
INCA has been applied to the Tweed for modelling flow and seasonal nitrate dynamics over a seven-year period. The lower river reaches are susceptible to overestimation of summer/early autumn baseflow nitrate concentrations during dry years and this may be linked to aquatic plant uptake effects. Consideration should now be given to incorporating a spatially and temporally variable in-stream plant uptake module for application of INCA to lowland eutrophic rivers. Short-term variability in flow and nitrate concentrations during winter storm events tends to be less accurately simulated, which may be linked to complexity of short-term runoff and source generation processes. However, INCA is successful in modelling the seasonal dynamics in nitrate concentrations and broad-scale spatial variability in nitrate concentrations from the upland region to the lowlands under a wide range of hydroclimatic conditions. The model now provides a valuable tool by which to assess contributions of different catchment sources of nitrogen in the Tweed and possible effects of future changes in catchment land use and management. The application and further development of the model in collaboration with catchment managers and policy makers is strongly encouraged.
References
Ball, S., 1993. Nitrate and the law. In: Nitrate:Processes, Patterns
and Management. T.P. Burt, A.L. Heathwaite and S.T. Trudgill
(Eds.), Wiley, Chichester, UK. 386–400.
Chapman, P.J., Edwards, A.C. and Cresser, M.S.,2001. The nitrogen composition of streams in upland Scotland: some regional and seasonal differences. Sci. Total Envir., 265, 65– 83.
Clayton, J.W., 1997. The biology of the River Tweed. Sci. Total
Envir., 194/195,155–162.
Cosby, B.J., Wright, R.F., Hornberger, G.M. and Galloway, J.N., 1985a. Modelling the effects of acid deposition: assessment of a lumped parameter model of soil water and stream water chemistry. Water Resour. Res., 21, 51–63.
Cosby, B.J., Wright, R.F., Hornberger, G.M. and Galloway, G.N., 1985b. Modelling the effects of acid deposition: assessment of long-term water quality responses in a small forested cathment.
Water Resour. Res., 21, 1591–1601.
Cosby, B.J., Ferrier, R.C., Jenkins, A., Emmett, B., Tietama, A. and Wright, R.F., 1997. Modelling the ecosystem effects of N deposition at the catchment scale: model of ecosystem retention and loss of inorganic nitrogen (MERLIN). Hydrol. Earth. Syst.