HAL Id: insu-03132110
https://hal-insu.archives-ouvertes.fr/insu-03132110
Submitted on 5 Feb 2021
HAL is a multi-disciplinary open access
archive for the deposit and dissemination of
sci-entific research documents, whether they are
pub-lished or not. The documents may come from
teaching and research institutions in France or
abroad, or from public or private research centers.
L’archive ouverte pluridisciplinaire HAL, est
destinée au dépôt et à la diffusion de documents
scientifiques de niveau recherche, publiés ou non,
émanant des établissements d’enseignement et de
recherche français ou étrangers, des laboratoires
publics ou privés.
Vertical structure of the midlatitude temperature from
stratosphere to mesopause (30-105 km)
C. She, J. Yu, David Krueger, Raymond Roble, Philippe Keckhut, Alain
Hauchecorne, Marie-Lise Chanin
To cite this version:
C. She, J. Yu, David Krueger, Raymond Roble, Philippe Keckhut, et al.. Vertical structure of the
midlatitude temperature from stratosphere to mesopause (30-105 km). Geophysical Research Letters,
American Geophysical Union, 1995, 22 (4), pp.377-380. �10.1029/95GL00010�. �insu-03132110�
Vertical structure of the midlatitude temperature from
stratosphere to mesopause
(30 - 105 km)
C. Y. She, J. R. Yu and David A. Krueger
Physics Department, Colorado State University, Fort Collins, CO 80523, USA
Raymond
Roble
National Center for Atmospheric Research, Boulder, CO 80307, USA
Philippe
Keckhut,
Alain Hauch•ome
and
Marie-Lise
Chanin
Service d'Aeronomie du CNRS, Verrieres le Buisson Cedex, 91371, France
Abstract Data sets from Rayleigh lidar (1979-93) at the lidar measurements coupled with its ability to better probe
Observatory
of Haute-Provence
(44øN,
6øE) and at the mesopause
region
has led to the discovery
of un-
Biscarrosse (44øN, 1øW) of southern France, and from narrowband Na lidar (1991-4) at Fort Collins, Colorado
(4IøN, 105øW) are used to deduce the vertical temperature
structure of the midlatitude middle atmosphere from 30 -
105 km. Nighfly averaged temperatures measured across the
Atlantic at comparable latitudes between 81 and 90 km
showed seasonal variations tracking one another. Harmonic
analyses of the measured profiles at these sites have been
compared
to the reference atmosphere,
CIRA 1986.
Considerable differences are noted in the annual mean
temperatures in the mesopause region. Two temperature
minima at 86 and 99 km are observed, suggesting heating
expectedly stable fine structure in the vertical temperature profiles at FC [She et al., 1993], which is believed to be representative of midlatitude climatology. In this paper, we first compare the nighfly averaged temperatures between 81 and 90 km in altitudes measured by different lidar techniques across the Atlantic. We then present harmonic analyses of the vertical temperature profiles between 83 and 103 km over Colorado (4IøN, 105øW), and between 30 and 87 km over Southern France (44øN, 1øW and 6øE) to elucidate the
observed thermal structure of the mid-latitude middle
atmosphere from 30 - 105 km, in comparison to those dexlucexl from the reference middle atmosphere, CIRA 1986.
and cooling mechanisms not previously incorporated into
the
reference
atmosphere.
Using
the
new
3D TIME-GCM
of Nightly averaged Seasonal variations
Robie and Ridley which includes both dynamical and
chemical
processes,
we account
for this
anomalous
behavior
The nightly
temperature
profile derived
from French
by model
simulation
for the first
time.
Except
the existence
Rayleigh
lidar (30 to 90 km) is an average
of at least
three
of strong
semi-annual
oscillations,
the observed
annual
and hours of observation;
the resolution is 3 km with
semi-annual temperature variations are compatible with uncertainty of ~ 1 K, 3 K and < 10 K for altitudes between
CIRA 1986. Observed annual temperature and solar flux 30 and 70 km, at 80 km and near 90 km. The nightly
forcing
are out-of-phase
between
65 and
99 km, reflecting
a temperature
profile derived from the Colorado State
dynamics dominated atmosphere at these altitudes. narrowband Na lidar (81 to 105 km) is an average of at least
four hours of observation each night; the resolution is 1.5
Introduction km with uncertainty of ~ 1 K, 3.5 K and 5 K for altitudes
respectively at the peak, bottom and top of the Na layer.
Over
the
past
decade,
ground-based
lidar
sounding
of The mid-latitude
nighfly
averaged
temperatures
(1991
to
atmospheric
temperatures
has
gained
acceptance.
Fourteen
1993)
measured
by different
lidar
techniques
across
the
years
of quality
temperature
data
with
~100
nights
per
year Atlantic
overlap
between
81 and 90 km. Although
by Rayleigh
lidar
at the
Observatory
of Haute-Provence
differences
in latitudes
and
planetary
wave
perturbations
(OHP)
and
Biscarrosse
(BIS),
southern
France
[Hauchecome
exist,
the
general
trend
in seasonal
temperature
variations
at
et al., 1991],
and three
years
of quality
data,
with ~ 50 these
midlatitude
sites
is expected
to be the
same.
nights
per
year
by
narrowband
Na
fluorescence
lidar
at
Fort
Figure
1 compares
the
measured
nightly
fiveraged
Collins
(FC), Colorado
[Yu and
She,
1995]
have
already
temperatures
at 85 km for the
Colorado
site
at FC and
two
been
collected.
Using
these
data
sets
the
climatology
of the sites
in Southern
France
at OHP
and
at B IS for the
three-
midlatitude
middle
atmosphere
may
be investigated.
year
period
(1991
to 1993)
that
data
exist
in all three
sites.
The much
higher
spatial
resolution
obtainable
from The
seasonal
temperature
variations
between
cool
summer
and warm winter are seen to track one another within the
Copyright 1995 by the American Geophysical Union.
Paper number 95GL00010
0094-8534/95/95GL-00010503.00
nighfly variability of + 8 K at all sites, as if they were measured from collocated lidars. Similar agreements hold for other altitudes between 82 and 89 km. This suggests that lidar measurements at sites with different longitude but the same (or even comparable) latitude may be combined to compare with a reference atmosphere or model simulations.
378 o 240 .... ß 220 2OO 180 160 OHP
BIS''
I,,, I,,, I' ,,•
i
i
o
csu
...
i ...
•o...i
...
• ...
4-
O : 140 0 200 400 600 800 1000 1200 day#
Fig. 1.
Measured
nightly
averaged
temperatures
at 85
km at FC, OHP and BIS from 1991 to 1993. Similarageements hold throughout the 82-90 km range.
[Meriwether
and
Mlynzack,
1995]
has
been
made.
However,
to elucidate the climatology
, a more quantitative
comparison using a credible simulation is needed.TIME-GCM simulation of representative
seasonal temperature profiles.
A new NCAR General Circulation Model hassimulated
the mesosphere,
thermosphere
and ionosphere
with coupled electrodynamics (TIME-C•M) from 30 to 500km with detailed
aeronomy
described
in Roble
and
Ridley
[1994], and has been used to calculate the structure of these regions over Fort Collins and lidar stations in France. Sincethe model
is being
compared
with averaged
data
from
these
stations,
the model is run for two hypothetical
cases,
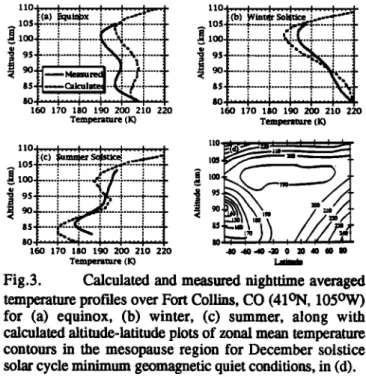
perpetual equinox and solstice solar cycle minimum, geomagnetic quiet conditions.The equinox
solution
is similar
to the
one
described
by
Robie
and
Ridley
[1994],
and
the
nighttime
averaged
profile
is shown
in dash
in Fig. 3(a). This temperature
profile
is
characterized
by a minimum
of about
204K near 83 kin, a
maximum
of about 208 K near 92 km and a deeper
Harmonic analysis and measured annual minimum
of 197 K near 104 km. It is attributed
to a
mean temperatures.
complex
radiative
balance
in the
mesospause
region.
CO2
infra-red
cooling
balances
the ozone
heating
below
about
80
To examine
the
differences
between
the
measured
mean km. Between
about
80 and
95 km heating
from
exothermic
temperatures
across
the Atlantic,
harmonic
analyses
on the reactions
associated
with HOx chemistry
as discussed
by
temperature
profiles
are
performed
to determine
their
annual Mlynczak
and Solomon
[1993]
produces
the temperature
mean
and the amplitudes
and phases
of their annual
and bulge
near
90 km. Nighttime
heating
rates
are on the order
semi-annual
temperature
variations.
Since
the distance
of 5-10 K/day in this narrow altitude region. The
between
OHP and
BIS in Southern
France
(-550 km) is temperature
minimum
near
100
km is caused
by the
strong
shorter
than
planetary
wavelengths,
we combined
the
data O-CO2 IR cooling
with rates
on the order
of 50 K/day.
sets
of the two French
sites
in these
analyses.
Both Heating
and
cooling
by gravity
waves
and
turbulence
are
Colorado
and
French
nightly
averaged
temperature
profiles
small,
especially
for equinox
conditions.
The
calculated
are
first
processed
by smoothing
with
a filter
of one-week
temperature
profile
is seen
to be
in qualitatively
agreement
resolution
0tauchecorne
et al., 1991;
Yu and
She,
1995]. with
the
average
of the
observed
nighfly
mean
temperature
'Shown
in Fig.
2 i• solid
are
the
profiles
of annual
profiles
at spring
and
fall
equinoxes.
The
higher
calculated
mean
temperature
determined
from lidar measurements
temperatures
may in part be the result
of discrepancies
between
83 and
103
km
over
Colorado
and
between
30 and between
gravity
wave
heating
and
turbulent
cooling
as
87 km over
Southern
France.
Also
included
for comparison
discussed
in Gavrilov
and
Robie
[1995].
are
those
deduced
from
the
reference
atmosphere,
CIRA
The
TIME-GCM
was
•so run
for solstice
solar
cycle
1986 at 40øN and 45øN. While, except
for a mild
systematic
difference
around
75 km [Hauchecorne
et al.,
1992],
these
profries
are in good
agreement
between
30 and
80 kin, considerable
discrepancy
exists
in the mesopause
region above 80 km. The main difference is that the CIRA1986 profiles
show
a single
temperature
minimum
of 178
K at 94 km, while the measured annual mean shows doubletemperature
minima
of 192 K and 196 K at 99 and 86 km,
respectively. The difference between two measured temperatures at 86 km is about 2 K, within theexperimental error. The lack of high resolution
measurements, which compelled the CIRA 1986 to deduce the temperatures between 86 and 120 km from the olderMSIS-83 [Hedin, 1983] empirical model of the
thermosphere,
is in part responsible
for the discrepancy.
Since
the
publication
of the
initial
lidar
temperature
profiles
[She
et al., 1993]
which
show
these
double
temperature
minima,
consistent
with a temperature
maximum
near 90
km in the Solar
Mes0sphere
Explorer
(SME)
data
[Clancy
et al., 1994],
suggestion
of chemical
heating
as the main
cause of the observed temperature inversion at -90 km110 .... i .... I .... I .... I .... I .... I .... I .... I .... I ...
i .•'.:'"?-'i Ahnt•al
Meatn
...
:?i"K!
...
!
...
...
00
...
....
i
...
i ...
i ...
i ...
i ...
i ...
80 ...
i ...
•
...
i '• ...
i ...
.r
...
i ...
i ...
i ...
70 ... '• ... .,: ... • ... ! ... ' ... ,• ... .,' ... i ... i ...
60 ....
Sodium
Lidar
(4
IN)
: ...
i ...
• Rayleigh Lidar (44N) .. ... CIRA 1986 (40N) ... CIRA 1986 (45N) -- -,,,,I .... I .... I .... I .... < 50- 40- 170 190 210 230 250 270 Annual Mean (K)
Fig. 2. Annual mean temperatures from harmonic
analysis. The broad and thin solid curves are deduced from
Na lidar (83 - 103 km) and Rayleigh
lidar (30 - 87 km),
respectively. The broad and thin dotted curves are from9s+ ... i ... • ... •....'.'%LX..• ...
.... q" ...
t
160 170 180 190 200 210 220
Temperature
llO [ .... I .... I .... ! .... I .... I---4 tic) •ummer sc•uc•
los+ ... ! ... ,: ... t..;•_-,•:.-':.•, ...
,oo•
...
... ! ... •-- .:- .... i ... ! ...-+ ...
•,:.--..•-.+
...
i ...
i ...
+
160 170 180 190 200 210 220 Temperature (!0 160 170 180 190 200 210 220 Tem!•.mture 10.J__.,l._ • '. : ; ',._.
equinox profile to the profile shown in Fig. 3(b). The cold
summer mesopause is seen in the high southern (summer
hemisphere) latitudes in Fig. 3(d) with a general
temperature increase to higher latitudes in winter. The
departures from the equinox profile are driven by dynamics
in both cases and the magnitude of the departures are
dependent upon the magnitude of the gravity wave forcing.
Profiles of the annual and semi-annual
temperature variations.
The amplitudes and phases of the annual and semi-
annual
temperature
variations
measured
at Colbrado
and
Southern France are shown in Figs.4(a)-(d) along with those deduced from CIRA 1986 for 40øN and 45øN. Thereis general agreement in the annual amplitude for altitudes
Fig.3.
temperature profiles over Fort Collins, CO (41 ON, 105øW) for (a) equinox, (b) winter, (c) summer, along with calculated altitude-latitude plots of zonal mean temperature contours in the mesopause region for December solstice solar cycle minimum geomagnetic quiet conditions, in (d).
Calculated
and
measured
nighttime
averaged
above
50 km
and
in the
annual
phase
up
to 99 km.
Both
measured peak annual amplitudes occur at 86 km, with
Colorado value 4:5 K cooler, in agreement with the CIRA
1986 profiles which show peaks at 85 km with value at
40øN 6 K cooler than that at 45øN. The latitude difference in radiative and gravity wave heating is mainly responsible
for this South-North temperature difference. Botli CIRA
minimum
geomagnetic
quiet
conditions.
To obtain
1986
and
measured
profiles
show
nodes
near
65 and
~100
reasonable
agreement
with
climatology
it was
found
that km
in the
annual
amplitude.
As
the
profiles
of annual
phase
the
winter
hemisphere
required
four
times
larger
gravity
indicate,
the
annual
temperature
variation
between
these
wave
energy
flux than
the summer
hemisphere
whose
nodes
is out-of
phase
with
the
mean
flux
of solar
forcing.
gravity
wave
forcing
was
similar
to
the
equinox
values.
We Thus
our
lidar
measurements
confirm,
for
the
entire
altitude
did
not
specify
any
planetary
wave
forcing
in the
winter
range,
this
key aspect
of the mesosphere,
as previous
hemisphere
and
considered
only
gravity
wave
fluxes
to
close
modeling
and
observations
have
shown.
To reflect
wave-
and
reverse
the
summer
and
winter
mesospheric
jets.
The driven
circulation
in this
region,
we may
more
correctly
calculated
winter
and summer
nighttime
averaged
regard
the
atmosphere
near
the
peak
annual
variation,
at 86
temperature
profiles
are
shown
in Figs
3(b)
and
3(c)
and km,
as
the
mesopause
of the
atmosphere.
compared
with
the
observed
profiles,
respectively.
The
Unlike
the
CIRA
1986
profiles,
there'
exist
strong
winter
temperature
profile
shows
a monotonic
temperature
semi-annual
oscillations
(SAO)
at 64 km,
80 km
and
102
decrease
with
increasing
altitude
to a single
temperature
km
in the
measured
profiles,
Fig.
4(c).
Similar
SAO
at -65
minimum
of 186
K near
102
km before
increasing
and-80
km
were
reported
from
the
SME
observations
dramatically
with
altitude
within
the
lower
thermosphere.
[Clancy
et al., 1994].
The
SAO
at 80 km,
peaked
slightly
This profile is seen to be similar to the measured profile for winter conditions. The summer profile has a deep minimum of 170 K near 84 km before increasing with altitude into the thermosphere. There is a calculated maximum near 94 km associated with strong nighttime HOx heating and a secondary minimum from CO2 cooling but the general temperature trend is increasing with altitude which is different from that of the equinox simulation. Altough the HOx heating maximum produces a stronger temperature bulge than is observed by the lidar, the calculated profile is qualitatively similar to the observations.
The overall profile change can be understood by examining the zonal mean temperature contours calculated for winter solstice conditions as shown in Fig. 3(d). The
main difference between the winter and summer solstice
profiles, compared to the near radiative equilibrium profile of equinox, is caused by the compressional heating and expansion cooling of the mean motions respectively. It is well known that momentum deposition of breaking gravity waves in the mesosphere reverses the zonal winds, drives a strong mean meridional circulation, and produces a very cold summer and warm winter mesopause as shown _in Fig. 3(d). In the winter hemisphere this additional dynamic heating acts to change the near radiative equilibrium
110 [.... I-g.•: ! .... ! .... !" ' '•l ZZ0t... !---I---I---I---I--.1
1
O0
•i•-.•.;::-.-
:i
...
.•
...
T
100-•
...
2.
...
"
...
•l!..'.';-..'..-v.-.
•-•
ß
4-
9o
..:.•
....
...
...
i...L.i
...
...
...
•.
...
...
...
•,of...• ...
ß •: 6o 4-'•;• ... i-_- - ... i ...j ...
-i
• ......
+-• •,o
.......
:,
...
•
"...
•.
:...
•...
:•o•..• ...
,'"'-•n,
....
•.
...
,'""•
•ø•'"::;':.4::4:=
...
!
...
i ...
3 • •o•
...
• ...
•...•,.•
...
•
...
•
...
40 ... •.."-•L::•-.-i ... :. ... 40 ... •. ... •- --}j ... 4 : : ,I: : : ... • ...
,ot,':':':t•=?.:';i•:':'l,
0, , ,':'::':?•.,• ,o,•:-'•...!..'{..!...!;•5.t
5 10 15 20 25 0 2 4 6 8 10 12Annual Amplitude (K) Annual Phase (M)
110 [ I I ! • I I l 100 .... ;-•--: ... :-- ' ! . --
oo '"'"'."':"i
...
i ...
i ....
• 8o '.-.:.,...::,:-.:----..-- "• ... i .... • 70 .... • ... i '...i ... i .... .P : ; : : ,o•:?• :...,...•_.,, .----4 .... 3o l""•'-•-.. i•..._'i .... 'i 0 1 2 3 4 5 6 7 Semi-annual Amplitude (K) 11o[ .... I .... I .... I .... I .... 1•--4lOOk'"+
...
oot--"--w-::----•
....
8o-• ... , ... '. '-• ... • .... '-t-6o
704- ......
œ
...
i
...
J
...
•..i
...
...
:::::::::::::::::::::::::::
: : : o•1 •' •o l .... o 1 2 3 4 $ 6 semi-annual Phase(M)Fig. 4. Profiles of annual amplitude (a), annual phase
(b), semi-annual amplitude (c) and semi-annual phase (d) from harmonic analysis (30-110 kin). The broad and thin
solid curves are from Na temperature lidar and Rayleigh
lidar, respectively. The broad and thin broken curves are
380
before
equinox,
may
be related
to the semi-annual
variations
ATM 94-15853.
The work
at NCAR is sponsored
by NSF
in ozone
concentration
[Garcia
and Solomon,
1985].
As in and
partially
by the NASA Space
Physics
Theory
Program
CIRA 1986,
the
observed
semi-annual
amplitude
reaches
a (S-97239-E).
One of us (She) gratefully
acknowledges
sharp
upper
minimum
at ~ 93 km, 5 km below
the upper helpful
discussions
on SAO
with
Todd
Clancy.
node of the observed annual amplitude. Above this altitude,
both annual and semi-annual amplitudes increase with References altitude, suggesting radiative dominance in the
thermosphere.
Unlike
CIRA 1986,
aclearmidlafitudeSAO
Clancy, R. T., D..W. Rusch
and M. T. Callan,
that
resembles
the
SME
observed
strong
equatorial
SAO
at
Temperature
minima
in the
averaged
thermal
structure
90 km [Clancy et al., 1994] is observed at ~102 km.
Like the annual mean, the annual and semi-annual
amplitudes and phases measured at Colorado and Southern France match each other very well between 83 and 87 km; the measured profiles can indeed be combined into one, giving a zonal averaged profiles extending from 30 to 105
km.
Conclusion
The nightly averaged temperatures between 81 and 90
of the middle
mesosphere
(70-80 km) from analysis
of
40-92 km SME global temperature
profiles, J.
Geophys. Res., 99, 19001-19020, 1994.Fleming,
E. L., S. Chandra,
J. J. Barnett,
and M. Comey,
Zonal mean temperature, pressure, zonal wind and
geopotential height as functions of latitude, Adv. Space Res. 10, 11-59, 1990.
Garcia, R. R. and S. Solomon, a numerical model of zonally averaged dynamical and chemical structure of
the middle atmosphere, J. Geophys. Res., 88, 1379-
1400, 1983.
km observed
regularly
over a period
of three
consecutive
Gavrilov,
N.M. and
R.G.Roble,
The effect
of gravity
waves
years at midlatitude
sites across
the Atlantic by two
on the global mean temperature
and compositional
different lidar techniques are shown to track one another.Their details are investigated by harmonic analyses of the measured temperature profiles between 83 and 103 km over
Colorado and between 30 and 87 km over Southern France.
While the annual mean temperatures between 30 and 80 km are in agreement with the reference atmosphere of CIRA 1986, the measured double minima in the mesopause region is not compatible with any reference atmosphere known.
The new 3D TIME-GCM model simulation which included
known mechanisms of chemical heating as well as gravity and tidal wave perturbations however gives temperature profiles in this region that compares qualitatively well with the measured ones. This agreement suggests the importance of the exothermic HOx chemistry and provides a basis for detailed understanding of the heating and cooling mechanisms and for fine-tuning the TIME-GCM.
The measured pr6files of annual and semi-annual
temperature variations have been compared with those deduced from CIRA 1986. The profiles of annual amplitude and phase clearly depict a region in the midlatitude middle atmosphere between 65 and 99 km with circulations controlled by dynamics. A 4.5 K. difference between the
annual
amplitude
maxima
at 86 km between
sites
across
the
Atlantic is due to the South-North gradient between 41øN
and 44øN. Within experimental errors, the measured
profiles of temperature variations match each other in the upper mesosphere where .both data sets overlap. These profiles suggest that the data sets may be combined to form
structure of the upper atmosphere, J. Geophys. Res.,
in press, 1995.
Hauchecorne,
A., M. L. Chanin and P. Keckhut,
Climatology and trends of the middle atmospheric
temperature (33-87 km) as seen by Rayleigh lidar over
the south of France, J. Geophys. Res., 96, 15297- 15309, 1991.
Hedin, A. E., A revised thermospheric model based on mass
spectrometer and incoherent scatter data: MSIS-83, J. Geophys. Res., 88, 10170-10185, 1983.
Meriwether, J. W. and M. G. Mlynczak, Is chemical
heating a major cause for the mesosphere temperature
inversion layer?, J. Geophys. Res. (in press), 1995.
Mlynczak, M. G. and S. Solomon, A detailed evaluation of
heating efficiency in the middle atmosphere, J.
Geophys. Res., 98, 10517-10541, 1993.
Roble, R. G., and E. C. Ridley, A thermosphere-
ionosphere-e!ectrodynamics general circulation model(TIME-GCM): Equinox solar cycle minimum
simulation (30- 500 km), Geophys. Res. Lett., 21, 417-420, 1994.
She, C. Y., J. R. Yu and H. Chen, Observed thermal structure of a midlatitude mesopause, Geophys. Res. Lett., 20, 567-570, 1993.
Yu, J. R. and C. Y. She, Climatology of a midlatitude
mesopause region observed by a lidar at Ft. Collins,
CO, J. Geophys. Res., in press, 1995.
zonal mean profiles
extending
from 30 to 105 kin. The
C.Y.
She, and David A. Krueger, Physics
general
consistency
and
continuity
of measured
temperature
Department,
Colorado
State
University,
Fort Collins,
CO
profiles
by different
lidar techniques
at mid-latitude
sites 80523,
USA
across
the Atlantic
suggest
not only the value
of regular
J.R. Yu, Department
of Electrical
Engineering,
observations
of using
collocated
Rayleigh
and
narrowband
University
of Illinois,
Urbana,
IL 61820,
USA
resonance lidars but the fact that two or three such state-of- Raymond Roble, High Altitude Observatory, NCAR,
the-art
lidar stations,
strategically
located
at each
of the Boulder,
CO 80307,
USA
equatorial,
midlatitude,
and
polar
regions
will be sufficient
Philippe
Keckhut,
Alain
Hauchecome
and
Marie-Lise
for the continued
monitoring
and
climatological
studies
of Chanin,
Service
d'Aeronomie
du CNRS, Verrieres
le
the
middle
atmosphere.
Buisson
Cedex,
91371,
France
Acknowledgments. The work at Colorado State