HAL Id: hal-00828697
https://hal.archives-ouvertes.fr/hal-00828697
Submitted on 10 May 2021
HAL is a multi-disciplinary open access
archive for the deposit and dissemination of
sci-entific research documents, whether they are
pub-lished or not. The documents may come from
teaching and research institutions in France or
abroad, or from public or private research centers.
L’archive ouverte pluridisciplinaire HAL, est
destinée au dépôt et à la diffusion de documents
scientifiques de niveau recherche, publiés ou non,
émanant des établissements d’enseignement et de
recherche français ou étrangers, des laboratoires
publics ou privés.
Distributed under a Creative Commons Attribution| 4.0 International License
heterotrophic nanoflagellates in Rhone River diluted
mesoscale structures (NW Mediterranean Sea).
Urania Christaki, C. Courties, F. Joux, W.H. Jeffrey, J. Neveux, J.J. Naudin
To cite this version:
Urania Christaki, C. Courties, F. Joux, W.H. Jeffrey, J. Neveux, et al.. Community structure and
trophic role of ciliates and heterotrophic nanoflagellates in Rhone River diluted mesoscale
struc-tures (NW Mediterranean Sea).. Aquatic Microbial Ecology, Inter Research, 2009, 57, pp.263-277.
�10.3354/ame01339�. �hal-00828697�
INTRODUCTION
As the main river source flowing into the Mediter-ranean Sea, the Rhone River contributes an average of ~1750 m3 s–1of freshwater (Naudin et al. 1997). This
represents a major nutrient source for the Gulf of Lions
in the northwestern Mediterranean Sea, greatly influ-encing its productivity (Lefèvre et al. 1997). Despite the high nutrient concentrations available close to the mouth of the river, the rapid spread of the plume is not propitious to marine or freshwater phytoplankton development (Naudin et al. 2001). Depending on the
© Inter-Research 2009 · www.int-res.com *Email: [email protected]
Community structure and trophic role of ciliates and
heterotrophic nanoflagellates in Rhone River diluted
mesoscale structures (NW Mediterranean Sea)
Urania Christaki
1,*, Claude Courties
2, Fabien Joux
3, Wade H. Jeffrey
4,
Jacques Neveux
3, Jean-Jacques Naudin
31Univ Lille Nord de France, ULCO, LOG, CNRS, UMR 8187, 32 Avenue Foch, 62930 Wimereux, France 2UMPC Univ Paris 06, FRE 3247, MBCE, CNRS, Observatoire Océanologique, 66651 Banyuls-sur-Mer, France
3UMPC Univ Paris 06, FRE 3247, MBCE, LOBB, CNRS, UMR 7621, Observatoire Océanologique, 66651 Banyuls-sur-Mer, France 4Center for Environmental Diagnostics and Bioremediation, 11000 University Parkway, University of West Florida, Pensacola,
Florida 32514, USA
ABSTRACT: Studies of the Rhone River plume, and in particular its diluted mesoscale structures, have shown over recent years that low salinity water (LSW) is characterised by both high primary and high secondary productivity. Here we compare the structure and grazing activity of the hetorotrophic community (nanoflagellates, ciliates) in the LSW and the surrounding marine water (MW) of the northwestern Mediterranean Sea. Furthermore, we report on the temporal variability of these char-acteristics all along a Lagrangian track in the LSW. In May 2006, salinity of the LSW ranged from 31.41 to 38.25 down to a depth of 35 m, and surface chlorophyll a concentration reached 15.5 µg l–1.
The ciliate community structure was similar in both the LSW and the MW, characterised by the dom-inance of the mixotrophic ciliates Laboea strobila and Myrionecta rubra. The ciliate biomass was
approximately 6 times greater in the LSW, compared to the MW. This difference was due to the mixotrophic ciliates, which were about 4- to 5-fold more important in terms of abundance and bio-mass in the LSW, while heterotrophic ciliates only increased by a maximum of 2-fold. M. rubra was
the most abundant species reaching 4600 cells l–1, while L. strobila was dominant in terms of biomass,
accounting for 47% of total biomass in the LSW. Ciliates, in particular mixotrophs, were very active in the LSW where they grazed on phytoplankton at rates near their maximum clearance capacities. Mixotrophic and heterotrophic ciliates in LSW consumed about 50 and 10% of the nanophytoplank-ton stock per day, respectively. The mixotrophic ciliate L. strobila was found to be an efficient grazer
of nanophytoplankton. In contrast to the ciliates, the biomass of heterotrophic nanoflagellates was similar in both the LSW and the MW; thus, we suggest that the transfer of bacterial biomass in the LSW towards higher trophic levels was moderate.
KEY WORDS: Bacterivory · Grazing · Mixotroph · Laboea strobila · Picoeucaryotes · Rhone River
plume
Resale or republication not permitted without written consent of the publisher
OPEN
PEN
ACCESS
CCESS
density gradient induced by the river input, and the intensity of mixing processes, high bacterial produc-tion generally occurs within the first 10 km south-west-ward of the river mouth (Joux et al. 2005, Pujo-Pay et al. 2006). Farther offshore (10 to 20 km), a zone of high primary productivity is often observed at salinity higher than 34 (Naudin et al. 2001). Recent studies have shown that, depending on seaward or landward prevailing wind conditions, diluted lenses of low-salin-ity water (LSW) may accumulate along the coast, detach from the plume, and then be transferred along the continental shelf (Diaz et al. 2008). As shown by satellite images (Bosc 2002), these diluted water masses may extend hundreds of kilometres south-westward and are associated with higher chlorophyll a
(chl a) concentrations than in the surrounding
olig-otrophic marine water (MW) of the Mediterranean Sea (Joux et al. 2009). These LSWs, isolated from their river origin, may be viewed as ‘macrocosms’ in which bio-logical processes modify dissolved and particulate material during the offshore transfer.
Nanoflagellates are generally recognised as respon-sible for packaging bacterial biomass, enabling its transfer to higher trophic levels (e.g. Christaki et al. 2001). Together, nanoflagellates and ciliates play a key role in the transfer of bacterial and phytoplankton bio-mass to higher trophic levels through grazing. The quantity of carbon channelled to higher trophic levels is a consequence of both food web structure and the conversion efficiencies of the grazers. The role and importance of ciliates within these food webs also depends upon their trophic type. In general, plank-tonic ciliates can be thought of as being comprised of 2 groups: heterotrophs and mixotrophs (Stoecker et al. 1987, Laval-Peuto & Rassoulzadegan 1988, Johnson & Stoecker 2005). Mixotrophs exploit sequestered chloroplasts to supply a part of their nutritional requirements, a trophic mode that would, a priori,
seem to be an adaptation to oligotrophic conditions (Dolan & Pérez 2000). However, as a percentage of total ciliates, mixotrophs can vary between <10% to almost 100% without a clear relationship to the trophic state of the system (e.g. Sime-Ngando et al. 1992, Ver-ity & Vernet 1992, Bernard & Rassoulzadegan 1994).
Shelf-slope ecosystems occupy a relatively small proportion of the world ocean but yield the majority of its fish catch. Recent estimates indicate that on a global scale, the consumption of ciliates alone amounts to greater than one third of the C flux processed by zoo-plankton grazing on phytozoo-plankton (e.g. Maar et al. 2002, Calbet & Saiz 2005). In addition, ciliates are an excellent food source for copepods (Dutz & Peters 2008) and may also be an important food source for organisms other than copepods. For example, a field study by Zhang et al. (2002) showed that peaks of
cili-ates coincided not only with peaks of copepods but also with the post-larvae anchovy Engraulis japonicus
in the coastal waters of the Yellow Sea. They sug-gested that large aloricate ciliates may be insug-gested by the first feeding anchovy larvae. In the northwestern Mediterranean Sea, high egg and larval abundance for anchovies were reported in hydrologic structures off the Catalan coast (Palomera 1992, Salat 1996). These zones of high abundance are associated with low salin-ity water (Tudela & Palomera 1997) that could originate from the Rhone River (Sabatés et al. 2001). These authors have suggested that the larvae might benefit from remaining in water with high chl a concentration
and microzooplankton abundance.
Here we describe the results derived from the field campaign, Biochemical processes in the Rhone fresh-water influence (BIOPRHOFI), conducted from 14 to 28 May 2006 on board the French R/V ‘Le Suroît’ to characterise and compare the biogenic stocks and fluxes associated with both the LSW and the MW. A Langrangian sampling strategy was performed to doc-ument the hydrological conditions and biological pro-cesses as a function of time. Our objectives were to provide information on the nano- and microzooplank-ton in low salinity waters relative to MW, with empha-sis on the heterotrophic nanoflagellates (HNF) and ciliates, and to examine their potential role in chan-nelling carbon to the higher trophic levels. We hypoth-esized that the different water masses have different microbial food webs.
MATERIALS AND METHODS
Sampling site. The study area was located in the northwestern Mediterranean Sea off the mouth of the Rhone River. To localise the LSW with high chl a
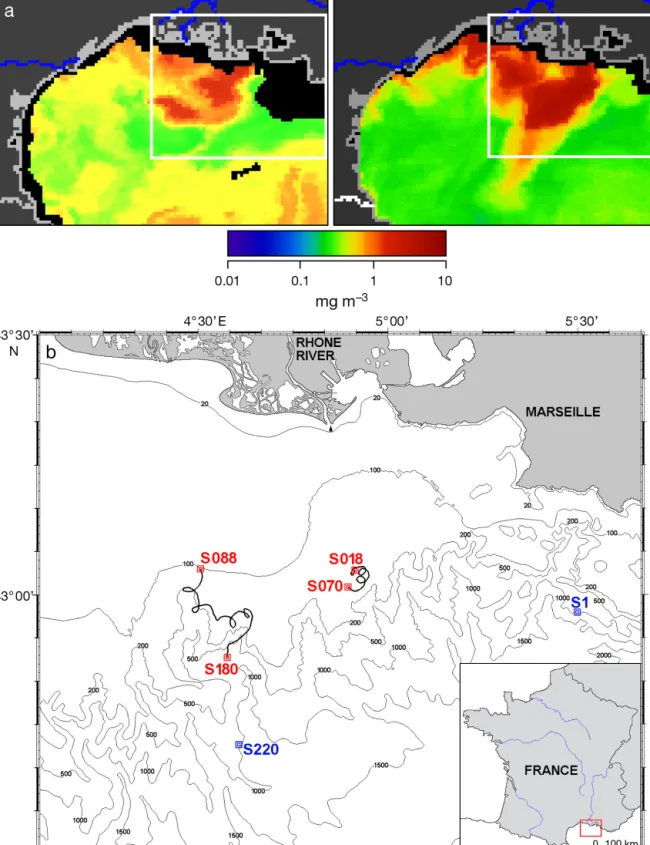
con-tent, MODIS satellite images were received daily on board. Images indicated that the LSW were located 15 miles south of the river mouth at the start of the cruise and then moved 20 miles south-westward. (Fig. 1a). Consequently, 2 investigations were carried out, the first between 43° 00’ to 43° 03’ N and 4° 54’ to 4° 57’ W, and the second between 42° 53’ to 43° 03’ N and 4° 28’ to 4° 39’ W. Sampling campaigns lasted for 61 and 107 h, respectively. The MW stations outside the LSW influence were also sampled at the start (42° 58’ N to 5° 30’ W) and at the end of the cruise (42° 42’ N to 4° 37’ W).
Sampling strategy.The Lagrangian sampling strat-egy was based on the deployment of a 10 m high Holey-sock buoy, drifting between 5 and 15 m depth. During each trajectory, hourly CTD profiles of temper-ature and conductivity were recorded with a SeaBird 9/11+ equipped with additional sensors for
fluores-Fig. 1. (a) Chlorophyll a surface concentration based on MODIS satellite images (supplied by Joint Research Center, Ispra) of the
Gulf of Lions on May 11 (upper left) and May 24 (upper right). The studied area is located in the white rectangle. (b) Detailed view of the studied area with the first trajectory (43° 00 to 43° 03 latitude and 4° 54 to 4° 57 longitude) with Stns S18 to S70, and the second trajectory (42° 53 to 43° 03 latitude and 4° 28 to 4° 39 longitude) with Stns S88 to S180. Two additional reference marine Stns S1 (42° 58 latitude, 5° 30 longitude) and S220 (42° 42 latitude, 4° 37 longitude) were sampled at the beginning and the end
cence (Chelsea Aqua 3), light transmission (Seatech Wetlab Cstar), and oxygen (SBE 43). In addition to hourly CTD profiles, sampling was carried out every 2, 6 or 12 h, depending on the parameters considered. Water samples were collected from 12 l Niskin bottles attached to the CTD-rosette system at depths of 5, 10, 15, 20 and 50 m. The first trajectory included Stns S18 to S70, the second trajectory Stns S88 to S180 (Fig. 1b, Table 1).
In addition to the marine reference stations (S1 and S220) sampled at the start and end of the cruise, 5 other stations were sampled at each of the 5 depths during each deployment for HNF and ciliates. Fifteen and 29 stations were sampled at the 5 m depth only during the 1st and 2nd trajectories, respectively (Table 1).
To measure chl a, phytoplankton were collected by
filtering 500 ml of seawater through 47 mm GF⁄F glass fibre filters (Whatman). Pigment extraction, using 90% acetone, was processed immediately on board, with the extract kept for 12 h in the dark at 4°C and then centrifuged. Fluorescence properties of the super-natant were measured on a Hitachi F4500 spectro-fluorometer operating in the ratio mode to determine chl a concentrations (Neveux & Lantoine 1993). NO3,
NO2 and PO4 were stored at –20°C and analyzed
within 1 mo of collection, according to Tréguer & Le Corre (1975) on a Skalar auto-analyser.
Heterotrophic bacteria and pico- and nanophyto-plankton.Abundance of pico- and nanophytoplankton was analysed onboard from freshly collected CTD bot-tle samples. Measurements for both communities were performed with a flow cytometer (FACSCan, Becton Dickinson) equipped with a 488 nm, 15 mW Argon laser. Phytoplanktonic cells were discriminated and enumerated according to right-angle light scattering properties (roughly related to cell size) and orange (FL2, 560 to 620 nm) and red (FL3 > 670 nm) fluores-cence. Data acquisition was performed using Cel-lQuest software, (BD-Biosciences). Fluorescent 1 µm
diameter beads (Polysciences), used as an internal standard, were systematically added to each analysed sample. For each discriminated population, cell fluo-rescence and light scatter emissions were normalised by dividing them by homologous bead properties, thereby making results comparable.
We distinguished 3 major groups of picophytoplank-ton: Synechococcus spp. (SYN, also characterised by
orange fluorescence from phycoerythrin pigment);
Prochlorococcus spp. (PRO) and photosynthetic picoeukaryotes (PIC). Three phototrophic nano-planktonic cell types were also determined and char-acterised by apparent cell size and red fluorescence.
For counting of bacteria, seawater samples (2 ml) were preserved with 2% (final conc.) formaldehyde, quickly frozen in liquid nitrogen and then stored at –80°C. Flow cytometric analysis was then carried out over the next 2 mo. Before analyses, samples were thawed at room temperature and stained with SYBR Green I (0.01% vol/vol final conc., Molecular Probes). Bacteria were discriminated on a plot of their right-angle light scatter (roughly related to size) versus green fluorescence measured at 530/30 nm and related to nucleic acid content. From this cytogram, green fluorescence and light scatter from phytoplank-ton cells were excluded in order to obtain accurate heterotrophic cell counts.
To convert bacterial abundance to biomass, the con-version factor of 16.1 fg C cell–1was used. This value
was determined from biovolume measurements of samples stained with 2.5 µg l–1 of
4’-6’-diamidino-2-phenylindole (DAPI) and using an epifluorescence microscoscope with semi-automated image analysis (Cottrell & Kirchman 2003). The factor of 380 fg C µm– 3
was then used to convert biovolume in biomass (Lee & Fuhrman 1987). No significant differences in bacterial biovolume were observed between samples from the LSW and the MW (data not shown).
Bacterial production was measured by [4.5-3
H]-leucine incorporation (Kirchman 2001) as described in
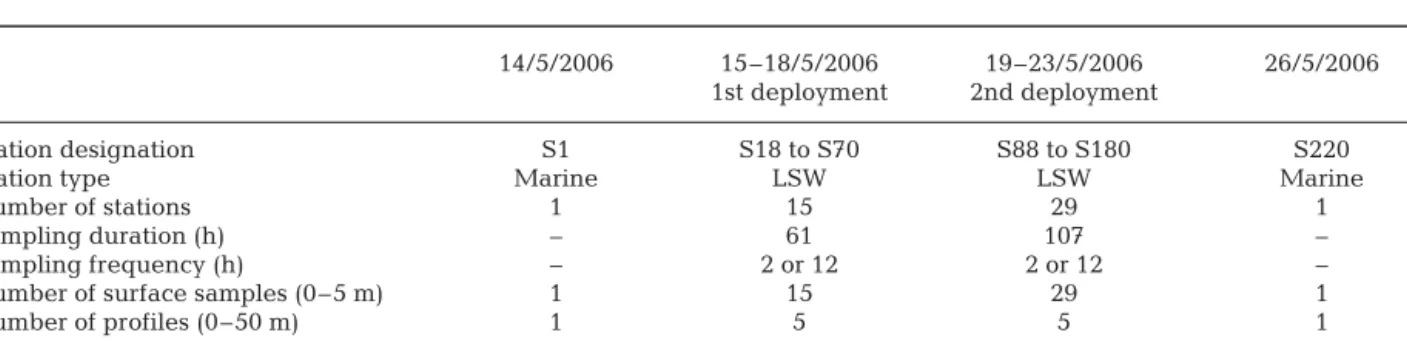
14/5/2006 15–18/5/2006 19–23/5/2006 26/5/2006 1st deployment 2nd deployment
Station designation S1 S18 to S70 S88 to S180 S220 Station type Marine LSW LSW Marine
Number of stations 1 15 29 1
Sampling duration (h) – 61 107 – Sampling frequency (h) – 2 or 12 2 or 12 – Number of surface samples (0–5 m) 1 15 29 1 Number of profiles (0–50 m) 1 5 5 1 Number of grazing experiments (5 m) 1 5 5 1 Table 1. Sampling dates and descriptions for heterotrophic nanoflagellates (HNF) and ciliates counts, and for grazing experi-ments. S1, S18 to S70, S88 to S180 and S200 define sampling stations. LSW: low salinity water. For time of grazing experiments and duration of each deployment see ‘Materials and methods’, and for station coordinates see Fig.1. –: marine stations were
detail in Joux et al. (2009). Briefly, samples (2.5 ml in triplicate) were incubated in the dark at 18°C for 1 h with 2 nM 3H-Leu (specific activity 117 Ci mmole–1,
Perkin Elmer) and 18 nM of unlabelled leucine. The incorporated 3H-Leu was collected by micro-centrifu-gation after precipitation by trichloroacetic acid (TCA; 5% final conc.) and samples were rinsed with TCA and ethanol. Finally, the precipitates were re-suspended in 1 ml of a liquid scintillation cocktail (FilterCount, Perkin Elmer) and radioactivity determined by liquid scintillation counter (LS 5000CE Beckman). Rates of live samples were corrected for adsorption of radioac-tivity with TCA-killed controls before addition of 3
H-Leu. Incorporation rates were converted into carbon production using the conversion factor of 2.1 kg C pro-duced per mole of leucine incorporated according to Gasol et al. (1998) for coastal water in the NW Mediter-ranean Sea during the summer season.
Heterotrophic nanoflagellates and ciliates.To enu-merate HNF, 20 to 30 ml samples were preserved using formaldehyde at a final concentration of 2% (Table 1). Samples were filtered onto black Nuclepore filters, (pore size: 0.8 µm) and stained with DAPI (Porter & Feig 1980) within 5 h of sampling and stored at –20°C until count-ing. HNF were enumerated using a LEITZ DMRB epiflu-orescence microscope at 1000×. To distinguish between autotrophic and heterotrophic nanoflagellates, autoflu-orescence (chlorophyll) was determined under blue light excitation. HNF were divided into 5 size groups (2–4, 4–5, 5–7, 7–10 and >10 µm) and an average biovolume (10.2, 44.5, 89, 282 and 2188 µm3, respectively) of each
group was calculated based on the linear dimensions (length and width) of a total of 100 cells within each group using an image analyser with a camera mounted on the microscope. Biovolume of HNF was calculated on the assumption that their shape was ellipsoidal and was then converted to biomass using a conversion factor of 220 fg C µm– 3(Børsheim & Bratbak 1987).
For ciliate enumeration, duplicate samples (250 ml) were placed in opaque glass bottles. One 250 ml sam-ple was fixed with acid Lugol’s solution (final conc. 2%) for quantitative counts, and the other with borax-buffered formaldehyde (final conc. 1%) for determina-tions of the trophic type of the ciliates — heterotroph or mixotroph, based on the presence or absence of se-questered chloroplasts. The samples were then stored at 4°C in the dark until analysis (max. 3 mo later). The fixed samples were allowed to settle for 3 d, with the su-pernatant being gently removed. This left ~100 ml of concentrate which was further sedimented in 100 ml Hydrobios chambers for at least 24 h before enumera-tion using an Olympus IX-70 inverted microscope at 400 × magnification. Lugol’s fixed samples were enu-merated and sized with phase contrast. The formalde-hyde-fixed samples were examined using blue light
ex-citation (DM 500 nm dichroic mirror, BP 450 to 480 nm exciter filter, BA 515 nm barrier filter and a 100 W mer-cury burner) to detect chlorophyll autofluorescence and to distinguish plastidic from non-plastidic ciliates.
Ciliates were identified wherever possible to genus or species level following Balech (1959), Maeda & Carey (1985), Maeda (1986), and Laval-Peuto & Rassoulzade-gan (1988). Ciliates were further divided into 5 size groups (10–20, 20–30, 30–50, 50–100 and 100–150 µm). Linear dimensions (length and diameter) were measured at 400 × magnification using an image analyser with a camera mounted on the microscope. Biovolumes of cells were calculated assuming the nearest geometrical shape; for this a minimum of 10 cells (for rare tintinnids) to a maximum of 100 to 120 cells (for the most abundant species such as Laboea strobila, Tontonia sp. Strombid-ium conicum and Myrionecta rubra) were measured.
Biovolumes were converted to carbon biomass using a conversion factor of 190 fg C µm– 3for Lugol’s preserved
samples (Putt & Stoecker 1989).
Grazing experiments.Twelve grazing experiments were performed, 10 in the LSW (5 during each deploy-ment) and 2 in the MW (Table 1) on water sampled at 5 m and on one occasion also at 20 m, during the 2nd deployment. The grazing experiments were conducted at 0, 12, 24, 48, 70 h and at 0, 24, 48, 72 and 96 h from the beginning of the first and second deployments, respectively.
Grazing by heterotrophic nanoflagellates:
Dupli-cate bottles (50 ml) were inoculated with 0.5 × 10⁵ml–1
fluorescently labelled bacteria (FLB; stained with 5-(4, 6-dichlorotriazin-2-yl) aminofluorescein, DTAF) prepared a few weeks before the cruise from coastal MW using the protocol of Sherr et al. (1987). To pro-duce FLB with the same variability in shape and vol-ume as natural bacterioplankton, we concentrated and labelled natural bacteria without prior enrichment as described in 2imek et al. (2003). We determined HNF ingestion in sub-samples from short-time incubations of 15 min and 30 min. The estimated in situ ingestion
rate of HNF feeding on natural bacterioplankton (bact HNF–1 h–1) was then calculated by multiplying the
ingestion rate of FLB by the ratio of bacteria to added FLB (Sherr et al. 1987).
Grazing by ciliates: Two types of fluorescently
labelled prey (FLP) were prepared from early station-ary cultures of the photosynthetic picoeukstation-aryote
Ostreococcus tauri (fluorescently labelled Ostreococ-cus, FLO, 0.8 to 1.5 µm), originally isolated in the
Mediterranean Thau lagoon, France, (Courties et al. 1994) and Nannochloropsis sp. (211/78 CCAP culture
collection; fluorescently labelled algae, FLA, 3 to 4 µm in diameter), according to Rublee & Gallegos (1989), detailed in Karayanni et al. (2005). The FLP act as ana-logues of pico- and nano-sized cells of similar
diame-ters. We employed FLO as an analogue of Synechocco-cus and phototrophic picoeukaryotes and FLA as an
analogue of the smaller population of photosynthetic nanoplankton mostly represented by phototrophic nanoflagellates (PNAN) detected during this study by flow cytometry (3 to 5 µm).
Grazing experiments were conducted at the same stations and depths as for the bacterivory experiments. Water samples (1.2 l) were dispensed into polycarbon-ate bottles. One prey analogue, (FLO or FLA) was added to each sample in concentrations of 103 FLO
ml–1or 102to 103 FLA ml–1. After the addition of the
prey analogues, subsamples were immediately taken for T0counts of FLO and FLA. For ciliate food vacuole
content analysis, 250 ml subsamples were taken at 0, 15 and 30 min and fixed immediately with 2% borate buffered formaldehyde. Samples were stored in the dark at 4°C until analysis by epifluorescence micro-scopy. Uptake rates of fluorescently labelled prey (FLO or FLA ciliate–1h–1) were calculated for 15 min
incuba-tion times in most experiments, as after 30 min the average number of FLO or FLA per ciliate (CIL) had levelled off. The estimated in situ ingestion rate of
cili-ates feeding on pico- or nanoplankton (cells CIL–1h–1)
were then calculated by multiplying the ingestion rate of FLP by the ratio of abundances of natural prey to added FLP as for FLB.
RESULTS
Characteristics of the study area
During the BIOPRHOFI cruise, the daily Rhone River flow ranged from 1239 to 2292 m3s–1(mean: 1756 m3
s–1), with a 3 d peak discharge of over 2200 m3s–1from
May 20 to 22. South-westward of the river mouth, a large dilution zone was associated with high surface chl a as shown by the MODIS satellite images from
May 11 and May 24, 2006 (Fig. 1a).
To distinguish the different water masses, and to relate them to the distributions of ciliates and HNF, we employed an averaged salinity profile calculated from the 146 hourly CTD casts recorded during the 2 trajec-tories. The LSW extended down to a maximum of 35 m depth with variable salinity < 38.25, whereas the deeper MW was characterised by a constant increase of salinity with depth. Within the LSW, 2 water masses were distinguished: (1) the surface ‘plume water’ where salinity is highly variable (31.41 to 36.59) lying between the surface and a depth of 5.25 m, and (2) the intermediate ‘diluted water’ (salinity from 36.60 to 38.25, Table 2) where salinity increasing with depth can be described by a ‘power function’. The surface plume layer was also characterised by higher nutrient
concentrations compared to the underlying diluted water or the surrounding MW (Table 2, Fig.2). The highest concentration of chl a was found in the plume
water (up to 15.5 µg l–1), while diluted water was on
average 2-fold higher than in the MW (Table 2, Fig. 2).
Autotrophic pico- and nanoplankton
Pico- and nanoautotrophs showed contrasting abun-dance in the 3 water types. Prochlorococcus spp. was
absent in the plume waters but found in relatively low concentrations of a few hundred cells per milliliter in the diluted and MW. Synechococcus spp. was present
in the 3 water types, showing a higher average concen-tration in the MW (Table 2). Pico- and nanoeukaryotes were more abundant in the LSW than in the surround-ing MW. Picoeukaryotes were on average about 2-fold more abundant in the plume waters, and showed simi-lar abundance in diluted and MW. Nanoautotrophs, which were abundant in all the 3 water types, showed on average a 3 to 5 fold higher abundance in the plume waters compared to marine and diluted waters (Table 2). LSW MW Plume Diluted Salinity 34.85 ±1.24 37.91± 0.36 38.28 ± 0.036 (31.41–36.59) (36.60–38.24) (38.25–38.44) Temperature 17.99 ± 0.58 15.69 ± 0.88 14.17 ±1.30 (°C) (16.17–18.97) (13.34–17.76) (13.17–17.07) NO3+NO2(µM) 1.82 ± 2.16 0.34 ± 0.18 1.06 ± 0.82 (0.11–9.12) (0.13–1.42) (0.10–3.11) PO4(µM) 0.13 ± 0.09 0.04 ± 0.05 0.021± 0.29
(und –0.42) (und –0.35) (und –0.12)
Autotrophs Chlorophyll a 4.93 ± 3.26 1.08 ± 0.67 0.55 ± 0.39 (µg l–1) (0.21–15.46) (0.26–4.08) (0.18–2.82) Synechoccocus spp. 19.35 ± 5.9 31.74 ± 9.83 40.06 ± 30.50 (103ml–1) (3.49–38.23) (3.84–52.20) (2.27–214.42) Prochlorococcus spp. Absent 0.48 ± 0.13 0.68 ± 0.52 (103ml–1) (0.29–0.81) (0.19–3.38) Pico-eukaryotes 1.06 ±1.84 0.31± 0.25 0.46 ± 0.55 (103ml–1) (0.14–9.16) (0.04–1.58) (0.02–1.76) PNAN () 10.96 ± 7.24 2.47 ±1.38 3.42 ±1.71 (103ml–1) (0.06–29.23) (0.59–13.50) (0.53–8.16) Heterotrophs Het. bacteria 11.54 ± 2.80 9.95 ± 2.80 10.11± 3.00 (105ml–1) (5.21–17.12) (2.48–17.50) (4.45–17.25) BP (ng C l–1h–1) 300 ±103 158 ± 54 76 ± 32 (46–654) (44–446) (23–153) HNF(103 ml–1) 1.29 ± 0.80 1.28 ± 0.55 1.39 ± 0.86 (0.22–2.61) (0.46–2.66) (0.18–2.73)
Table 2. Physicochemial and biological parameters (mean ± SD, min–max), in low salinity waters (LSW, both plume and diluted) and marine waters (MW). The separation of the 3 wa-ter types is based on salinity data. PNAN: phototrophic nanoflagellates, BP: bacterial production, HNF: heterotrophic
Abundance and biomass of heterotrophic bacteria, HNF and ciliates: relations to bacterial production The mean abundance and the range of heterotrophic bacteria and HNF were similar in the plume, diluted and MW. In contrast, bacterial production was on average about 2- and 4-fold higher in the diluted and plume waters, respectively, compared to the marine samples (Table 2, Fig. 2). The majority of HNF were small, (70 to > 80% of the population < 5 µm) and did not appear to follow any clear abundance or biomass pattern. We examined the functional relationship between HNF and bacteria by plotting log-log values of bacterial versus HNF abundance (Fig. 3) following the model of Gasol (1994). The resulting plot of log HNF abundance (HNF, cells ml–1) and log bacterial
abundance (ml–1) seems to suggest that HNF were
always well below the carrying capacity of the system (Gasol 1994), and that they were bottom-up and/or top-down controlled without any clear differentiation according to the water type (Fig. 3).
Ciliate abundance and biomass
The ciliate community structure was similar in both the LSW and the MW, and was characterised by the dominance, both in number and biomass, of
mixo-trophs (Laboea strobila, Tontonia spp. and Strombi-dium conicum), Mesodinium rubrum, (Myrionecta rubra), and Myrionecta sp. traditionally reported as
only being autotrophic, but now identified as also
0 20 40 60 80 0 10 20 30 40 50 0 5 10 15 20 0 10 20 30 40 50 0 5 10 15 0 10 20 30 40 50 8 0 2 4 6 0 10 20 30 40 50 0 10 20 30 40 50 13 14 15 16 17 0 10 20 30 40 50 34 35 36 37 38 39 50 60 Mixo ciliate + M. rubra (µg C l–1) 50 60 Hetero ciliate (µg C l–1) 50 60 HNF (µg C l–1) 50 60 Chl a (µg l–1) Salinity Temp (°C) Stn 1, MW Stn 26, LSW (1st deployment) 50 60 50 60
Fig. 2. Typical vertical distribution of salinity, temperature, chlorophyll a concentration, heterotrophic flagellates (HNF),
hetero-trophic (hetero) ciliates and mixohetero-trophic (mixo) ciliates + Myrionecta rubra for the marine water (MW) Stn S001 (closed symbols)
and the low salinity water (LSW) Stn S026 (open symbols) (cf. Fig.1, Table 1)
2.5 3 3.5 MAA MRA marine Marine Plume Diluted 2 5 5.5 6 6.5
log bacterial abundance (cells ml–1)
log HNF abundance (cells ml
–1
)
Fig. 3. Relationship between log heterotrophic nanoflagel-lates abundance (HNF) and log bacterial prey. The solid line and dashed line represent the maximum attainable abun-dance (MAA) and mean realised abunabun-dance (MRA) for marine environments, following Gasol (1994). HNF abun-dances fall below the MAA and no differentiation between bottom-up or top-down control can be made among the
being occasionally mixotrophic (Gustafson et al. 2000, Yih et al. 2004, Myung et al. 2006). For easier interpre-tation of the figures we included chlorophyll contain-ing ciliates (mixotrophs + M. rubra) in Fig. 2 but we
also give their abundance and biomass separately (Table 3). Among heterotrophic aloricate ciliates,
Lohmaniella ovalis, S. sphaericum, S. compressum, S. crassum, S. spiralis, Strombidium spp. and
scuticocili-ates were present in all samples, usually in low num-bers and biomass. Tintinnids of the genera Eutintin-nus, Amphorella and Tintinnopsis were present in
marine water in low numbers and accounted for 1 to 16% (mean 9%) of the biomass. Tintinnids were only sporadically present in the LSW samples, where they represented 0 to 14% of the biomass (mean 1%).
Comparing the diluted and plume waters to the MW, the mean abundance of total ciliates was about 3- to 4-fold higher in the diluted and plume waters relative to MW (Table 3). It is worth noting that this difference was due to the mixotrophic ciliates, which were about 4- to 5-fold more important in the LSW, while heterotrophic cil-iates only increased by a maximum of 2-fold. Myrionecta rubra was the most abundant species, reaching 4600
cells l–1in the plume (S139: 5 m), while Laboea strobila
was dominant in terms of biomass, accounting for 47% of total biomass in the LSW (Table 3). Log-transformed data of ciliate abundance and chl a concentration indicated
significant relationships for both heterotrophic and mixo-trophic ciliates. The y-intercept for mixotrophs was
slightly higher than that estimated for the heterotrophs (Fig. 4) but there was no difference between the slopes (t = 0.009, t(0.05, 70)= 1.994 tested according to Zahr 1984).
Langrangian sampling of heterotrophic protists The Langrangian sampling of heterotrophic protists was performed at 5 m depth. At this depth, which was close to the interface between plume and diluted water, salinity showed marked variability from 33.46 to 37.79 (Fig. 5a,b). The lower salinity waters were
gener-ally richer in chl a and phototrophic nanoflagellates
(PNAN, Fig. 5 a,b,e,f), with significant negative corre-lations between concentrations and salinity (r = –0.59, r = –0.63 respectively, n = 45, p < 0.0001). Bacterial, HNF and ciliate abundance estimates were highly variable; this sometimes coincided with important shifts in salinity — e.g. the highest ciliate numbers dur-ing the 2nd deployment were at 72 h, when salinity decreased significantly (Fig. 5 c–f). However, abun-dance estimates were not generally correlated with salinity at the 5 m depth. The coefficient of variation of the 5 m data was larger for chl a and PNAN, at 60 and
70%, respectively, than estimates describing the het-erotrophs, which were ~55% for ciliates, 48% for HNF and only 22% for bacteria.
Ciliate ingestion of pico- and nano-algae Fluorescently labelled prey uptake experiments per-mitted the determination of the feeding characteristics of different ciliates separately. Because the samples taken contained quite large numbers of recognisable ciliates,
Total Total Heterotroph Heterotroph Mixotrophs Mixotrophs L. strobila L. strobila M. rubra M. rubra
abundance biomass (% abund) (% biomass) incl. M. rubra incl. M. rubra (102l–1) (% biomass) (102 l–1) (% biomass)
(102 l–1) (µg l–1) (% abund) (% biomass) Plume 37.3 ± 27.7 23 ± 22 29 ±15 30 ±16 71±15 70 ±16 9.6 ± 20.1 38 ± 23 13.5 ±10.5 22 ±13 9–120 02.04.1999 0.2–85 0.4–41 Diluted 28.3 ±16.4 21±14 28 ±14 22 ±13 72 ±14 78 ±13 8.7 ±10.6 47 ± 24 10 ±10 24 ± 23 Jun.80 03.07.1984 0–61 0–46 Marine 10.3 ± 7.3 5.7 ± 4.7 46 ±18 40 ± 25 54 ±19 60 ± 25 1.0 ±1.8 28 ± 29 2.6 ± 5.1 16 ± 25 Mär.29 0.8 – 17 0–7 0–19
Table 3. Ciliate abundance and biomass (mean ± SD, min–max), in low salinity waters (LSW, both plume and diluted) and marine waters (MW). The separation of the 3 water types is based on salinity data (see Table 2). Abund: abundance; Myrionecta rubra; Laboea strobila
2.5 3 3.5 y = 0.58x + 3.10 R2 = 0.311 mixotrophs y = 0.45x + 2.70 R2 = 0.241 heterotrophs 4 1.5 2 –1 –0.5 0 0.5 1 1.5 log chl a concentration (µg l–1)
log ciliate abundance (cell l
–1
)
Heterotrophs Mixotrophs
Fig. 4. Relation between log chlorophyll a concentration
and log ciliate abundance. Solid and dashed lines represent the linear regressions for heterotrophs and mixotrophs,
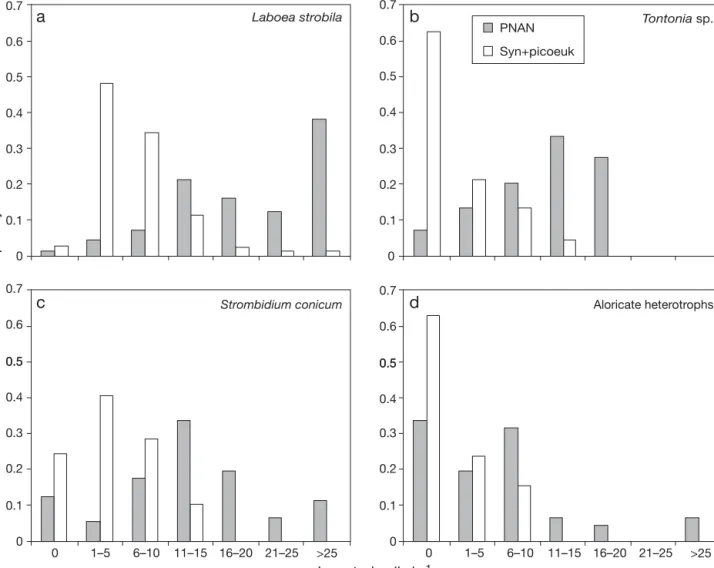
we were able to estimate ingestion rates and the distrib-ution of ingested prey for the individual species Laboea strobila, Tontonia spp. and Strombidium conicum, while
the aloricate heterotrophs, which were less abundant, were considered as 1 group (Fig. 6). It should be noted that Myrionecta rubra was not observed ingesting any of
the prey it was offered, and as a result we were unable to evaluate whether it showed grazing activity or not.
The frequency distribution of ingested prey per cili-ate cell varied between different species/groups and prey offered. Overall, all ciliates seemed to prefer FLA
over FLO of smaller size, and also mixotrophs showed higher ingestion rates than heterotrophs (Fig. 6). Based on size, we employed FLO as analogues for Synecho-coccus spp. and picoeukaryotes, while FLA were
ana-logues of the smaller PNAN cells (see ‘Materials and methods’). We found that Labeoa strobila was the most
important grazer (Fig. 6). The other mixotrophic spe-cies studied showed lower rates of prey uptake. Most of the aloricate heterotrophs present in the samples showed moderate uptake of FLA (Fig. 6, Table 4). Based on FLA uptake, the mean ingestion rate of L.
Salinity 0 2 4 6 8 10 33 34 35 36 37 38 0 1 2 3 4 5 33 34 35 36 37 38 Chlorophyll a Salinity
a
b
0.0 0.5 1.0 1.5 2.0 2.5 3.0 Bacteria HNF 0.0 0.5 1.0 1.5 2.0 2.5 3.0c
d
PNAN (10 3 ml –1) ciliates (10 3 l –1 ) B act (10 6 ml –1 ). HNF (10 3 ml –1 ) C hl a (µg l –1 ) 0 5 10 15 20 25 0 12 24 36 48 60 72 84 96 108 PNAN Ciliates 0 2 4 6 8 10 0 6 12 18 24 30 36 42 48 54 60 66 72e
f
0.0 Hours 0.0 HoursFig. 5. Chlorophyll a (chl a), salinity, heterotrophic nanoflagellates (HNF), bacteria (bact), total ciliates and photototrophic
strobila, Tontonia spp., Strombidium conicum, and
aloricate heterotrophs was 26, 15, 14 and 8 PNAN h–1,
respectively. Based on these ingestion rates and the number of similar size PNAN measured by flow cytom-etry, ciliates ingested 7 and 12% in the MW and about 60% of the PNAN stock in the LSW (Table 4). In
con-trast, the impact of ciliate ingestion on the Synechococ-cus spp. and picoeukaryote stock, calculated from the
ingestion rate of FLO, was very low as it represented only from 0.03 to 4.77% (mean ± SD: 0.77 ± 0.76) of the stock of Synechococcus spp. + picoeukaryotes, pooling
all the experiments.
% PNAN d–1
Total ciliates (mean ± SD) Mixotrophs Heterotrophs (105ciliate body volume h–1)
Plume (n = 5) 64 ± 5 50 14 50 Diluted (n = 5) 56 ± 6 44 12 54 Stn 1, MW (n = 1) 12 ± 4 6 6 26 Stn 220, MW (n = 1) 7 ± 2 4 3 12
Table 4. Consumption parameters of ciliates: % of the PNAN stock grazed per day by total ciliates, mixotrophs and heterotrophs, based on FLA uptake. For comparison, PNAN consumption based on potential clearance rate of 105body volumes h–1(Fenchel
1980; Jonsson 1986) is also presented. n: number of measurements; MW: marine water; PNAN: phototrophic nanoflagellates PNAN Syn+picoeuk 0.5 0.6 0.7 Strombidium conicum Relative fr equency 0.5 0.6 0.7 Aloricate heterotrophs 0 0.1 0.2 0.3 0.4 0.5 0.6 0.7 Laboea strobila 0 0.1 0.2 0.3 0.4 0.5 0.6 0.7 Tontonia sp. 0 0.1 0.2 0.3 0.4 0.5 0 1–5 6–10 11–15 16–20 21–25 >25 0 1–5 6–10 11–15 16–20 21–25 >25 Ingested cells h–1 0 0.1 0.2 0.3 0.4 0.5
a
b
c
d
Fig. 6. Frequency distribution of ingested prey in (a) Labeoa strobila, (b) Tontonia sp., (c) S. conicum and (d) aloricate heterotrophs.
Photototrophic nanoflagellates (PNAN) is based on fluorescently labelled algae (FLA) (4–5 µm) ingestion and Synechococcus spp.
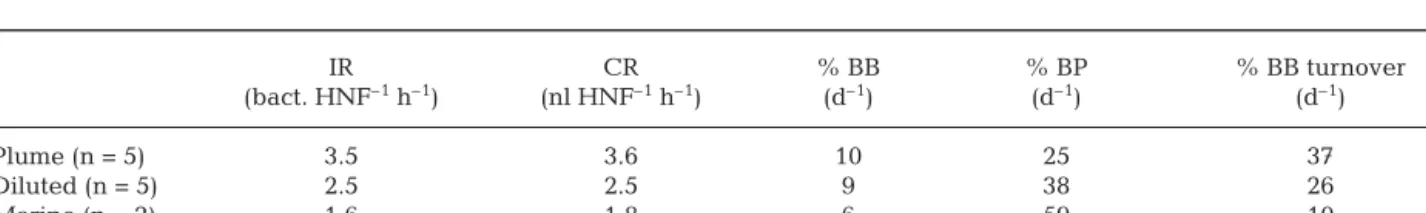
Bacterial ingestion by heterotrophic nanoflagellates Bacterial ingestion by HNF based on FLB uptake showed differences between marine and the LSW waters (Table 5). The ingestion and clearance rates were higher in the LSW than in MW. Reasoning in terms of bacterial stock, the turnover of bacterial stock was about 3-fold higher in the LSW than in the MW (Table 5). However, the bacteria present in the LSW were far more active than those in the MW so that for relatively similar numbers of bacteria much higher BP was measured in the LSW (Table 2). Thus, if we con-sider the impact of HNF grazing relative to bacterial production, a higher % of BP was consumed in MW, suggesting that the pathway of bacterial carbon trans-fer to higher trophic levels via HNF was more impor-tant in those waters (Table 5). The ingestion of FLO was very low and ranged between 0 and 0.2 FLO HNF–1h–1. For this reason these results have not been
further analysed.
DISCUSSION
Abundance and biomass of heterotrophic nanofla-gellates and relationships to bacterial production In contrast to the basic parameters such as chl a and
ciliate abundance, the mean bacterial and HNF abun-dance and biomass were quite similar in all 3 water types examined during the study. The relative stability of bacterial numbers in the LSW and MW indicates that bacterial production was tightly matched by bac-terial mortality. The fate of bacteria — whether they are ingested by protists or lysed by viruses — is rele-vant to how much of the bacterial carbon is made avail-able for higher trophic levels through grazing, or is mineralised within the microbial food web. Our rate estimates suggest that although HNF ingested more bacteria per hour in the LSW, they consumed < 30% of BP d–1, while they consumed almost 60% of BP in MW
(Table 5). We are quite confident about the CFs used in this study. Bacterial carbon content was determined by
biovolume measurements and for leucine incorpora-tion we employed an CF previously determined for NW Mediterranean coastal waters (Gasol et al. 1998, Pedròs-Aliò et al. 1999). CFs for open waters tend to be lower (Pedrós-Alió et al. 1999, 0.34 kg C mol–1); there-fore, if we had used open water CFs here for MW, the effect of HNF on BP would have been greater, result-ing in consumption rates >100%.
Rates of bacterial consumption that are relatively low, compared to rates of bacterial production, have been reported from a variety of chl a rich waters (e.g.
Wieltschnig et al. 1999, Christaki et al. 2008). In the present study, a higher ratio of virus-like particles to bacteria was found in the LSW compared to MW (F. Joux unpubl. data), suggesting that in the LSW viral lysis could be a significant control mechanism of bacte-rial biomass production, a possibility which deserves further attention.
Abundance and biomass of ciliates
We found that, while the composition of the ciliate community did not differ between the LSW and the MW, the LSW was characterised by higher abundance and dominance by mixotrophs. Furthermore, these mixotrophs had high ingestion rates on nanophyto-plankton. During the second deployment, the abun-dance of ciliates at 5 m depth showed important fluctu-ations (Fig. 5) which may not only be related to salinity variations at the interface between plume and diluted water, but may also indicate a tendency towards patchy distribution of these organisms (Crawford & Lindholm 1997). The taxonomic composition of the cil-iate community was dominated by naked oligotrichs (Strombidium spp., Labeoa strobila, Tontonia spp.) and
the haptorid Myrionecta rubra. High percentages of
mixotrophs within the ciliate community are common, and have been previously reported in a variety of ner-itic waters (e.g. Stoecker et al. 1987, 1989, Sanders 1995, Crawford & Lindholm 1997, Modigh 2001). In particular, the dominant species found in the present study, L. strobila and M. rubra, are euryaline (3 to
IR CR % BB % BP % BB turnover (bact. HNF–1h–1) (nl HNF–1h–1) (d–1) (d–1) (d–1)
Plume (n = 5) 3.5 3.6 10 25 37 Diluted (n = 5) 2.5 2.5 9 38 26 Marine (n = 2) 1.6 1.8 6 59 10
Table 5. Consumption parameters of heterotrophic flagellates (HNF): mean values of ingestion rates (IR), clearance rates (CR), % of bacterial stock (BB), bacterial production (BP) consumed per day and % bacterial biomass turnover. Calculations of % BP con-sumed and biomass turnover were calculated with a conversion factor of 16 fg C bact.–1(see ‘Materials and methods’). n = number
40°C) and eurythermic (0 to 24°C) organisms known to occur in high numbers and biomass in coastal waters (McManus & Fuhrman 1986, Stoecker al. 1987, Sanders 1995, Modigh 2001). These ciliates are both producers and consumers, and models of marine food webs suggest that mixotrophy results in increased trophic efficiency in the sea (Stickney et al. 2000).
During the present study, abundance of ciliates in the LSW was of the order of 103 to 104l–1 and had a
mean biomass of 20 µg C l–1(Table 3). Relative to the
concentrations of total ciliates, the peak concentrations of Myrionecta rubra in the LSW (4.6 × 10³ cells l–1,
Table 3) were high. However, the concentrations were about 1 order of magnitude less than peak concentra-tions reported from a variety of systems, usually under stratified conditions. For example, Modigh reported abundances in the Gulf of Trieste of up to 49 × 103cells
l–1 (Modigh 2001), and in an estuary of the Gulf of
Maine up to 37 × 103 cells l–1 were found (Sanders
1995). In contrast, Laboea strobila was much more
abundant in our samples (up to 8.5 × 10³cells l–1)
rela-tive to previous studies (up to 775 cells l–1 and ≈1.5 ×
103 cells l–1 in Sanders 1995, Modigh 2001,
respec-tively). However, Dutz & Peters (2008) reported that in the North Sea, L. strobila dominated the ciliate
com-munity and had an average biomass of 48.3 µg C l–1,
which is about 4 times the biomass found in our sam-ples (Table 3).
Ciliated ingestion of pico- and nano-algae Among the various methods applied to measure pro-tistan grazing (e.g. dilution experiments, disappear-ance of prey), the direct examination of FLP inside digestive vacuoles has the advantage of illustrating the identities of the grazers and their individual contribu-tions to the overall grazing rate. As with all grazing detection methods, the use of fluorescent particles has its known limitations, including the possible underesti-mation of grazing rates due to negative selection of prey. FLP techniques have been widely discussed in previous studies (e.g. Vazquez-Dominguez et al. 1999, Vaqué et al. 2002). Aside from these methodological limitations, our results substantiate the clear pattern observed between marine and low salinity waters with higher grazing rates due to mixotrophic ciliates, in par-ticular Laboea strobila (Fig. 6, Table 4). Another
impor-tant observation concerns the abundance of Myri-onecta rubra, which did not ingest either prey offered. M. rubra can function phototrophically for extended
periods without ingesting prey, but feeding is periodi-cally required for optimal growth and photosynthesis, especially in high light levels (Johnson & Stoecker 2005). Yih et al. (2004) showed that M. rubra can
become an important grazer of cryptophytes after star-vation. Consequently, the non-uptake of prey in our experiments by M. rubra can be explained by a
domi-nance of phototrophic function during the sampling period, but one can also assume that this organism is very discriminating in its feeding, and consequently, did not select the prey used in this experiment.
In the open N Atlantic, it has been shown that cili-ates, in particular Tintinnids, are capable of ingesting fluorescently labelled Synechococcus (≈1 µm) at high
rates during the winter (Karayanni et al. 2005). To cover a larger size range of prey, we included Ostreo-coccus tauri in our experiments to simulate grazing on
autotrophic picoeukaryotes which can be very abun-dant in coastal environments (e.g. Iriarte & Purdie 1994); ciliates showed very low ingestion on pico-plankton analogues. It is probable that mixotrophic cil-iates were preferentially ingesting nano-sized prey; however the low ingestion by aloricate heterotrophs may represent a selection against FLO.
As a consequence of their high concentration (103to
104cell ml–1), PNAN may be an abundant food source
for ciliates in the diluted and plume waters. The ciliate –chl a relationship indicates a coupling with the
phyto-plankton stock (Fig. 4). The ratio of ciliate carbon to chl
a in open MW has been reported to range from 2 to 5
(Dolan & Marasé 1995, Dolan et al. 1999). Claessens et al. (2008) have recently reported values from 2 to 26 in the oligotrophic Red Sea. According to these authors, the higher this ratio, the higher the efficiency of ciliates in using algae as a food source. We applied this approach to the present data and compared it with the trends we found using our grazing measurements. Throughout the duration of the present study, the cili-ate carbon:chl a ratio showed great variability (from 2
to > 50), with mean values of 5, 21 and 10 for plume, diluted and MW, respectively. This hierarchy of values is in accordance with our grazing measurements on PNAN for marine and diluted waters (Table 4), but not for plume waters, where very high values of chl a were
occasionally recorded. As reported by Diaz et al. (2008) on the ‘ecological maturity’ of the Rhone River plume or by Dagg et al. (2004) on the Mississippi River, this could be related to a shorter residence time for plume water, where ciliate growth is not yet at its maximum, compared to diluted water which has a higher resi-dence time.
We made an additional comparison to evaluate our estimates of grazing rates by calculating a theoretical grazing rate of ciliates feeding on PNAN based on ciliate biovolume measurements — with a clearance rate of 105 body volumes h–1 (Fenchel 1980, Jonsson
1986). In the case of plume and diluted waters, the result obtained with this semi-theoretical approach was close to that measured by FLA uptake in the
LSW, whereas it was 2-fold higher for MW (Table 4). In conclusion, even though the percent of consump-tion measured by the FLA may have been subject to some inaccuracies, the bulk of the evidence supports the observation that ciliates, and in particular mixotrophs, were very active in the LSW where they grazed on phytoplankton at near their maximum clearance capacities (Table 4). Ciliates in the LSW, by repackaging the small algal prey into accessible par-ticles, are an important intermediate link to higher trophic levels.
Besides phytoplankton, ciliates can use other het-erotrophs such as HNF and heterotrophic bacteria as alternative food sources (e.g. Karayanni et al. 2008 and references therein). From a methodological point of view, direct measurement of HNF uptake can be very complex. The HNF-bacteria log-log relationship does not show any trend of prevailing top-down control on HNF in the LSW where ciliates are very abundant (Fig. 3). Our suggestion is that mixotrophs, which dom-inated the ciliate population, may discriminate against HNF in favour of chloroplast-containing prey. Our data suggest that during the present study the overall graz-ing pressure on HNF and heterotrophic bacteria by ciliates was moderate.
Our results describing the community structure and the trophic role of nano- and microzooplankton in the diluted mesoscale structures of the Rhone River pro-vide a number of new insights into the functioning of coastal ecosystems enriched by riverine input. We have shown in the present study that the microbial food web, and in particular mixotrophs, represents an important link from photosynthetically-fixed carbon transfer to higher trophic levels in this ecosystem. Microzooplankton are also important contributors to the diet of mesozooplankton (e.g. Christaki & Van Wambeke 1995), and it has been shown recently that large ciliates, in particular Laboea strobila, are an
excellent food source for the reproduction of the cope-pod Acartia clausi in the North Sea (Dutz & Peters
2008). During the BIOPHOFI cruise, the abundance and biomass of copepods was several fold higher in the LSW (D. Bonnet, unpubl. data). Further investigation in this system should focus on the transfer of ciliate bio-mass to copepods and/or directly to fish; such informa-tion could then be considered in fisheries predictive models.
Acknowledgements: This study was supported by the French
Programme National d’Environnement Côtier (PNEC) — Chantier Méditerranée of the Institut National des Sciences de l’Univers (INSU). This work was also funded through a National Science Foundation Office of International Science and Engineering US-France Cooperative Science Program grant 0340764 to W.H.J. We thank the crew of the R.V. ‘Le Suroît’, from IFREMER, for making the cruise so successful.
We thank N. Batailler and L. Oriol for microscopic determina-tion of bacterial biovolume and nutrient analysis, respec-tively. We thank the reviewers for their constructive com-ments and P. Magee for correcting the language. As this special issue is dedicated to F. Rassoulzadegan, it is particu-larly rewarding that our paper has highlighted the fact that ciliates, in particular mixotrophs, can be an important link in food web transfer.
LITERATURE CITED
Balech E (1959) Tintinnoinea del Mediterraneo. Trabajos del Instituto Espanol de Oceanografia, Madrid, No 28 Bernard C, Rassoulzadegan F (1994) Seasonal variations of
mixotrophic ciliates in the northwest Mediterranean Sea. Mar Ecol Prog Ser 108:295–301
Børsheim KY, Bratbak G (1987) Cell volume to cell carbon conversion factors for a bacterivorous Monas sp. enriched
from sea water. Mar Ecol Prog Ser 36:171–179
Bosc E (2002) Variations saisonnières et interannuelles de la biomasse phytoplanctonique et de la production primaire en Méditerranée: évaluation et utilisation des données satellitales de couleur de l’Océan. PhD thesis, Université de Toulon et du Var, Toulon
Calbet A, Saiz E (2005) The ciliate-copepod link in marine ecosystems. Aquat Microb Ecol 38:157–167
Christaki U, Van Wambeke F (1995) Simulated phytoplankton bloom input in top-down manipulated microcosms: com-parative effect of zooflagellates, ciliates and copepods. Aquat Microb Ecol 9:137–147
Christaki U, Giannakourou A, Van Wambeke F, Gregori G (2001) Nanoflagellate predation on auto and heterotrophic picoplankton in the oligotrophic Mediterranean Sea. J Plankton Res 23:1297–1310
Christaki U, Obernosterer I, Van Wambeke F, Veldhuis M, Garcia N, Catala P (2008) Microbial food web structure in a naturally iron fertilized area in the Southern Ocean (Ker-guelen Plateau). Deep-Sea Res II 55:706–719
Claessens M, Wickham SA, Post AF, Reuter M (2008) Ciliate community in the oligotrophic Gulf of Aqaba, Red Sea. Aquat Microb Ecol 53:181–190
Cottrell MT, Kirchman DL (2003) Contribution of major bacte-rial groups to bactebacte-rial biomass production (thymidine and leucine incorporation) in the Delaware Estuary. Limnol Oceanogr 48:168–178
Courties C, Vaquer A, Troussellier M, Lautier J and others (1994) Smallest eucaryotic organism. Nature 370:255 Crawford DW, Lindholm T (1997) Some observations on
verti-cal distribution and migration of the phototrophic ciliate
Mesodinium rubrum (= Myrionecta rubra) in a stratified
brackish inlet. Aquat Microb Ecol 13:267–274
Dagg M, Benner R, Lohrenz S, Lawrence D (2004) Transfor-mation of dissolved and particulate materials on continen-tal shelves influenced by large rivers: plume processes. Cont Shelf Res 24:833–858
Diaz F, Naudin JJ, Courties C, Rimmelin P, Oriol L (2008) Bio-geochemical and ecological functioning of the low-salinity water lenses in the region of the Rhone River freshwater influence, NW Mediterranean Sea. Cont Shelf Res 28:1511–1526
Dolan JR, Marrasé C (1995) Planktonic ciliate distribution relative to a deep chlorophyll maximum: Catalan Sea, N.W. Mediterranean, June 1993. Deep-Sea Res I 42: 1965–1987
Dolan JR, Pérez MT (2000) Costs and benefits of mixotrophy: the case of marine oligotrichs. Freshw Biol 45:227–238
➤
➤
➤
➤
➤
➤
➤
➤
➤
➤
➤
➤
➤
Dolan JR, Vidussi F, Claustre H (1999) Planktonic ciliates in the Mediterranean Sea: longitudinal trends. Deep-Sea Res I 46:2025–2039
Dutz J, Peters J (2008) Importance and nutritional value of large ciliates for the reproduction of Acartia clausi during
the post spring-bloom period in the North Sea. Aquat Microb Ecol 50:261–277
Fenchel T (1980) Relation between particle size selection and clearance in suspension-feeding ciliates. Limnol Oceanogr 25:733–738
Gasol JM (1994) A framework for the assessment of top-down vs bottom-up control of heterotrophic nanoflagellate abundance. Mar Ecol Prog Ser 113:291–300
Gasol JM, Doval MD, Pinhassi J, Calderón-Paz JI, Guixa-Boixareu N, Vaqué D, Predró-Alió C (1998) Diel variations in bacterial heterotrophic activity and growth in the northwest-ern Mediterranean Sea. Mar Ecol Prog Ser 164:107–124 Gustafson DE, Stoecker DK, Johnson MD, Van Heukelem
WF, Sneider K (2000) Cryptophyte algae are robbed of their organelles by the marine ciliate Mesodinium rubrum. Nature 405:1049–1052
Iriarte A, Purdie DA (1994) Size distribution of chlorophyll a
biomass and primary production in a temperate estuary (Southampton Water): the contribution of photosynthetic picoplankton. Mar Ecol Prog Ser 115:283–297
Johnson MD, Stoecker DK (2005) Role of feeding in growth and photophysiology of Myrionecta rubra. Aquat Microb
Ecol 39:303–312
Jonsson PR (1986) Particle size selection, feeding rates and growth dynamics of marine planktonic oligotrichous cili-ates (Ciliophora: Oligotrichina). Mar Ecol Prog Ser 33: 265–277
Joux F, Servais P, Naudin JJ, Lebaron P, Oriol L, Courties C (2005) Distribution of picophytoplankton and bacterio-plankton along a river plume gradient in the Mediter-ranean Sea. Vie Milieu 55:197–208
Joux F, Jeffrey WH, Abboudi M, Pujo-Pay M, Oriol L, Neveux J, Naudin JJ (2009) Ultraviolet radiation in the Rhone lenses of low salinity and marine waters of the northwest-ern Mediterranean Sea: attenuation and effects on bacter-ial production and net community production. Photochem Photobiol 85:783–793
Karayanni H, Christaki U, Van Wambeke F, Denis M, Moutin T (2005) Influence of ciliated protozoa and heterotrophic nanoflagellates on the fate of primary production in the northeast Atlantic Ocean. J Geophys Res 110:C07S15. doi:10.1029/2004JC002602
Karayanni H, Christaki U, Van Wambeke F, Thyssen M, Denis M (2008) Heterotrophic nanoflagellate and ciliate bac-terivorous activity and growth in the northeast Atlantic Ocean: a seasonal mesoscale study. Aquat Microb Ecol 51: 169–181
Kirchman DL (2001) Measuring bacterial biomass production and growth rates from leucine incorporation in natural aquatic environments. In: Paul JH (Ed.) Marine Microbiol-ogy. Academic Press, San Diego, CA, p. 227–237
Laval-Peuto M, Rassoulzadegan F (1988) Autofluorescence of marine planktonic Oligotrichina and other ciliates. Hydro-biologia 159:99–110
Lee S, Fuhrman JA (1987) Relationships between biovolume and biomass of naturally derived marine bacterioplank-ton. Appl Environ Microbiol 53:1298–1303
Lefèvre D, Minas HJ, Minas M, Robinson C, Le B, Williams PJ, Woodward EMS (1997) Review of gross community production, primary production, net community produc-tion and dark community respiraproduc-tion in the Gulf of Lions. Deep-Sea Res II 44:801–832
Maar M, Nielsen TG, Richardson K, Christaki U, Hansen OS, Zervoudaki S, Christou ED (2002) Spatial and temporal variability of food web structure during the spring bloom in the Skagerrak. Mar Ecol Prog Ser 239:11–29
Maeda M (1986) An illustrated guide to the species of the families Halteriidae and Strobilidiidae (Oligotrichida, Cil-iophora), free swimming protozoa common in the aquatic environment. Bull Ocean Res Inst Univ Tokyo, Vol 21. Uni-versity of Tokyo
Maeda M, Carey PG (1985) An illustrated guide to the species of the family Strombidiidae (Oligotrichida, Ciliophora), free swimming protozoa common in the aquatic environ-ment. Bull Ocean Res Inst Univ Tokyo Vol. 19 University of Tokyo
McManus GB, Fuhrman JA (1986) Photosynthetic pigments in the ciliate Laboea strobila from Long Island Sound, USA. J
Plankton Res 8:317–327
Modigh M (2001) Seasonal variations of photosynthetic cili-ates at a Mediterranean coastal site. Aquat Microb Ecol 23:163–175
Myung G, Yih W, Kim HS, Park JS, Cho BC (2006) Ingestion of bacterial cells by the marine photosynthetic ciliate
Myrionecta rubra. Aquat Microb Ecol 44:175–180
Naudin JJ, Cauwet G, Chrétiennot-Dinet MJ, Deniaux B, Dévenon JL, Pauc H (1997) River discharges and wind influence upon particulate transfer at the land-ocean interaction: case study of the Rhone River plume. Estuar Coast Shelf Sci 45:303–316
Naudin JJ, Cauwet G, Fajon C, Oriol L, Terzic S, Devenon JL, Broche P (2001) Effect of mixing on microbial communities in the Rhone River plume. J Mar Syst 28:203–227 Neveux J, Lantoine F (1993) Spectrofluorometric assay of
chlorophylls and phaeopigments using the least square approximation technique. Deep-Sea Res I 40:1747–1765 Palomera I (1992) Spawning of anchovy Engraulis
enrasico-lus, in the North-Western Mediterranean relative to
hydrographic features in the region. Mar Ecol Prog Ser 79:37–44
Pedrós-Alió C, Calderon-Paz JI, Guixa-Boixereu N, Estrada M, Gasol JM (1999) Bacterioplankton and phytoplankton biomass and production during summer stratification in the northwestern Mediterranean Sea. Deep-Sea Res I 46:985–1019
Porter KG, Feig YS (1980) The use of DAPI for identifying and counting aquatic microflora. Limnol Oceanogr 25: 943–948
Pujo-Pay M, Conan P, Joux F, Oriol L, Naudin JJ, Cauwet G (2006) Impact of phytoplankton and bacterial production on nutrient and DOM uptake in the Rhone River plume (NW Mediterranean). Mar Ecol Prog Ser 315:43–54 Putt M, Stoecker DK (1989) An experimentally determined
carbon: volume ratio for marine ‘oligotrichous’ ciliates from estuarine and coastal waters. Limnol Oceanogr 34: 1097–1103
Rublee PA, Gallegos CL (1989) Use of fluorescently labelled algae (FLA) to estimate microzooplankton grazing. Mar Ecol Prog Ser 51:221–227
Sabatés I, Salat J, Olivar PM (2001) Advection of continental water as an export mechanisms for anchovy, Engraulis encrasicolus, larvae. Sci Mar 65:77–88
Salat J (1996) Review of hydrographic environmental factors that may influence anchovy habitats in Northwestern Mediterranean. Sci Mar 60:21–32
Sanders RW (1995) Seasonal distributions of the photosyn-thetic ciliates Laboea strobila and Myrionecta rubra (= Mesodinium rubrum) in an estuary of the Gulf of Maine.
Aquat Microb Ecol 9:237–242
➤
➤
➤
➤
➤
➤
➤
➤
➤
➤
➤
➤
➤
➤
➤
➤
➤
➤
➤➤
➤
➤
➤
➤
➤
➤
Sherr BF, Sherr EB, Fallon RD (1987) Use of monodispersed, fluorescently labeled bacteria to estimate in situ protozoan bacterivory. Appl Environ Microbiol 53:958–965
Sime-Ngando T, Juniper K, Vézina A (1992) Ciliated proto-zoan communities over Cobb Seamount: increase in bio-mass and spatial patchiness. Mar Ecol Prog Ser 89:37–51 2imek K, Hornák K, Masin M, Christaki U, Nedoma J,
Wein-bauer MG, Dolan JR (2003) Comparing the effects of resource enrichment and grazing on a bacterioplankton community of a meso-eutrophic reservoir. Aquat Microb Ecol 31:123–135
Stickney HL, Hood RR, Stoecker DK (2000) The impact of mixotrophy on planktonic marine ecosystems. Ecol Model 125:203–230
Stoecker DK, Michaels AE, Davis LH (1987) Large proportion of marine planktonic ciliates found to contain functional chloroplasts. Nature 326:790–792
Stoecker DK, Taniguchi A, Michaels AE (1989) Abundance of autotrophic, mixotrophic and heterotrophic planktonic cili-ates in shelf and slope waters. Mar Ecol Prog Ser 50:241–254 Tréguer P, Le Corre P (1975) Manuel d’analyse des sels
nutri-tifs dans l’eau de mer, utilisation de l’autoanalyzer II Tech-nicon, 2nd edn. Laboratoire d’océanographie chimique, Université de Bretagne Occidentale, Brest
Tudela S, Palomera I (1997) Trophic ecology of the European anchovy Engraulis encrasicolus in the Catalan Sea
(north-west Mediterranean). Mar Ecol Prog Ser 160:121–134
Vaqué D, Calderón-Paz JI, Guixa-Boixereu N, Pedrós-Alió C (2002) Spatial distribution of microbial biomass and activ-ity (bacterivory and bacterial production) in the northern Weddell Sea during the austral summer (January 1994). Aquat Microb Ecol 29:107–121
Vazquez-Dominguez E, Peters F, Gasol JM, Vaqué D (1999) Measuring the grazing losses of picoplankton: method-ological improvements in the use of fluorescently labeled tracers combined with flow cytometry. Aquat Microb Ecol 20:119–128
Verity PG, Vernet M (1992) Microzooplankton grazing pig-ments and composition of plankton community during late spring in two Norwegian fjords. Sarsia 77:163–174 Wieltschnig C, Wihlidal P, Ulbricht T, Kirschner AKT,
Velimirov B (1999) Low control of bacterial production by heterotrophic nanoflagellates in a eutrophic backwater environment. Aquat Microb Ecol 17:77–89
Yih W, Kim HS, Jeong HJ, Myung G, Kim YG (2004) Ingestion of cryptophyte cells by the marine photosynthetic ciliate
Mesodinium rubrum. Aquat Microb Ecol 36:165–170
Zahr JH (1984) Biostatistical analysis. Prentice Hall, Engle-wood Cliffs, NJ
Zhang W, Xu K, Wan R, Zhang G and others (2002) Spatial distribution of ciliates, copepod nauplii and eggs,
Engraulis japonicus post-larvae and microozoplankton
herbivorous activity in the Yellow Sea, China. Aquat Microb Ecol 27:249–259
Submitted: April 27, 2009; Accepted: June 15, 2009 Proofs received from author(s): November 2, 2009