HAL Id: hal-02345285
https://hal.archives-ouvertes.fr/hal-02345285
Submitted on 20 Nov 2019
HAL is a multi-disciplinary open access
archive for the deposit and dissemination of
sci-entific research documents, whether they are
pub-lished or not. The documents may come from
teaching and research institutions in France or
abroad, or from public or private research centers.
L’archive ouverte pluridisciplinaire HAL, est
destinée au dépôt et à la diffusion de documents
scientifiques de niveau recherche, publiés ou non,
émanant des établissements d’enseignement et de
recherche français ou étrangers, des laboratoires
publics ou privés.
Quantitative Measurements of Composition, Pressure,
and Density of Microvolumes of CO2 –N2 Gas Mixtures
by Raman Spectroscopy
Van-Hoan Le, Marie-Camille Caumon, Alexandre Tarantola, Aurélien Randi,
Pascal Robert, Josef Mullis
To cite this version:
Van-Hoan Le, Marie-Camille Caumon, Alexandre Tarantola, Aurélien Randi, Pascal Robert, et al..
Quantitative Measurements of Composition, Pressure, and Density of Microvolumes of CO2 –N2 Gas
Mixtures by Raman Spectroscopy. Analytical Chemistry, American Chemical Society, 2019, 22 (22),
pp.14359-14367. �10.1021/acs.analchem.9b02803�. �hal-02345285�
Quantitative measurements of composition, pressure and density of
micro-volumes of CO
2
-N
2
gas mixtures by Raman spectroscopy
Van-Hoan Le *
a, Marie-Camille Caumon
a, Alexandre Tarantola
a, Aurélien Randi
a, Pascal Robert
aand
Josef Mullis
ba Université de Lorraine, CNRS, GeoResssources Laboratory, BP 70239, F-54506 Vandoeuvre-lès-Nancy, France b Mineralogisch-Petrographisches Institut, Bernoullistrasse 30, CH-4056 Basel, Switzerland
* Corresponding author: [email protected]
ABSTRACT: Quantitative analysis of gases by Raman spectroscopy is based on relative Raman scattering cross-sections (RRSCS)
and the evolution of different spectral parameters (peak position, peak area, peak intensity, etc.). However, most of the calibration data were established at low pressure (low density) and without evaluating the effect of the composition. Using these data may lead to considerable errors, especially when applied to gas mixtures at high pressure as found in natural fluid inclusions. The aim of this study is to reevaluate the RRSCS of CO2 and to establish new calibration data based on the variation of CO2 Fermi diad splitting as a function of pressure (density) and composition over a pressure range of 5 to 600 bars at 22 and 32 °C. A high-pressure optical cell system (HPOC) and a heating-cooling stage were used for Raman in-situ analyses at controlled PTX conditions. Our experimental results show that the RRSCS of CO2 varies slightly with pressure but can be considered constant over the studied pressure range. It can be used to measure the proportion of CO2 in gas mixtures with an uncertainty of about ± 0.5 mol%. Different polynomial equations were provided to calculate pressure and density of CO2-N2 gas mixtures with an uncertainty of ± 20 bar or 0.01 g.cm−3. A comparison of PVTX properties of natural CO2-N2 fluid inclusions hosted in quartz from the Central Alps (Switzerland) obtained by Raman measurement and as derived from phase transition temperatures by microthermometry experiments shows comparable values.
The exploration of the Raman effect by C.V Raman in 1928 provided a new way for non-destructive analyses of materials under different phase states (solid, liquid and gaseous) to get qualitative and quantitative information (after establishing cali-bration data). The sensitivity of Raman spectroscopy covers a wide concentration range, down to very low concentration,1,2 even to sub-ppm levels3,4. Raman spectroscopy has been widely used for gas analysis in various domains of investigation such as monitoring of polluted air5 or automobile exhaust gases,1 fuel gas analysis,6–8 diagnosis and monitoring of disease states by human breath analysis,3,4,9 controlling and monitoring of fruit ripening,10 analyzing of gas bubbles appearing as defects inside industrial glasses to optimize production process.11 Other appli-cations can also be found in the field of environmental gas sens-ing, e.g. monitoring of geological storage site of CO2,12 investi-gation of biological and/or geochemical gas exchange and mi-gration processes within the different compartment (groundwa-ter, subsurface, surface, atmosphere).13–17 All applications men-tioned above relate exclusively to the analysis of immense and/or small volume of gas at relatively low pressure (< few dozen bars). The present study is dedicated to another case of extreme conditions: the analysis of gas mixtures in micro-vol-umes at relatively high pressure (up to 600 bar). The main ap-plication is the study of fluid inclusions naturally trapped in minerals.
Fluid inclusions (FIs) are small cavities in minerals contain-ing a micro-volume of a geological fluid trapped durcontain-ing or after crystal growth. They are the most reliable relicts recording in-formation about the conditions of crystal in-formation as well as of paleo-fluid circulations. A quantitative knowledge (compo-sition, pressure, and density) of these fluids provides key infor-mation to better understand geological processes, to reconstruct
the conditions of paleo-fluid circulations and thereafter for fur-ther application such as natural resources exploration.18 CO
2 and N2 are among the most common gases present in a large variety of geological fluids.18,19
The observation of phase transitions during microthermome-try experiments is currently the standard method to investigate fluid inclusion properties. However, some limitations appear when FIs are of small size (< 5 µm), of complex composition or of low density without any observable phase transitions.20–24 Raman spectroscopy is a complementary method to microther-mometry as it can offer fast (from a few seconds to a few minutes), high resolution (down to 1 µm2) and simultaneous non-destructive, qualitative and quantitative analyses.25–27 Sev-eral applications of Raman spectroscopy dedicated to the inves-tigation of FIs have been carried out by different research teams since the 1970s (cf. reviews by Burke25 and Frezzotti et al.26). The determination of the composition, pressure, and density of gas mixtures using Raman spectroscopy requires the knowledge of the Raman scattering cross-section (RSCS) and the behavior of Raman spectral features (peak position, peak area/intensity ratio…) as a function of pressure, density, temperature, and composition.25,26
RSCS is a specific parameter related to the probability of Ra-man scattering effect for each vibration. It can be used to deter-mine the concentration of molecules.28 Due to the difficulty of the determination of absolute values of RSCS, only that of N2 was carefully determined by different techniques.29–32 Relative RSCS (RRSCS) values of common gaseous species found in fluid inclusions (CO2, CO, CH2, O2, H2S…) were then measured relatively to RSCS of N2 with an accuracy varying from 5 to 20
%.25,32 However, all published data of RRSCS were determined
Wopenka et Pasteris28 and Seitz et al.33,34 RRSCS may not just vary as a function of wavelength and temperature,32 but also as a function of pressure and composition due to changes in mo-lecular interaction.35 Moreover, although many improvements in Raman instruments were made, the RRSCS data were never reevaluated since the 1970s.
The variations of the peak positions of Raman bands of N2 and CO2 as a function of pressure (or density) were also sepa-rately investigated,20,21,24,36–41 showing the applicability for pres-sure and density monitoring. Indeed, the Fermi diad splitting (distance between the two main peaks) of CO2 was used to de-velop densimeters for pure CO2 or CO2-rich fluid inclu-sions.20,21,24,37,39,40,42,43 Nevertheless, the variation of peak posi-tions as well as of CO2 Fermi diad splitting are subject to changes as a function of pressure, density, temperature39,40 but also composition.33,34,40 The inappropriate use of calibration data obtained from pure gas for analyzing gas mixtures may, therefore, lead to an over/underestimation of density40 or pres-sure.41 Thus, the effect of composition, pressure, density, and temperature on Raman spectral features should be simultane-ously taken into account upon any quantitative analysis. The ex-perimental data of Seitz et al.33,34 revealed the variation trends of different Raman spectral features of CO2 and N2 as a function of composition (when mixed with CH4) but the results were quite scattered due to the use of low spectral resolution ( 5 cm– 1). Consequently, no robust calibration with uncertainty analy-sis was given.
The present work aims (1) to reevaluate the dependence of RRSCS of CO2 on pressure and composition by using nowadays performance instruments and (2) to establish a new Raman cal-ibration methodology for composition, pressure, and density measurement of any CO2-N2 gas mixtures. Data acquisition was done thanks to the combination of an improved HPOC
sys-tem44–46 and a heating-cooling stage to control the PT conditions
during experiments and to collect numerous data points for sta-tistical purposes. CO2-N2 gas mixtures of different composi-tions were analyzed by Raman spectroscopy at 22 °C (room temperature) and 32 °C (just above the critical point of pure CO2 in order to avoid any V-L phase transition for any CO2-N2 mix-ture composition) over the pressure range 5 - 600 bar. The rela-tionships between the variation of Raman spectral parameters with pressure (or density) and composition were evaluated to determine the most reliable quantification parameters. Finally, the composition, density, and pressure of natural FIs hosted in quartz from the Central Alps (Switzerland)47 were obtained with these calibration data, and subsequently compared with mi-crothermometry data.
MATERIALS AND METHODS
Gas mixture preparation. CO2-N2 binary mixtures of dif-ferent compositions were prepared from high-purity commer-cial N2 and CO2 gases (99.99 % purity, Air LiquideTM) at low pressure (< 10 bar) by a gas mixer (GasMix AlyTechTM). They were subsequently compressed up to 120-150 bars using a home-made compressor system and stored in a stainless-steel reservoir. The composition of the prepared gas mixtures was controlled by gas chromatography (GC) to ensure there was no significant modification during the compression step. The GC was calibrated by measuring several times a commercial CO2 -N2 gas mixture (Air LiquideTM), yielding a standard deviation of about 0.4 mol%. The final composition of the prepared gas mixtures was the average of three GC measurements with a standard uncertainty 0.4
√3 0.3 mol% (1). The compositions
of the CO2-N2 gas mixtures used in this study were 10.5, 30.1, 50.3, 60.9, 70.5, 80.1, and 88.6 mol% CO2.
Pressurization system. The reservoir containing the gas
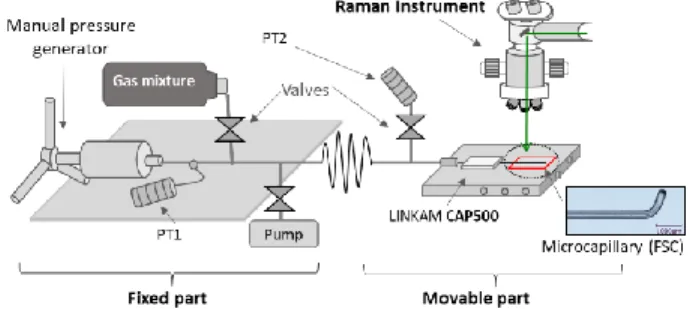
mixture was connected to an improved HPOC system, which consists of several valves, stainless steel microtubes and a pump (Figure 1).44–46 One end of the HPOC system was equipped with a manual screw pressure generator. The other end was coupled with a fused silica capillary (FSC) of 200 µm of internal diam-eter sealed at one end by a hydrogen flame.46,48 Two pressure transducers were set on the fixed part and on the movable part of the HPOC system to monitor pressure (± 1 bar) inside the whole system. The FSC was set on a customized heating-cool-ing stage (Linkam CAP500) previously calibrated by measurheating-cool-ing the triple point of distilled water (0.0 °C) and of a pure CO2 standard sample (–56.6 °C) to maintain the temperature at 22.0 and 32.0 ± 0.1 °C. The system was evacuated for a minimum of 30 minutes to remove any other gases before loading the inves-tigated gas mixture. Thereby, the gas mixtures were analyzed by Raman spectroscopy through the microcapillary at con-trolled PT conditions.
Figure 1: Sketch of the HPOC system coupled with a transparent fused silica capillary (FSC) set on a Linkam CAP500 heating-cool-ing stage. The system consists of a fixed part composed of a manual pressure generator, a pressure transducer (PT1), valves, micro-tubes, and a pump to purge the system. The movable part connects the system with the heating-cooling stage. It is also equipped with valves and another pressure transducer (PT2).
Raman spectroscopy. Raman measurements were
per-formed using a LabRAM HR spectrometer (Horiba Jobin-Yvon®) equipped with an 1800 groovemm-1 grating with an aperture of confocal hole and slit set at 1000 µm and 200 µm, respectively, giving a spectral resolution of about 1.67 cm–1 (fit-ted FWHM of Neon peak at 2348 cm–1). The excitation radia-tion was provided by an Ar+ laser (Stabilite 2017, Spectra-Phys-ics) at 514.53 nm with a power of 200 mW, focused on the FSC by a 20 X objective (Olympus, NA = 0.4). Each measurement was repeated six times successively at the same PTX conditions for statistical purposes. A spectrum was recorded before load-ing any gas mixture into the microcapillary to measure the con-tribution of atmospheric N2 for peak area correction.35 The same configuration (excitation wavelength, hole, slit, grating) was used for Raman analyses of natural FIs, except the use of a 50 X objective (Olympus, NA = 0.5). To minimize the error due to the subtraction of the N2 peak area, the intensity of the N2 band within FI should be 3 or 4 times higher than that of ambient N2. Thus, the acquisition time ranged from 5 to 30 seconds per ac-cumulation (with 10 acac-cumulations per measurement) depend-ing on the density, size, shape, and depth of FIs.
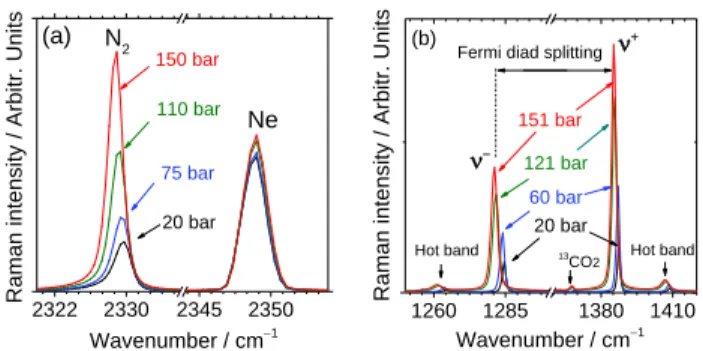
Figure 2: Evolution of (a) N2 and (b) CO2 Raman spectra with
pres-sure. Both gases show a downshift with increasing prespres-sure. The signal of neon (Ne) was simultaneously recorded with N2 spectra
for wavenumber calibration.
The Raman spectrum of N2 characterized by a peak at 2331 cm–1 was simultaneously recorded with Ne peak at 2348 cm−1 (Figure 2a) for wavelength calibration.49 As the N
2 band is not symmetrical (due to the asymmetric distribution of J = 0 tran-sition in the Q-branch50), the spectra of N
2 were fitted by an asymmetrical Gaussian-Lorentzian function using the peak fit-ting tool of LabSpecs 6 software (Horiba) after baseline sub-traction. The peak position of N2 was then corrected by that of Ne using Equation 1, where 𝑁2 and 𝑁𝑒 are the fitted peak po-sitions of N2 and Ne, respectively, and 2348.4318 cm–1 the ref-erence peak position of Ne cited from NIST webbook.51
𝑁2(𝑐𝑜𝑟)= 𝑁2+ (2348.4318 − 𝑁𝑒) Eq.1
CO2 has four vibrational modes: symmetrical stretching (1), asymmetrical stretching (3) and a doubly degenerated bending mode (2a and 2b). Only the 1 mode ( 1333 cm–1) is Raman-active. However, the experimental spectrum of CO2 presents two strong bands because of Fermi resonance52 taking place be-tween the excited vibrational states 1 and the first overtone of 2 (2𝜈2= 2 × 667 = 1334 cm−1). As these two excited states have nearly the same energy level, they perturb each other and cause a division into two peaks at higher (1388 cm–1) and lower (1285 cm–1) wavenumbers. This phenomenon is known as the Fermi diad splitting, resulting in two bands denoted + and −, respectively. Moreover, the spectrum of CO2 has also two low-intensity bands at 1409 cm–1 and 1265 cm–1, known as hot bands. Another weak band at 1370 cm–1 corresponds to the sig-nal of 13CO
2 (Figure 2b). Extended interpretation of spectral features of CO2 can be found in literature.53 Raman spectra of CO2 were fitted by symmetric Gaussian-Lorentzian function us-ing LabSpec 6 (Horiba) after baseline subtraction. Final values of spectral parameters were the mean of 6 measurements, yield-ing an uncertainty of about 0.4 % (1) for peak area values, about 0.01 cm–1 (1) for peak position and 0.015 cm–1for CO2 Fermi diad splitting (1) (see Supporting Information for detailed uncertainty calculations).
The Raman spectra of CO2 and N2 were recorded in two dif-ferent spectral ranges (1100 to 1580 cm–1 and 2100 to 2525 cm−1, respectively) with different instrumental efficiency of the spectrometer.27 All the Raman spectra were thus corrected using an ICS function (Intensity Correction System) integrated into LabSpec 6 software to normalized instrument response with wavelength. The calibration was done using a white lamp of known emission (Raman Calibration Accessory, Kaiser Optical Systems, Inc.).27 As a result, the instrumental efficiencies at the wavelength of CO2 and N2 peaks (𝐶𝑂
2 and 𝑁2) can be consid-ered identical.
Microthermometry. Microthermometry is a standard
method to determine PVTX proprieties of natural FIs. It is based on the determination of phase transition temperatures of geo-logical fluid trapped within inclusions. In the present work, mi-crothermometry measurements of natural FIs were made using a THMSG600 heating-cooling stage coupled with an Olympus BX50 microscope. The stage was calibrated at ± 0.1 °C using standard inclusions against the melting point of pure CO2 (−56.6 °C) and of pure H2O (0.0 °C). Herein, the melting temperature Tm(car) and the homogenization temperature
Th(car) of the volatile carbonic phase containing the CO2-N2 mixtures trapped within FIs were measured. These phase tran-sition temperatures were then used to determine the composi-tion and density of FIs using the VX diagram of Thiéry et al.54
GERG-2004 equation of state (EoS) is used to calculate (i)
the pressure within natural FIs at a given temperature from den-sity-composition properties derived from microthermometry re-sults and (ii) the density of gas mixtures during Raman meas-urements (for a given composition, pressure and temperature). The GERG-2004 EoS is known as the most accurate available EoS at the P and T conditions of interest. Concerning the CO2 -N2 gas mixtures, the EoS is fitted from 823 experimental data points, covers the entire composition range (from 1 to 98 mol% in CO2) and large pressure and temperature ranges (1 to 2740 bars and −63 to 400 °C). The uncertainties in density are shown to be less than 0.1 % when pressure < 350 bars or less than 0.5 % when pressure < 700 bars in the vapor region, about 0.1 - 0.5 % in the liquid region and less than 3 % in the two-phase region. This model is integrated into REFPROP software.55
Natural fluid inclusions. A prismatic quartz crystal (Mu
147.2) found in late Alpine tension gashes from the Central Alps (Switzerland)47 was used for its CO
2-N2 natural fluid in-clusions. At room temperature, the 2 to 30 µm large FIs are ei-ther monophasic (liquid CO2+N2) or biphasic (liquid H2O + va-por CO2-N2) (Figure 3). 15 FIs from 4 different zones were se-lected to be analyzed by Raman spectroscopy and microther-mometry for comparison.
Figure 3: Examples of selected FIs of sample Mu 147.2 (transmitted plane-polarized light at room temperature): (a), (b) and (c) monophasic FIs from zones 4, 3 and 2 containing a CO2-N2
liquid phase; (d) two-phase FI containing H2O (liquid) and a bubble
of CO2-N2 vapor.
RESULTS AND DISCUSSION
Mixture composition: Evaluation of the RRSCS of CO2.
The RRSCS of the two main bands of CO2 (𝐶𝑂2) were calcu-lated at different composition and pressure conditions with the use of Equation 2,28 where 𝐴
𝐶𝑂2 is the peak area of
+or − band, 𝐴𝑁2 is the peak area of the N2 band, 𝐶𝐶𝑂2 and 𝐶𝑁2 are the con-centration (mol%) of CO2 and N2, respectively.
Figure 4a shows the variation of the RRSCS of the upper band (+) and the lower band (−) as a function of pressure and composition. Both RRSCS are somewhat perturbed at low pressure (< 80 bars), probably due to a significant change of
2322 2330 2345 2350 Raman intens ity / Arbitr. Units Wavenumber / cm−1 (a) N2 150 bar Ne 110 bar 75 bar 20 bar 1260 1285 1380 1410 20 bar (b) 13 CO2 60 bar 151 bar + Hot band Raman intens ity / Arbitr. Units Wavenumber / cm−1 121 bar − Hot band
molecular interaction effect.33,34 Above 80 bars,
+ increases slightly whereas − decreases slightly with increasing pres-sure. Indeed, from 5 to 600 bars, the RRSCS value only in-creases by 0.05 (+) or decrease by 0.1 (−), resulting in a difference of only 0.2 mol% CO2. Figure 4b shows the evolu-tion of the sum of the two RRSCS of CO2 (+ + −) as a func-tion of pressure and composifunc-tion. A slight perturbafunc-tion was also observed at a low pressure-range. Above 80 bars, it remains nearly constant up to 600 bars for every composition.
σ
CO2= 𝐴𝐶𝑂2 𝐶𝑁2 𝐴𝑁2 𝐶𝐶𝑂2Eq. 2
Figure 4: Variation as a function of pressure and composition of (a) the RRSCS of the two bands of CO2 (+ at 1388 cm–1 and – at 1285 cm–1) and (b) their sum (+ + –).
A small shift with composition is observed but without a clear correlation (Figure 4a and 4b). The shifts are quite small, which is probably due to the small error on the measured composition of gas mixtures and to the sensitivity of the Raman spectrome-ter. Indeed, each gas mixture was analyzed on a different day, and there is always a fluctuation in the instrumental efficiency from day to day (known as instrumental and random errors).
Table 1: RRSCS of the two bands of CO2 (+ and −) and their sum. Values in literature were obtained at low pressure (1-5 atm) and room temperature. Our data are obtained in the pres-sure range 5 - 600 bar at 32 °C.
This study Ref. 29 Ref. 30 Ref. 31
(nm) 514 514 514 488 Pressure (bar) 5-600 2.35 - 1 + 1.40 ± 0.03 1.5 1.37 ± 0.1 1.4 - 0.89 ± 0.02 1 - 0.89 + + - 2.29 ± 0.04 2.5 - 2.29
Dubessy et al.35 stated that the sum of two RRSCS of CO 2 should always be preferred for the determination of gas mixture composition because it is constant with pressure. However, Seitz et al.34 showed in figure 5 that it was advantageous to use + only rather than the sum of the two for determining the composition of gas mixtures. According to our statistical anal-yses, the small variations of + and − with pressure are neg-ligible. We can, therefore, conclude that +, − and their sum are all almost constant for every gas mixture concentration over the studied pressure range and can be therefore be used to de-termine the composition of the gas mixture. However, the small variations of + and − may become significant at very high pressure. The sum of the two RRSCS of CO2 should, therefore, be used in preference to avoid any effect of pressure. The aver-aged values calculated from the experimental data (a population of 160 data points) are 1.40 ± 0.03, 0.89 ± 0.02 and 2.29 ± 0.04, for +, – and the sum + + –, respectively (uncertainties at 1σ). The values are in agreement with the data from literature but are given with better accuracy (Table 1).
Effect of composition, pressure, and density on Raman spectral features of N2 and CO2
a. Variation of the N2 peak position at 32 °C
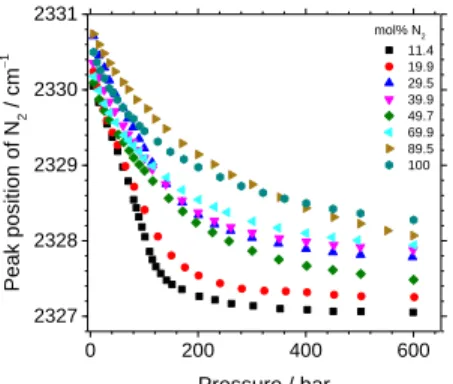
The downshift of the N2 band as a function of pressure and composition is shown in Figure 2a and Figure 5. The uncer-tainty of the corrected peak position of N2 (± 0.01 cm–1) is too small to be shown in Figure 5. At low pressure, the N2 peak position seems to converge to the same value ( 2330 - 2330.5 cm–1) for all gas compositions that is in agreement with Lama-drid et al.43 A drastic downshift is reported from 5 to 200 bars, especially for the gas mixtures dominated by CO2. Above 200 bars, it becomes less sensitive to pressure, even becoming nearly constant for gas mixtures dominated by CO2. This step-wise behavior can be explained by the variation of the density of the gas mixtures. For example, the density of the mixture at 11.4 mol% N2 increases drastically from 5 to 200 bar then reaches a plateau until 600 bar (cf. Figure S1). Figure 5 shows that the peak positions of N2 also vary with the composition of gas mixtures. In general, the presence of CO2 causes a greater downshift of the N2 peak position than that of pure N2 at the same pressure. For instance, a downshift of about 2 cm–1 is ob-served for pure N2 at 600 bars, whereas it is about 3.4 cm-1 for a gas mixture of 11.4 mol% N2.
Figure 5: Variation of the fitted peak position of N2 (corrected from
Ne peak position) at 32 °C as a function of pressure and composi-tion (mol% N2) of gas mixtures.
Besides, some curves relative to samples at different N2 con-centrations are superimposed or overlap each other (100 and 89.5 mol% N2 or 29.5, 39.9 and 69.9 mol% N2), indicating that the variation of the peak position of N2 as a function of compo-sition is not significant enough to be distinguished for some composition-pressure ranges. Moreover, for unknown reasons, the 89.5% N2 curve shows an abnormal behavior whereas the corresponding associated curve of the Fermi diad splitting of CO2 (the curve of 10.5 mol% CO2 in Figure 6) evolves as ex-pected. The modest reproducibility of the N2 peak position de-spite wavelength calibration by Ne may be linked to small day-to-day variation in the shape and the position of the neon band because of variations in the positioning of the neon lamp in the optical path of the Raman spectrometer. Thus, a higher-accurate method to wavelength correction is required to use the N2 peak position as a reliable quantitative parameter. After all, we can only conclude here the global variation trend of the N2 peak po-sition with a significant effect of the compopo-sition and pressure.
b. Variation of the CO2 Fermi diad splitting at 32 °C Figure 2b shows typical Raman spectra of CO2 and the down-shift of CO2 peaks with increasing pressure. The two bands of CO2 were investigated by measuring the distance between them (Fermi diad splitting), so there was no need for absolute wave-length calibration of the spectrometer.
0 200 400 600 0.6 0.9 1.2 1.5 1.8 0 200 400 600 1.6 2.0 2.4 2.8 (b) − ( cm−) RRSCS of CO 2 ba nd s Pressure / bar + ( cm−) (a) Sum of RRSCS of CO 2 ba nd s Pressure / bar mol% CO2 10.5 30.1 50.3 60.9 70.5 80.1 88.6 + + − 0 200 400 600 2327 2328 2329 2330 2331 mol% N2 11.4 19.9 29.5 39.9 49.7 69.9 89.5 100 Pea k p os iti on of N 2 / cm −1 Pressure / bar
Figure 6: Evolution of the Fermi diad splitting as a function of com-position and pressure of different CO2-N2 gas mixtures at 32 °C.
Uncertainties of Fermi diad splitting (± 0.015 cm–1 at 1) and of pressure (± 1 bar) are smaller than the data dot size.
Figure 6 represents the variation of the Fermi diad splitting of CO2 at 32 °C as a function of pressure and composition of the CO2-N2 gas mixture. At low pressure, the Fermi diad split-ting value is nearly identical ( 102.762 cm–1) for any sition. At higher pressure, an effect of the gas mixture compo-sition is clearly observed. In general, the presence of N2 reduces the magnitude of the variation of the Fermi diad splitting. For example, at 600 bars, the Fermi diad splitting shifts down from 105.348 cm–1 (for pure CO2) to 103.093 cm–1 (for the gas mix-ture at 10.5 mol% CO2). This trend is relatively similar to that observed for CO2 mixed with CH4.34 The repeatability and the reproducibility of the relationship between Fermi diad splitting, pressure, and composition of the gas mixture are much better than the peak position of N2 (Figure 5). The Fermi diad splitting of CO2 can thus be used as an accurate parameter to determine the pressure of CO2-N2 gas mixtures.
The Fermi diad splitting of CO2 can also be used for the de-termination of the density of CO2-N2 gas mixtures. For this, the density of every gas mixtures at given PT conditions presented in Figure 6 was calculated by the GERG-2004 EoS. The result-ing relationship between Fermi diad splittresult-ing of CO2, density, and composition of gas mixtures (at 32 °C) is presented in Fig-ure 7. The Fermi diad splitting increases with the density of the gas mixture and the content of CO2. Note that the shape of the curve with 99.8% CO2 is relatively irregular between 103.7 and 104.3 cm–1 (0.3 - 0.7 gcm–3). This is likely due to the proximity with the critical temperature of CO2 (31.05 °C) where a small temperature fluctuation may result in a significant variation of density.
Figure 7: Evolution of the Fermi diad splitting of CO2 as a function
of composition and density of CO2-N2 gas mixtures at 32 °C. The
density was calculated at given temperature, pressure, and compo-sition by the GERG-2004 EoS. Uncertainty on density is smaller than data dot size.
Overall, the data of the present study are in good agreement with recently published densimeters of pure CO2.39,40 It also
agrees well with the previous investigations regarding the Fermi resonance of CO2: (i) with increasing pressure, the Fermi reso-nance interaction reduces through a decrease of the anharmonic coupling constant (k122), resulting in an increase of the separa-tion between the unperturbed levels (1 and 22) as well as the Fermi diad splitting,56–58 and (ii) while increasing the content of N2, the reduction of the Fermi resonance becomes smaller (so the Fermi diad splitting still increases but with a smaller mag-nitude) in comparison with that of pure CO2 in the same condi-tions.57
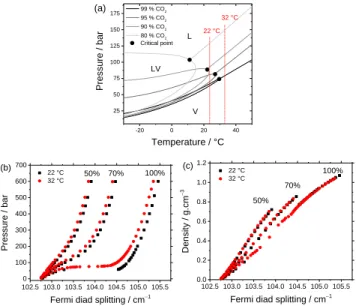
c. Effect of temperature on the Fermi diad splitting of CO2 The effect of temperature on the variation of CO2 Fermi diad splitting of CO2-N2 gas mixtures was also analyzed conducting experiments at 22 °C. At this temperature, a V-L phase transi-tion is observed for any gas mixture containing > 92 mol% CO2 (Figure 8a). The results are compared with those obtained at 32 °C in Figure 8b and Figure 8c. In general, the magnitude of the variation of the CO2 Fermi diad splitting at 32 °C is smaller than that at 22 °C at the same pressure (Figure 8b) but identical at the same density (Figure 8c). A large gap appears at 60 bars on the curve of pure CO2 at 22°C (< Tc = 31.05 °C) due to the vapor-liquid phase transition. Indeed, at this condition (22 °C and 60 bars), CO2 is in the two-phase LV domain (Figure 8a), and thus both liquid and vapor phases co-exist in the microcapillary. Pressure remains constant at 60 bars until the vapor phase is completely converted to liquid. As a result, no data point can be recorded within the density range 0.2 gcm−3 (vapor state) to 0.7 gcm−3 (liquid state). At 32 °C, there is no phase transition (supercritical state) for any CO2 -N2 gas mixture (Figure 8a) and data points can be collected over the entire density range. Therefore, only the data acquired at 32 °C were fitted to provide calibration equations. These equations must be used at 32 °C only for pressure determination but can be used (at least) in the range 22 - 32 °C for density determina-tion of any gas composidetermina-tion above the critical temperature (Figure 8b and Figure 8c).
Figure 8: (a) Phase diagrams of CO2-N2 gas mixtures exported from
data calculated by REFPROP. L: liquid-phase domain; V: vapor-phase domain and LV: biphasic liquid-vapor domain. Only critical isochores are drawn for each mixture. (b) and (c) Comparison be-tween the evolution of Fermi diad splitting of pure CO2 and CO2
-N2 mixtures (50 and 70 mol% CO2) as a function of pressure and
density at 22 and 32 °C. 0 100 200 300 400 500 600 102.5 103.0 103.5 104.0 104.5 105.0 105.5 99.8 mol% CO 2 88.6 mol% CO2 Fermi diad sp lit ting / cm −1 Pressure / bar 10.5 mol% CO 2 30.1 mol% CO2 50.3 mol% CO2 60.9 mol% CO 2 70.5 mol% CO2 80.1 mol% CO2 103.0 103.5 104.0 104.5 105.0 105.5 0.0 0.2 0.4 0.6 0.8 1.0 De ns ity / g.c m −3
Fermi diad splitting / cm−1
mol% CO2 10.5 30.1 50.3 60.9 70.5 80.1 88.6 99.8 -20 0 20 40 25 50 75 100 125 150 175 Press ure / bar Temperature / °C 99 % CO2 95 % CO2 90 % CO2 80 % CO2 32 °C 22 °C L LV Critical point V (a) 102.5 103.0 103.5 104.0 104.5 105.0 105.5 0 100 200 300 400 500 600 700 (b) 100% 70% 22 °C 32 °C Pres su re / ba r
Fermi diad splitting / cm−1 50% 102.5 103.0 103.5 104.0 104.5 105.0 105.5 0.0 0.2 0.4 0.6 0.8 1.0 1.2 (c) 22 °C 32 °C Den sity / g.cm −3
Fermi diad splitting / cm−1
50% 70%
d. Calibration equations to determine the pressure and den-sity of CO2-N2 gas mixtures
According to the whole data set shown in Figure 5, Figure 6 and Figure 7, the Fermi diad splitting of CO2 appears as the most reliable quantitative parameter for determining pressure and density of CO2-N2 gas mixtures. Data obtained at 32 °C were fitted to provide calibration equations. In order to mini-mize uncertainties on the calculated pressure and density, the calibration data were fitted separately for five smaller pressure-composition (PX) domains (Figure 9). Regions (a) and (b) cover the pressure range 5 to 600 bars and the composition range 50 - 100 mol% CO2 and 10 - 50 mol% CO2, respectively. Regions (c), (d) and (e) cover only the low-pressure range (5 - 150 bars) and the composition range 90 - 100 mol% CO2, 30 - 90 mol% CO2 and 10 - 30 mol% CO2, respectively.
Figure 9: Pressure-composition (PX) domains for application of polynomial equations a, b, c, d, and e. Experimental data were fitted within each PX domain to provide the best-fitting polynomial equa-tion to minimize uncertainties on the calculated pressure and den-sity.
Third-order polynomial equations linking pressure or density to the CO2 Fermi diad splitting and the composition of gas mix-tures were computed for each PX domain. The general form of the calibration polynomial is given in Equation 3, where 𝐶𝐶𝑂2 and are defined by Equations 4 and 5, respectively. Fitting by a higher-order polynomial does not lead to substantial improve-ments in the qualitative of measurement. The coefficients (𝑝𝑖𝑗, 𝑎, 𝑏, 𝑠𝑡𝑑_𝑎, 𝑠𝑡𝑑_𝑏, with (𝑖 + 𝑗) ≤ 3) of each calibration equations are listed in Table S2 (pressure) and Table S3 (den-sity) in Supporting Information.
𝑃𝑟𝑒𝑠𝑠𝑢𝑟𝑒 (𝑜𝑟 𝑑𝑒𝑛𝑠𝑖𝑡𝑦) = ∑ ∑ 𝑝𝑖𝑗𝐶𝐶𝑂2 𝑖 3 𝑗=0 Δ𝑗 3 𝑖=0 Eq. 3 𝐶𝐶𝑂2= 𝑀𝑜𝑙𝑎𝑟 𝑝𝑟𝑜𝑝𝑜𝑟𝑡𝑖𝑜𝑛 𝑜𝑓 𝐶𝑂2− 𝑎 𝑆𝑡𝑑_𝑎 Eq. 4 =𝐹𝑒𝑟𝑚𝑖 𝑑𝑖𝑎𝑑 𝑠𝑝𝑙𝑖𝑡𝑡𝑖𝑛𝑔 −𝑏 𝑆𝑡𝑑_𝑏 Eq. 5
Two main error sources contribute to the final uncertainty of the calculated pressure and density. The first source is directly associated with the uncertainty of the Fermi diad splitting (± 0.015 cm–1) and of the measured composition of the gas mixture (calculated from RRSCS and peak areas with Equation 2). As the regression calibration equations are not linear, the uncer-tainty of the first error source is not constant but varies with the composition of the gas mixture and the CO2 Fermi diad split-ting. The second error source is related to how well the best-fitted calibration equations reproduce the pressure and the den-sity from a given CO2 Fermi diad splitting and gas mixture com-position. The uncertainty of each calibration equation was de-rived from its prediction bounds (at 1) and reported in the last row of Tables S2 and S3. The ultimate uncertainty on measured pressure or density will be the sum of these two error sources, as reported by Fall et al.39 and Wang et al.40 for pure CO
2.
Investigation of CO2-N2 natural fluid inclusions. The
cali-brations described above were applied to 15 natural CO2-N2 fluid inclusions trapped within a quartz sample from the Central
Alps (Switzerland). Composition, pressure, and density were compared with those derived from microthermometry.
Each FI was analyzed three times by microthermometry to determine the melting temperature Tm(car) and the homogeni-zation temperature of the volatile phase Th(car) (Table S1). These phase transition temperatures were subsequently reported in the VX diagram of Thiéry et al.54 to calculate the composition and molar volume (density) of the fluid inclusion. As the uncer-tainties arising from this VX diagram are unknown, only the un-certainty of ± 0.1 °C of the heating-cooling stage to Tm(car) and
Th(car) is considered. This uncertainty of ± 0.1 °C can cause either significant or insignificant error depending on the region in the VX diagram. For example, the slopes of the Th(car) lines are less steep in the vapor field than in the liquid field (Figure 8b in54). In this domain, an uncertainty of ± 0.1 °C in T
m(car) can result in a variation of up to 5 mol% in composition and up to 0.09 gcm−3 in density. The second source of error may be an error in graphical reading. Detailed microthermometry results of each FI were reported in Supporting Information (Table S1). The selected FIs were also analyzed three times by Raman spectroscopy. The averaged values of the peak position and peak area of CO2 and N2 bands were used to calculate compo-sition, pressure, and density through Equations 2 to 5. The com-position of the FIs was calculated by the RRSCS of the two CO2 bands and their sum for comparison. The difference between these three values is always less than 1 mol% CO2. Detailed measurements of each FI are presented in Table S4 of Support-ing Information.
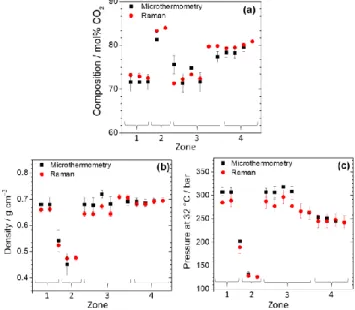
Figure 10: Comparison after analysis of the volatile phase of se-lected FIs by Raman and microthermometry of the (a) composition, (b) density, and (c) pressure at 32 °C.
Figure 10 presents a comparison between Raman and mi-crothermometry results. The uncertainty of Raman measure-ments on composition (< 0.5 mol% CO2) and density (< 0.01 gcm−3) is slightly better than that derived from microthermom-etry measurements (ranging from 1 to 2.2 mol% for composi-tion, and from 0.01 to 0.04 gcm−3 for density). Uncertainty on measured pressure at 32 °C from microthermometry (varying from 2 to 11 bars, Figure 10c) is equivalent to that from Raman ( 15 bars when pressure > 150 bars, and 3 bars when pressure < 150 bars).
Overall, the results derived from the two methods are close and comparable with a relative difference varying from 0.1 - 7
% coming from the error sources mentioned above, but also from the unknown error of the thermodynamic models of Soave-Redlich-Kong (1972) and Lee-Kesler (1975) used for the construction of the VX diagram of Thiéry et al. (1994).54 Ac-cording to Mullis et al.47, the trapping temperature of the geological fluid where Mu 147.2 sample was collected was about 400 °C. Thereby, the trapping pressure (the pressure at trapping temperature) of the geological fluid determined using GERG-2004 EoS is about 1610 ± 20 bar (calculated from Ra-man results) or 1770 ± 20 bars (calculated from microthermom-etry results). The difference of density leads to a difference of only 160 bars (9 %) which is of no consequence on geological interpretation.
Raman spectroscopy may be more efficient than microther-mometry in some cases. For example, FI4.8 is too small (< 2 µm, Figure 3a) to observe any phase transition with good accu-racy. Concerning FI3.5, Th(car) could not be determined pre-cisely because the vapor bubble was located in the dark part of the inclusion at a temperature close to homogenization (Figure 3b). Similarly, FI2.2 could not be analyzed by microthermom-etry because of bad optical conditions (color, contrast, etc.). These three FIs could, however, be analyzed by Raman spec-troscopy. Another disadvantage of microthermometry method (using VX diagram of Ref. 54) appears when clathrate is formed and remains above Th(car), meaning that a part of CO2 is still trapped inside the clathrate structure, and thus could lead to an underestimation of the CO2 quantity while using only
Th(car).59,60 The latter problem is not encountered by Raman spectroscopy at 22 and 32 °C.
CONCLUSION
The use of an improved HPOC system consisting of an FSC coupled with a heating-cooling stage and a Raman spectrometer makes it possible to investigate the behavior of CO2-N2 mix-tures at controlled pressure and temperature conditions. The ex-periments can be easily repeated several times for statistical purposes as well as repeatability and reproducibility test. A complete calibration of the Raman signals of CO2-N2 mixtures was thus performed for the first time. The Fermi diad splitting of CO2 was linked to pressure or density for any CO2-N2 gas mixture in the range 22 - 32 °C. It was also demonstrated that the RRSCS of CO2 does not depend on composition but slightly on pressure or density. However, this effect is negligible in the studied pressure range (< 600 bar). Thus accurate RRSCS val-ues of the two vibration modes of CO2 and their sum can be either used to determine the composition of CO2-N2 gas mix-tures with an uncertainty of about 0.5 mol%. The pressure and the density of CO2-N2 binary gas mixtures can be henceforth calculated by using regression calibration equations that were validated by successful application to natural fluid inclusions from the Central Alps, Switzerland. A detailed comparison was made indicating that Raman spectroscopy is a powerful alterna-tive tool to the microthermometry, providing not only PVX in-formation with comparable accuracy (even better in some cases) but also handling cases for which microthermometry cannot be applied. This study shows the applicability of Raman spectroscopy for gas analysis purposes at extreme conditions (very small object at high pressure) and can be easily extended to any gas mixture.
ASSOCIATED CONTENT
Supporting Information
The Supporting Information is available free of charge on the ACS Publications website.
Detailed uncertainty calculations and the coefficients of regression polynomial equations 3, 4 and 5 (PDF)
AUTHOR INFORMATION
Corresponding Author
* E-mail: [email protected]
Author Contributions
All authors have approved the final version of the manuscript.
ACKNOWLEDGMENTS
This work is a part of the thesis of Van-Hoan Le (Université de Lorraine) who acknowledges the French Ministry of Education and Research and the ICEEL Institut Carnot. The work benefited finan-cial support from CNRS-INSU CESSUR program. The authors are sincerely thankful to Catherine Lorgeoux and Héloïse Verron for their instruction during the Gas Chromatography measurement part, to Silvia Lasala and Romain Privat for a fruitful discussion about the thermodynamic properties of the CO2-N2 system. Two
anonymous reviewers are acknowledged for their thorough review and their insightful comments and suggestions.
REFERENCES
(1) D’Orazio, M.; Hirschberger, R. Opt. Eng. 1983, 22 (3), 308. (2) Petrov, D. V.; Matrosov, I. I. Appl Spectrosc 2016, 70 (10),
1770–1776.
(3) Hanf, S.; Keiner, R.; Yan, D.; Popp, J.; Frosch, T. Anal. Chem. 2014, 86 (11), 5278–5285.
(4) Hanf, S.; Bögözi, T.; Keiner, R.; Frosch, T.; Popp, J. Anal. Chem. 2015, 87 (2), 982–988.
(5) Inaba, H.; Kobayasi, T. Nature 1969, 224 (5215), 170. (6) Buric, M. P.; Chen, K.; Falk, J.; Velez, R.; Woodruff, S. 2009;
Vol. 7316, p 731608.
(7) Kiefer, J.; Seeger, T.; Steuer, S.; Schorsch, S.; Weikl, M. C.; Leipertz, A. Meas. Sci. Technol. 2008, 19 (8), 085408. (8) Petrov, D. V.; Matrosov, I. I.; Zaripov, A. R.; Maznoy, A. S.
Spectroc. Acta A 2019, 215, 363–370.
(9) Bögözi, T.; Popp, J.; Frosch, T. Bioanalysis 2015, 7 (3), 281– 284.
(10) Jochum, T.; Rahal, L.; J. Suckert, R.; Popp, J.; Frosch, T. An-alyst 2016, 141 (6), 2023–2029.
(11) Pedeche, S.; Simon, P.; Matzen, G.; Moulin, B.; Blanchard, K.; Querel, G. J. Raman Spectrosc. 2003, 34 (3), 248–252. (12) Taquet, N.; Pironon, J.; De Donato, P.; Lucas, H.; Barres, O.
Int. J. Greenhouse Gas Control 2013, 12, 359–371. (13) Jochum, T.; von Fischer, J. C.; Trumbore, S.; Popp, J.; Frosch,
T. Anal. Chem. 2015, 87 (21), 11137–11142.
(14) Jochum, T.; Fastnacht, A.; Trumbore, S. E.; Popp, J.; Frosch, T. Anal. Chem. 2017, 89 (2), 1117–1122.
(15) Keiner, R.; Herrmann, M.; Küsel, K.; Popp, J.; Frosch, T. An-alytica Chimica Acta 2015, 864, 39–47.
(16) Sieburg, A.; Jochum, T.; Trumbore, S. E.; Popp, J.; Frosch, T. Analyst 2017, 142 (18), 3360–3369.
(17) Sieburg, A.; Schneider, S.; Yan, D.; Popp, J.; Frosch, T. Ana-lyst 2018, 143 (6), 1358–1366.
(18) Roedder, E. Mineral. Soc. Am. 1984, 12, 644.
(19) Van den Kerkhof, A.; Thiéry, R. Lithos 2001, 55 (1), 49–68. (20) Rosso, K. M.; Bodnar, R. J. Geochim Cosmochim Acta. 1995,
59 (19), 3961–3975.
(21) Kawakami, Y.; Yamamoto, J.; Kagi, H. Appl. Spectrosc. 2003, 57 (11), 1333–1339.
(22) Yamamoto, J.; Kagi, H.; Kaneoka, I.; Lai, Y.; Prikhod’ko, V. S.; Arai, S. Earth Planet. Sci. Lett. 2002, 198 (3), 511–519. (23) Yamamoto, J.; Kagi, H.; Kawakami, Y.; Hirano, N.;
Naka-mura, M. Earth Planet. Sci. Lett. 2007, 253 (3), 369–377. (24) Song, Y.; Chou, I.; Hu, W.; Robert, B.; Lu, W. Acta
Geolog-ica SinGeolog-ica - English Edition 2009, 83 (5), 932–938. (25) Burke, E. A. J. Lithos 2001, 55 (1), 139–158.
(26) Frezzotti, M. L.; Tecce, F.; Casagli, A. J. Geochem. Explor. 2012, 112 (Supplement C), 1–20.
(27) Dubessy, J.; Caumon, M.-C.; Rull, F. In EMU Notes in Min-eralogy; 2012; Vol. 12, pp 83–172.
(28) Wopenka, B.; Pasteris, J. D. Appl. Spectrosc., AS 1986, 40 (2), 144–151.
(29) Fouche, D. G.; Chang, R. K. Appl. Phys. Lett. 1971, 18 (12), 579–580.
(30) Penney; Goldman; Lapp. Nat. Phys. Sci. 1972, 235, 110–112. (31) Fenner, W. R.; Hyatt, H. A.; Kellam, J. M.; Porto, S. P. S. J.
Opt. Soc. Am., JOSA 1973, 63 (1), 73–77.
(32) Schrötter, H. W.; Klockner. In Topics in Current Physics; 1979; Vol. 11, pp 123–164.
(33) Seitz, J. C.; Pasteris, J. D.; Chou, I.-M. Am. J. Sci. 1993, 293 (4), 297–321.
(34) Seitz, J. C.; Pasteris, J. D.; Chou, I.-M. Am. J. Sci. 1996, 296 (6), 577–600.
(35) Dubessy, J.; Poty, B.; Ramboz, C. Eur. J. Mineral. 1989, 517– 534.
(36) Wang, C. H.; Wright, R. B. J. Chem. Phys. 1973, 59 (4), 1706–1712.
(37) Garrabos, Y.; Chandrasekharan, V.; Echargui, M. A.; Mar-sault-Herail, F. Chem. Phys. Lett. 1989, 160 (3), 250–256. (38) Wright, R. B.; Wang, C. H. J. Chem. Phys. 1974, 61 (7),
2707–2710.
(39) Fall, A.; Tattitch, B.; Bodnar, R. J. Geochim Cosmochim Acta. 2011, 75 (4), 951–964.
(40) Wang, X.; Chou, I.-M.; Hu, W.; Burruss, R. C.; Sun, Q.; Song, Y. Geochim Cosmochim Acta. 2011, 75 (14), 4080–4093. (41) Lamadrid, H. M.; Steele-Macinnis, M.; Bodnar, R. J. Raman
Spectrosc. 2017.
(42) Yamamoto, J.; Kagi, H. Chem. Lett. 2006, 35 (6), 610–611. (43) Lamadrid, H. M.; Moore, L. R.; Moncada, D.; Rimstidt, J. D.;
Burruss, R. C.; Bodnar, R. J. Chem. Geol. 2017, 450, 210– 222.
(44) Chou, I.-M.; Burruss, R. C.; Lu, W. In Advances in High-Pressure Technology for Geophysical Applications; Chen, J., Wang, Y., Duffy, T. S., Shen, G., Dobrzhinetskaya, L. F., Eds.; Elsevier: Amsterdam, 2005; pp 475–485.
(45) Chou, I.-M. In EMU Notes in Mineralogy; 2012; Vol. 12, pp 227–247.
(46) Caumon, M.-C.; Robert, P.; Laverret, E.; Tarantola, A.; Randi, A.; Pironon, J.; Dubessy, J.; Girard, J.-P. Chem. Geol. 2014, 378 (Supplement C), 52–61.
(47) Mullis, J.; Dubessy, J.; Poty, B.; O’Neil, J. Geochim Cosmo-chim Acta. 1994, 58 (10), 2239–2267.
(48) Caumon, M.-C.; Dubessy, J.; Robert, P.; Tarantola, A. Eur. J. Mineral. 2013, 25 (5), 755–763.
(49) McCreery, R. L. Raman Spectroscopy for Chemical Analysis; John Wiley & Sons, 2005; Vol. 225.
(50) Bendtsen, J. Journal of Raman Spectroscopy 1974, 2 (2), 133– 145.
(51) Kramida, A.; Ralchenko, Y.; Reader, J.; NIST ASD Team. NIST Atomic Spectra Database (version 5.6.1); 2018. (52) Fermi, E. Z. Physik 1931, 71 (3–4), 250–259.
(53) Placzek, G. Rayleigh-Streuung und Raman-Effekt; Akad. Ver-lag-Ges., 1934; Vol. 2.
(54) Thiéry, R.; Kerkhof, A.; Dubessy, J. Eur. J. Mineral. 1994, 6, 753–771.
(55) Lemmon, E. W.; Huber, M. L.; McLinden, M. O. Standard Reference Data Program, Gaithersburg 2013.
(56) Hacura, A.; Bródka, A.; Nikiel, L.; Baglin, F. G. J. Mol. Struct. 1990, 218, 297–302.
(57) Hacura, A. Phys. Lett. A 1997, 227 (3–4), 237–240. (58) Olijnyk, H.; Däufer, H.; Jodl, H. ‐J.; Hochheimer, H. D. J.
Chem. Phys. 1988, 88 (7), 4204–4212.
(59) Diamond, L. W. Geochim Cosmochim Acta. 1992, 56 (1), 273–280.
(60) Bakker, R. J. Computers & Geosciences 1997, 23 (1), 1–18.