HAL Id: hal-02340412
https://hal.archives-ouvertes.fr/hal-02340412
Submitted on 30 Oct 2019HAL is a multi-disciplinary open access archive for the deposit and dissemination of sci-entific research documents, whether they are pub-lished or not. The documents may come from teaching and research institutions in France or abroad, or from public or private research centers.
L’archive ouverte pluridisciplinaire HAL, est destinée au dépôt et à la diffusion de documents scientifiques de niveau recherche, publiés ou non, émanant des établissements d’enseignement et de recherche français ou étrangers, des laboratoires publics ou privés.
the nitryl chloride ClNO2 molecule
J.-M. Flaud, A. Anantharajah, F. Kwabia Tchana, L. Manceron, J. Orphal, G.
Wagner, M. Birk
To cite this version:
J.-M. Flaud, A. Anantharajah, F. Kwabia Tchana, L. Manceron, J. Orphal, et al.. High-resolution analysis of the 12.6 µm spectral region of the nitryl chloride ClNO2 molecule. Journal of Quantitative Spectroscopy and Radiative Transfer, Elsevier, 2019, 224, pp.217-221. �10.1016/j.jqsrt.2018.11.020�. �hal-02340412�
High-resolution analysis of the 12.6 µm spectral region of the nitryl
chloride ClNO
2molecule
J.-M. Flaud,a,* A. Anantharajah,a F. Kwabia Tchana,a,* L. Manceron,b,c J. Orphal,d G. Wagner,e M. Birk e
a
Laboratoire Interuniversitaire des Systèmes Atmosphériques (LISA), UMR CNRS 7583, Universités Paris Est Créteil et Paris Diderot, Institut Pierre Simon Laplace, 61 Avenue du Général de Gaulle, 94010 Créteil Cedex, France.
b Ligne AILES, Synchrotron SOLEIL, L’Orme des Merisiers, St-Aubin BP48, F-91192
Gif-sur-Yvette Cedex, France.
c
Sorbonne Université, CNRS, MONARIS, UMR 8233, 4 place Jussieu, F-75005 Paris, France.
d
Institute of Meteorology and Climate Research (IMK), Karlsruhe Institute of Technology (KIT), 76344 Eggenstein-Leopoldshafen, Germany.
e
Remote Sensing Technology Institute, DLR, 82234 Wessling, Germany.
Nb of Figures : 6 Nb of Tables : 4
Corresponding authors: Jean-Marie Flaud ([email protected]) and Fridolin Kwabia Tchana ([email protected])
Abstract
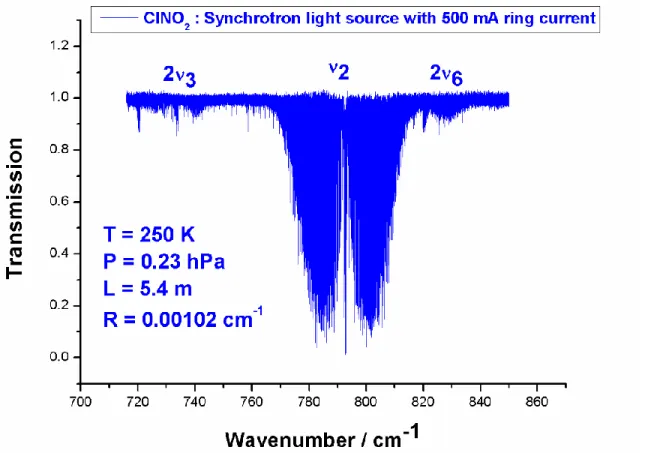
The 12.6 µm region of nitryl chloride (ClNO2) has been recorded at high resolution
(0.00102 cm-1) using a Fourier transform spectrometer and the SOLEIL synchrotron light source. ClNO2 was found during our studies of chlorine nitrate and, after fractional distillations it was
introduced into a multipass White cell made of inert materials, with an optical path length of 5.4 m. 320 scans were recorded for the range 600-980 cm-1 at a total pressure of 0.23 hPa and a temperature of 250 K. A thorough analysis of the ν2, 2ν6 and 2ν3 bands of 35ClNO2 and of the ν2
band of 37ClNO2 falling in this region has been carried out using a Hamiltonian model which
takes explicitly into account the numerous resonances affecting the ro-vibrational energy levels; especially the C-type Coriolis resonance between the ν2 and the ν3 + ν6 modes. These two modes
are only separated by less than 20 cm-1 and are thoroughly mixed. From the fittings, the following band centers were derived: νo (ν2) = 792.761264(60) cm-1, νo (ν3 + ν6) = 775.8923(20)
cm-1, νo (2ν3) = 734.183576(20) cm-1 and νo (2ν6) = 819.836727(90) cm-1 for 35ClNO2 and νo (ν2)
= 792.258284(30) cm-1 and νo (ν3 + ν6) = 774.6826(30) cm-1 for 37ClNO2 where the uncertainties
are one standard deviation. Due to their sharp Q branches falling into an atmospheric “window”, the detection of the ν2 bands might be an advantageous route for future attempts to quantify
atmospheric ClNO2, using infrared techniques.
Keywords: nitryl chloride; ClNO2; high-resolution Fourier transform spectroscopy; Coriolis and
I. Introduction
Nitryl chloride (ClNO2) is a molecule of great interest for atmospheric chemistry since it
is produced in the marine troposphere, by heterogeneous reactions between NaCl sea-salt aerosols and gaseous N2O5 [1,2]:
N2O5 + NaCl → ClNO2 + NaNO3.
Alternatively, it is produced on polar stratospheric clouds, between N2O5 and solid HCl [3,4]:
N2O5 + HCl/ice → ClNO2 + HNO3.
Through these reactions, ClNO2, a fairly stable molecule, is accumulated during nighttime but
after sunrise, it is rapidly destroyed either by photolysis (λ > 290 nm): ClNO2 + h → Cl + NO2,
or by reaction with OH radicals [5]:
ClNO2 + OH → HOCl + NO2.
As oxidation slowly removes ClNO2 [6-7], photolysis is thus contributing predominantly to the
loss process of ClNO2. Moreover, by yielding active chlorine radicals and nitrogen dioxide, this
reaction subsequently initiates VOCs oxidation by chlorine radicals and photolysis of NO2, both
leading to the photochemical production of tropospheric ozone, as well as to stratospheric ozone depletion.
The important contribution of ClNO2 in atmospheric chemistry triggered since 2006 in
situ ground-based and aircraft measurements using chemical ionization mass spectrometry,
indicating also additional continental sources of chlorine [8]. But, to the best of our knowledge, until today, there was not even a tentative detection of this atmospheric gas using infrared techniques like Fourier transform spectroscopy. In this case, the Q branch of the ν2 band at 792.8
cm-1 could be suitable for the remote sensing of ClNO2 due to its strong absorption in an
atmospheric “window”, similarly to the use of the 780.2 cm-1
band feature for the monitoring of ClONO2 in the stratosphere [9-11]. For this purpose, a complete and detailed analysis is required
to provide accurate line list for atmospheric remote sensing.
ClNO2 has been the subject of a number of microwave and infrared high resolution
studies [12-17 and refs herein]. In this paper we present a comprehensive analysis of a very high resolution Fourier transform spectrum of nitryl chloride, taken at 0.00102 cm-1 resolution (0.9/MOPD) in the 12.6 µm spectral region using the SOLEIL synchrotron radiation. A thorough
analysis of the strongest absorbing bands ν2 of the two isotopologues 35ClNO2 and 37ClNO2 was
performed taking into account the interactions with the nearby states 3161 and 62. Also the very weak bands 2ν3 and 2ν6 were fully analyzed.
II. Experimental details.
At DLR samples of bromine nitrate (BrONO2) were produced together with the precursor
chlorine nitrate (ClONO2) [18]. Experimental details on the ClONO2 synthesis can be found in
[19]. In the sample of ClONO2, the original target of our work, we found a second product that
showed characteristic infrared absorption features indicating a NO2 group. After fractional
distillations at –84°C and –77°C, only ClNO2 and small traces of impurities (NO2 and ClONO2)
were seen in the spectrum. The sample was stored at 77 K in the dark, and ClNO2 was identified
by its low resolution infrared absorption spectrum [20].
A high-resolution absorption spectrum of ClNO2 was then recorded on the AILES
beamline at Synchrotron SOLEIL using the synchrotron light source, coupled to the Bruker IFS125HR Fourier transform spectrometer [21, 22] and a newly developed cryogenic multipass cell suitable for corrosive products, in which the sample gas is exclusively in contact with glass, PTFE and hard alumina-coated optics and can be cooled down to 220 K [23]. The interferometer was equipped with a KBr/Ge beamsplitter. The synchrotron source was operated with 500 mA ring current and a new home-made detector developed at the AILES beamline [24] was used in conjunction with a 600-980 cm-1 bandpass optical filter, to improve the signal-to-noise ratio (S/N). The spectrometer was evacuated to about 5×10⁻³ Pa in order to minimize H2O and CO2
absorptions. The diameter of the entrance aperture of the spectrometer was set to 1.5 mm to maximize the intensity of infrared radiation falling onto the detector without saturation or loss of spectral resolution. Interferograms were recorded with a 80 kHz scanner frequency and a maximum optical path difference (MOPD) of 882.35 cm. According to the Bruker definition (resolution = 0.9/MOPD), this corresponds to a resolution of 0.00102 cm-1.
The cell optical set-up is based on a 0.67 m base length and, in this experiment, an optical path of 5.4 m was used. The spectrum was recorded at a temperature of 250 K. The following procedure was used for measurements: first a background spectrum was recorded at the same temperature of 250 K while the cell was being continuously evacuated; next the infrared gas cell
was filled and passivated with ClNO2 vapour and, for the final measurement, a sample pressure
of 0.23 hPa was used. The sample pressure in the cell was measured using a home made PTFE-coated capacitive pressure sensor [23] calibrated against a MKS Baratron gauge (10 hPa full scale). The spectrum was ratioed against a background spectrum of the empty cell which was recorded at a resolution of 0.01 cm-1 in order to ensure the best possible S/N in the ratioed spectrum. For the Fourier transform, a Mertz-phase correction with a 2 cm-1 phase resolution, a zero-filling factor of 4 and no apodization (boxcar option) were applied to the averaged interferograms (320 scans). The spectrum was calibrated by matching the measured positions of about 30 lines of residual CO2 observed therein to reference wavenumbers available in HITRAN
[25] with a root mean square (RMS) deviation of 0.00006 cm–1.
Fig. 1 gives an overview of the ClNO2 spectrum around 12.6 µm showing the high S/N
ratio which was obtained. The distinctive shape of the A-type ν2 band with its narrow Q-branch
is clearly visible. Also the very weak bands 2ν6 and 2ν3 are visible.
III. Analysis and results
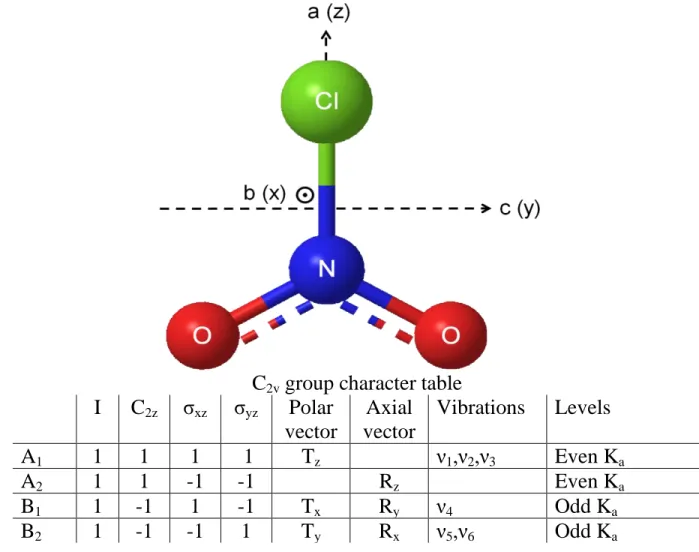
ClNO2 is belonging to C2v symmetry and Fig. 2 provides the corresponding C2v point
group together with the symmetry types of the 6 vibrational modes as well as the components of an axial and a polar vector and the symmetry types and statistical weights of the rotational levels. Indeed, because there are two identical oxygen nuclei with zero nuclear spin, the overall wavefunction of the molecule should obey the Bose-Einstein statistics. Accordingly, all vibration-rotation wavefunctions must have even parity with respect to the axis of the molecule. As a consequence, only rotational levels with Ka even exist for states of A1 or A2 symmetry (the
ground, 21, 32, and 62 states of the molecule in the present case). On the contrary, only rotational levels with Ka odd exist for states of B1 or B2 symmetry (3161 vibrational state).
The ν2 band of 35ClNO2 has been previously studied inref. [15, 16] where the authors
noted an interaction between the rotational levels of 21 and the rotational levels of 3161 but did not take it into account. In addition, their spectrum was recorded at medium resolution (0.005 cm-1), with a pressure of 10 Torr, resulting in a rotational structure that was not fully resolved. The analysis was started using the upper state rotational constants of the 21 vibrational state given in ref. [16]. In this way it was possible to assign levels not or weakly perturbed. However, it appeared rapidly that such a model was not suitable to fit the upper state levels to within the
experimental uncertainty. We then set up and used a Hamiltonian model taking into account the C-type Coriolis interaction between the rotational levels of 21 and the rotational levels of 3161. In this way it was possible to assign a rather large number of lines by iterating between calculation and observation: more precisely new assignments allow one to improve the upper state Hamiltonian constants, which are then used to provide better predictions. However it turned out that such a Hamiltonian model was still not fully suitable and that one has also to take into account the Fermi-type interaction between the rotational levels of 21 and the rotational levels of 62. The final Hamiltonian matrix used to fit the 21 and 62 rotational levels is given in Table 1. At this stage it is indeed worth noticing that we had to assign in parallel the very weak 2ν6 band
which appears on the experimental spectrum (see Fig. 1). Table 2 gives the range of quantum numbers for the observed upper state energy levels obtained by adding the observed line positions to the calculated ground state levels as well as the statistical analysis of the results of the energy level calculations, whereas the upper state Hamiltonian constants derived from the final fit are given in Table 3.
The analysis of the ν2 band of 37ClNO2 was started by using the same Hamiltonian model as for
the ν2 band of 35ClNO2 and upper state Hamiltonian constants derived from the corresponding
upper state constants of 35ClNO2. In this way, it was possible to locate lines with medium J and
Ka values. These lines were used to improve the upper state constants, providing then better
predictions and hence allowing new assignments. The process was repeated until no new assignment was possible.
Table 2 gives the range of quantum numbers for the observed upper state energy levels as well as the statistical analysis of the results of the energy level calculations, whereas the upper state Hamiltonian constants derived from the final fit are given in Table 4. It is worth noticing that given the range of observed energy levels it was not necessary to account for the interaction with the 62 levels. The assignment of the 2ν3 band was done by using, for the 32 state, Hamiltonian
constants extrapolated from the ground and 31 states [16]. In fact, the assignments started by improving the modeling of the Q-branch. The upper state levels were reproduced using a Watson type Hamiltonian [27] since no interaction was detected. The range of quantum numbers for the observed upper state energy levels, as well as the statistical analysis of the results of the energy level calculations, are given in Table 2 whereas the upper state Hamiltonian constants derived from the final fit are given in Table 3. It should be underlined that the upper state Hamiltonian
parameters determined in the fits are effective and have some empirical character, since the values of these parameters depend on the set and the accuracy of the observed energy levels, as well as on the number of terms in the expansions of the interacting terms.
IV. Simulation of the experimental spectrum.
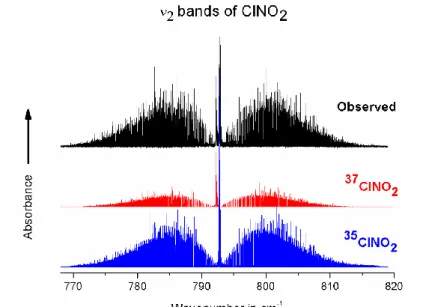
To emphasize the quality of the calculations, we have compared the observed and calculated spectra in a few spectral regions. Fig. 3 shows that the entire region of the ν2 bands of
the 2 isotopologues 35ClNO2 and 37ClNO2 is adequately simulated. In Figs. 4-6 we present a
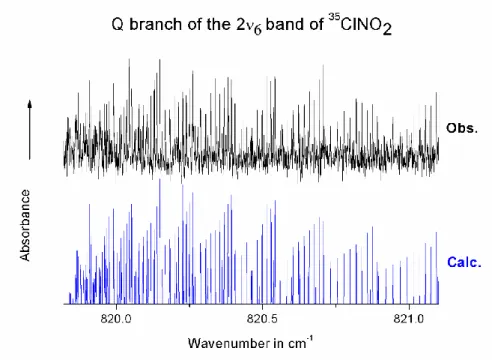
comparison between observation and calculation for the Q-branches of the ν2 band of 37ClNO2
and of the 2ν6 and 2ν3 bands of 35 ClNO2. Indeed, modeling properly such Q branches is the
most difficult part of the work, given the piling of lines and the high J lines involved. It is also interesting to notice the very different shapes of these Q-branches. In all cases excellent agreement between the observed and calculated spectrum is achieved.
VI. Conclusion.
A high-resolution Fourier transform spectrum of the 12.6 μm absorption bands of the nitryl chloride ClNO2 molecule has been thoroughly analyzed. The energy levels belonging to
the interacting upper states {21, 3161, 62} of 35ClNO2 were fitted using a Hamiltonian matrix
accounting for the C-type Coriolis interaction between the 21 and 3161 levels and the Fermi-type interaction between the 21 and 62 levels. For 37ClNO2 it was sufficient to fit properly the 21
rotational levels to take into account the C-type Coriolis interaction between the 21 and 3161 levels. Finally it was possible to model properly the rotational levels of the 32 state using a single Watson type Hamiltonian. The synthetic line list obtained in this study is potentially interesting for future measurements of ClNO2 in the atmosphere.
References
[1] Finlayson-Pitts BJ, Ezell MJ, Pitts Jr JN. Formation of chemically active chlorine compounds by reactions of atmospheric NaCl particles with gaseous N2O5 and ClONO2.
Nature 1989;337:241-4.
[2] Behnke W, Scheer V, Zetzsch C. Formation of ClNO2 and HNO3 in the presence of N2O5
and wet pure NaCl- and wet mixed NaCl/Na2SO4-aerosol. J Aerosol Sci 1993;24:115-6.
[3] Tolbert MA, Rossi MJ, Golden DM, Antarctic Ozone Depletion Chemistry: Reactions of N2O5 with H2O and HCl on Ice Surfaces. Science 1988;240:1018-21.
[4] Leu MT. Heterogeneous reactions of N2O5 with H2O and HCl on ice surfaces: Implications
for Antarctic ozone depletion. Geophys Res Lett 1988;15:851-4.
[5] Ganske JA, Ezell MJ, Berko HN, Finlayson-Pitts BJ. The reaction of OH with ClNO2 at
298 K: kinetics and mechanisms. Chem Phys Lett 1991;179:204-10.
[6] Watson RT. Rate constants for reactions of ClOx of atmospheric interest. J Phys Chem 1977;6:871-917.
[7] Ganske JA, Berko HN, Ezell MJ, Finlayson-Pitts BJ. Kinetics of the gas-phase reaction of hydroxyl with nitryl chloride from 259 to 348 K. J Phys Chem 1992;96:2568-72.
[8] Osthoff HD, Roberts JM, Ravishankara AR, Williams EJ, Lerner BM, Sommariva R, et al. High levels of nitryl chloride in the polluted subtropical marine boundary layer. Nat Geosci 2008;1:324-8.
[9] Von Clarmann T, Fischer H, Friedl-Vallon F, Linden A, Oelhaf H, Piesch C, et al. Retrieval of stratospheric O3, HNO3, and ClONO2 profiles from 1992 MIPAS-B limb
emission spectra: method, results, and error analysis. J Geophys Res 1993;98:20495-506. [10] Rinsland CP, Gunson MR, Abrams R, Zander R, Mahieu E, Goldman A, et al. Profiles of
stratospheric chlorine nitrate (ClONO2) from atmospheric trace molecule
spectroscopy/ATLAS 1 infrared solar occultation spectra. J Geophys Res 1994;99:18895-900.
[11] Johnson DG, Orphal J, Toon GC, Chance KV, Traub WA, Jucks KW, et al. Measurements of chlorine nitrate in the stratosphere using the ν4 and ν5 bands. Geophys Res Lett
1996;23:1745-8.
[12] Filgueira RR, Forti P, Corbelli G. Microwave spectrum and molecular force field of tetratomic C2v molecules: NO2Cl. J Mol Spectrosc 1975;57:97-106.
[13] Orphal J, Morillon-Chapey M, Guelachvili G. The High-Resolution Infrared Spectrum of Nitryl Chloride: Rotational Analysis of the 35ClNO2 ν4 Band around 6 µm. J Mol Spectrosc
[14] Orphal J, Guelachvili G, Morillon-Chapey M. The ν1 and 2ν6 Bands of 35ClNO2 (Nitryl
Chloride) around 7.7 µm Studied by High-Resolution Fourier-Transform Spectroscopy. J Mol Spectrosc 1994;166:280–6.
[15] Duxbury G, McPheat R. High-Resolution Absorption Spectrum of the ν2 Band of Nitryl
Chloride, ClNO2, at 793 cm-1. J Mol Spectrosc 1995;174:446–58.
[16] Orphal J, Morillon-Chapey M, Klee S, Mellau GC, Winnewisser M. The Far-Infrared Spectrum of ClNO2 Studied by High-Resolution Fourier-Transform Spectroscopy. J Mol
Spectrosc 1998;190:101–6.
[17] Francis SG, Harvey JN, Walker NR, Legon AC. An investigation of the molecular geometry and electronic structure of nitryl chloride by a combination of rotational spectroscopy and ab initio calculations. J Chem Phys 2008;128:204305.
[18] Wagner G, Birk M. New infrared spectroscopic database for bromine nitrate. J Mol Spectrosc 2016;326:95-105.
[19] Wagner G, Birk M. New infrared spectroscopic database for chlorine nitrate. J Quant Spectrosc Radiat Transf 2003;82:443–460.
[20] Orphal J. Spectroscopie Infrarouge à Haute Résolution de Molécules Instables d’Intérêt Atmosphérique: ClONO2, ClNO2 et BrONO2. Thèse de doctorat, Université de Paris-Sud,
Orsay, No d’ordre: 3510.
[21] Brubach JB, Manceron L, Rouzières M, Pirali O, Balcon D, Kwabia Tchana F, Boudon V, Tudorie M, Huet Th, Cuisset A, Roy P. Performance of the AILES THz-Infrared beamline at SOLEIL for high resolution spectroscopy. AIP Conf Proc 2010;1214:81-84.
[22] Roy P, Brubach JB, Rouzières M, Pirali O, Manceron L, Kwabia Tchana F. AILES: la ligne infrarouge et THz sur rayonnement synchrotron à SOLEIL. Revue de l’Electricité et de l’Electronique 2008;2:23-30.
[23] Reymond-Laruinaz S, Faye M, Boudon V, Doizi D, Manceron L. High-resolution infrared spectroscopy and analysis of the ν2/ν4 bending dyad of ruthenium tetroxide. J Mol
Spectrosc 2017;336:29-35.
[24] Faye M, Bordessoule M, Kanouté B, Brubach JB, Roy P, Manceron L. Improved mid infrared detector for high spectral or spatial resolution and synchrotron radiation use. Rev Sci Instrum 2016;87:063119.
[25] Gordon IE, Rothman LS, Hill C, Kochanov RV, Tana Y, Bernath PF, Birk M, Boudon V, Campargue A, Chance KV, Drouin BJ, Flaud JM, Gamache RR, Hodges JT, Jacquemart D, Perevalov VI, Perrin A, Shine KP, Smith MA, Tennyson J, Toon GC, Tran H, Tyuterev VG, Barbe A, Császár AG, Devi VM, Furtenbacher T, Harrison JJ, Hartmann JM, Jolly A, Johnson TJ, Karman T, Kleiner I, Kyuberis AA, Loos J, Lyulin OM, Massie ST, Mikhailenko SN, Moazzen-Ahmadi N, Müller HSP, Naumenko OV, Nikitin AV, Polyansky OL, Rey M, Rotger M, Sharpe SW, Sung K, Starikova E, Tashkun SA, Vander
Auwera J, Wagner G, Wilzewski J, Wcisło P, Yuh S, Zak EJ. The HITRAN 2016 molecular spectroscopic database. J Quant Spectrosc Radiat Transf 2017;203:3-69.
[26] Flaud J-M. Private communication.
[27] Watson JKG. Aspects of quartic and sextic centrifugal effects of rotational energy levels. In: Durig JR, editor. Vibrational spectra and structure. Vol 3. New York: Academic Press; 1977, p. 69–110.
Figures:
Fig. 1. Overview of the observed ClNO2 spectrum in the 12.6 µm spectral region.
The distinctive shape of the A-type ν2 band of 35ClNO2 with its narrow Q-branch is clearly
recognizable. The spectrum is recorded with a resolution of 0.00102 cm-1, an optical path length of 5.4 m, a nitryl chloride pressure of 0.23 hPa and a temperature of 250 K.
Fig. 2. Structure and symmetry properties of the nitryl chloride (ClNO2) molecule
C
2vgroup character table
I
C
2zσ
xzσ
yzPolar
vector
Axial
vector
Vibrations
Levels
A
11
1
1
1
T
zν
1,ν
2,ν
3Even K
aA
21
1
-1
-1
R
zEven K
aB
11
-1
1
-1
T
xR
yν
4Odd K
aB
21
-1
-1
1
T
yR
xν
5,ν
6Odd K
aFig. 3. Overview of the observed and calculated spectrum of ClNO2 in the 12.6 µm spectral
region.
Upper trace: observed spectrum with the same experimental conditions as in Fig. 1. Lower traces: synthetic spectra, calculated at the same experimental conditions using the line lists generated in this work. The observed and synthetic spectra are in absorbance (-ln(I/I0)) and
shifted vertically for clarity.
Fig. 4. Portion of the observed and calculated spectra of 37ClNO2, showing the region of the Q
branch of the ν2 fundamental band. Upper trace: observed spectrum with the same experimental
Fig. 5. Portion of the observed and calculated spectra of 35ClNO2, showing the region of the Q
branch of the 2ν6 overtone band.
Upper trace: observed spectrum with the same experimental conditions as in Fig. 1. Lower trace: synthetic spectrum calculated as in Fig. 3.
Fig. 6. Portion of the observed and calculated spectra of 35ClNO2, showing the region of the Q
branch of the 2ν3 overtone band. Upper trace: observed spectrum with the same experimental