HAL Id: hal-00296506
https://hal.archives-ouvertes.fr/hal-00296506
Submitted on 26 Mar 2008
HAL is a multi-disciplinary open access
archive for the deposit and dissemination of
sci-entific research documents, whether they are
pub-lished or not. The documents may come from
teaching and research institutions in France or
abroad, or from public or private research centers.
L’archive ouverte pluridisciplinaire HAL, est
destinée au dépôt et à la diffusion de documents
scientifiques de niveau recherche, publiés ou non,
émanant des établissements d’enseignement et de
recherche français ou étrangers, des laboratoires
publics ou privés.
Comparison of UV-RSS spectral measurements and
TUV model runs for clear skies for the May 2003 ARM
aerosol intensive observation period
J. J. Michalsky, P. W. Kiedron
To cite this version:
J. J. Michalsky, P. W. Kiedron. Comparison of UV-RSS spectral measurements and TUV model runs
for clear skies for the May 2003 ARM aerosol intensive observation period. Atmospheric Chemistry
and Physics, European Geosciences Union, 2008, 8 (6), pp.1813-1821. �hal-00296506�
www.atmos-chem-phys.net/8/1813/2008/ © Author(s) 2008. This work is distributed under the Creative Commons Attribution 3.0 License.
Chemistry
and Physics
Comparison of UV-RSS spectral measurements and TUV model
runs for clear skies for the May 2003 ARM aerosol intensive
observation period
J. J. Michalsky1and P. W. Kiedron2
1National Oceanic and Atmospheric Administration, Earth System Res. Lab., 325 Broadway, Boulder, Colorado, 80305, USA
2Cooperative Inst. for Res. in Environmental Sciences, Univ. of Colorado, 325 Broadway, Boulder, Colorado, 80305, USA
Received: 15 November 2007 – Published in Atmos. Chem. Phys. Discuss.: 28 November 2007 Revised: 19 February 2008 – Accepted: 29 February 2008 – Published: 26 March 2008
Abstract. The first successful deployment of the fully-operational ultraviolet rotating shadow-band spectrora-diometer occurred during the May 2003 US Department of Energy’s Atmospheric Radiation Measurement program’s Aerosol Intensive Observation Period. The aerosol proper-ties in the visible range were characterized using redundant measurements with several instruments to determine the col-umn aerosol optical depth, the single scattering albedo, and the asymmetry parameter needed as input for radiative trans-fer calculations of the downwelling direct normal and diffuse horizontal solar irradiance in clear-sky conditions. The Tro-pospheric Ultraviolet and Visible (TUV) radiative transfer model developed by Madronich and his colleagues at the US National Center for Atmospheric Research was used for the calculations of the spectral irradiance between 300–360 nm. Since there are few ultraviolet measurements of aerosol prop-erties, most of the input aerosol data for the radiative transfer model are based on the assumption that UV input parame-ters can be extrapolated from the visible portion of the trum. Disagreements among available extraterrestrial spec-tra, which are discussed briefly, suggested that instead of comparing irradiances, measured and modeled spectral trans-mittances between 300–360 nm should be compared for the seven cases studied. Transmittance was calculated by tak-ing the ratios of the measured irradiances to the Langley-derived, top-of-the-atmosphere irradiances. The cases stud-ied included low to moderate aerosol loads and low to high solar-zenith angles. A procedure for retrieving single scat-tering albedo in the ultraviolet based on the comparisons of direct and diffuse transmittance is outlined.
Correspondence to: J. J. Michalsky
1 Introduction
Weihs and Webb (1997) compared their radiative transfer model for global horizontal irradiance with measurements made in Greece, where the aerosol burden was high, and
in Switzerland in clear mountain air. They used aerosol
optical depths derived from sunphotometer data and direct beam irradiance measurements. They derived single scat-tering albedo and ground reflectance from direct to global irradiance ratios. The agreement with the Greek ments was within 5–10% and 5% for the Swiss measure-ments. Mayer et al. (1997) compared over 1200 measured ultraviolet (UV) spectra with their UVSPEC model, the UV forerunner of libRadtran (Mayer and Kylling, 2005). Their comparisons of direct normal and global horizontal irradi-ance between 295–400 nm ranged between 2 and 11% agree-ment using only ozone and a simple wavelength-dependent function of aerosol optical depth (AOD) as input. AOD was derived from their direct normal irradiance data. More re-cently Kazantzidis et al. (2001) used the radiative transfer model TUV (Madronich, 1993) to compare 24 spectra of global horizontal irradiance between 285 and 365 nm mea-sured during the Standardization of Ultraviolet Spectrora-diometry in Preparation of a European Network (SUSPEN) campaign. In this comparison the ozone and AOD wave-length dependence were obtained by fitting to the direct spec-tral irradiance measurements that accompanied the global
measurements. Agreement at the 5% level was obtained
above 305 nm.
The Atmospheric Radiation Measurement (ARM)
pro-gram site in northern Oklahoma, USA, (Latitude 36.605◦N,
Longitude 97.485◦W) hosted the May 2003 aerosol
inten-sive observation period (AIOP). A goal of this study was to measure aerosol optical properties with multiple techniques
1814 J. J. Michalsky and P. W. Kiedron: UV spectral model and measurement comparisons to assess the level of agreement using different methods.
Us-ing these measurements as inputs to models, closure between six radiative transfer codes and measurements of broadband shortwave (solar) direct normal and diffuse horizontal irra-diance on clear days was tested (Michalsky et al., 2006). Broadband measurements and models in this study showed significant improvement in agreement compared to earlier studies. In earlier studies there was agreement between ra-diative transfer models of direct irradiance and measure-ments, however, diffuse models consistently yielded higher irradiance than measurements (e.g., Halthore and Schwartz, 2000; Halthore et al., 2004). The improvement in the Michal-sky et al. (2006) study was attributed to a more realistic spec-ification of the asymmetry parameter and a careful specifi-cation of spectral albedo (surface reflectivity) at the time of the measurement. Better shortwave, diffuse irradiance mea-surements, than in previous studies, also contributed to these validation efforts. This study compares measurements and models spectrally in the UV with a focus on the sensitivity of the agreement to aerosol properties.
In the next section the UV spectral instrument used for the measurements is briefly described. The TUV model inputs used are delineated in Sect. 3. Some of the recently pub-lished extraterrestrial spectra available for use with the model are discussed in Sect. 4. Comparisons of modeled and mea-sured direct horizontal and diffuse horizontal transmittances are presented in Sect. 5 for seven clear-sky cases selected from the AIOP. The results are discussed in Sect. 6 along with a summary and prospectus for follow on studies.
2 Spectral irradiance measurements
Kouremeti et al. (2007) described a new CCD spectrograph that they have developed for measuring direct normal solar irradiance and sky radiance in the UV. They outline other re-cent efforts to develop CCD spectrographs for use in actinic flux and sky radiance measurements. The main advantage of CCD spectrographs is their ability to obtain spectra at all UV wavelengths simultaneously and quickly. However, two scanning spectrometers can be coupled to greatly reduce the stray light, while the reduction of stray light in the CCD spec-trograph is a function of their size and the scattering proper-ties of the dispersive element.
The ultraviolet rotating shadow-band spectroradiometer (UV-RSS) is described in considerable detail by Kiedron et al. (2002). Briefly, it is a CCD spectrograph with an input diffuser optic that approximates a Lambertian receiver. The instrument takes measurements of the total horizontal irra-diance at the beginning of each minute and then moves a band to block the sky in two positions near and symmet-rically positioned on either side of the sun with respect to the diffuser. A measurement is taken between the two side-band measurements with the sunlight to the diffuser com-pletely blocked. The four measurements are used, along with
a laboratory-measured angular response function to derive angular-response-corrected direct normal and diffuse hori-zontal irradiance. Because the dispersion results from two prisms in tandem, the spectral resolution of the UV-RSS varies between about 0.25 and 0.45 nm for wavelengths be-tween 300–360 nm. The use of tandem prisms as dispersive elements and the relatively large size of the UV-RSS spec-trograph improve the stray light rejection by two orders of magnitude relative to a grating instrument of similar size and resolution.
3 The TUV radiative transfer model and inputs
The Tropospheric Ultraviolet and Visible (TUV) radiative transfer model was developed by Madronich and his col-leagues at the US National Center for Atmospheric Research http://cprm.acd.ucar.edu/Models/TUV/ (Madronich, 1993). Version 4.4 was used for these calculations. The altitude pro-file for ozone is taken from the U.S. Standard Atmosphere (1976), and the aerosol profile is from Elterman (1968). Eight streams were specified in the discrete ordinate radia-tive transfer algorithm (Stamnes et al., 1988) used in the TUV model. The code was modified to allow the solar trum of Bernhard et al. (2004) to be incorporated. The spec-tral resolution of the input solar spectrum is 0.05 nm, and the model was run at 0.1 nm resolution over the 300–360 nm range. This resolution is sufficient to produce multiple model points within each resolution element of the UV-RSS allow-ing a better model comparison to the measurements.
A synopsis of the ground-based, in situ aerosol observ-ing system (AOS) used in the ARM program is given in Michalsky et al. (2006). From AOS nephelometer and par-ticle soot absorption photometer measurements, single
scat-tering albedo (̟o) at 550 nm is derived with an uncertainty
that ranges between 0.036 and 0.049 when measuring high
and low aerosol scattering cases, respectively.
Asymme-try parameter (g) is derived from two nephelometer mea-surements. One of these is operated at both a low and a high humidity level to assess the effect of water vapor on the growth of the aerosol and corrected to ambient humid-ity. Kassianov et al. (2007) compared single scattering albe-dos and asymmetry parameters at 550 nm from two remote sensing instruments and two in situ instrument suites for this same AIOP. The typical range in the four measurements of single scattering albedo was around 0.05. The typical range in the asymmetry parameter was around 0.07. Al-though these alternatives exist for data input, the ground-based in situ measurements of the AOS at the ARM site are used here. Column aerosol optical depths are measured with a normal incidence multi-filter radiometer (NIMFR) at five wavelengths from 415 to 870 nm and with a UV multi-filter rotating shadowband radiometer (UV-MFRSR) at six wavelengths between 305 and 368 nm. Only three of these 11 wavelengths are used to determine the wavelength
Table 1. Input parameters used in the TUV Model runs.
Date LT Solar-zenith-angle Ozone ̟o g α τ
(2003) (degrees) (DU) (550 nm) (550 nm) (550 nm) 11 May 09:20 44.9 320 0.971 0.573 1.047 0.078 11 May 12:30 18.7 320 0.944 0.582 0.690 0.084 11 May 15:00 38.5 320 0.957 0.552 0.606 0.070 12 May 07:30 66.7 328 0.883 0.572 1.250 0.074 12 May 09:50 38.9 328 0.934 0.562 1.308 0.077 22 May 08:00 59.6 326 0.939 0.660 1.080 0.180 28 May 18:00 72.1 322 0.951 0.619 1.108 0.183
dependence of the aerosol optical depth in the UV between 300 and 360 nm. 332-, 415-, and 500-nm filter data fit to a log(AOD) versus log(wavelength) plot are used to inter-polate and extrainter-polate the optical depth over the UV-RSS wavelengths. Ozone is an average of data obtained from the SBUV web site http://disc.sci.gsfc.nasa.gov/data/datapool/ TOMS/DVD-ROMs/, from the GOME and SCIAMACHY web site www.temis.nl/protocols/O3total.html, and from the web site http://toms.gsfc.nasa.gov/ for TOMS. Ozone re-trieved from a ground-based UV-MFRSR was also used in the average and was obtained from http://uvb.nrel.colostate. edu/. However, average ozone column for the four days in this analysis only varied between 320 and 328 Dobson units. Although the spectral albedo was measured at the same wavelengths as the NIMFR, namely, 415, 500, 615, 673, 870, and 940 nm, and over the two predominant surface types sur-rounding the facility, pasture and wheat fields, this informa-tion was not used for the UV calculainforma-tions. Instead, an aver-aged value of 0.015 based on the over-grass measurements of Feister and Grewe (1995) and McKenzie et al. (1996) was assumed. The input data used for the seven runs of TUV are summarized in Table 1.
4 Extraterrestrial spectra
The literature contains several choices for the extraterrestrial (ET) solar spectrum in this range. A commonly-used, very high spectral resolution synthetic spectrum is that of Ku-rucz (1992). For instance, the well-known codes LBLRTM (Clough et al., 1992) and MODTRAN (Anderson et al., 2000) use this as their default extraterrestrial spectrum. The Gueymard (2004) spectrum is a composite of four spectra for the wavelengths between 300 and 360 nm. While it is heavily weighted (60%) by the ATLAS-3 spectrum (Van-Hoosier, 1996), it has contributions from three other tra in this range. The Bernhard et al. (2004) solar spec-trum uses the ATLAS-3 specspec-trum in a process that normal-izes the higher resolution Kitt Peak spectrum of Kurucz et al. (1984) in order to produce a high resolution ET spectrum in the UV and part of the visible spectrum (up to 630 nm).
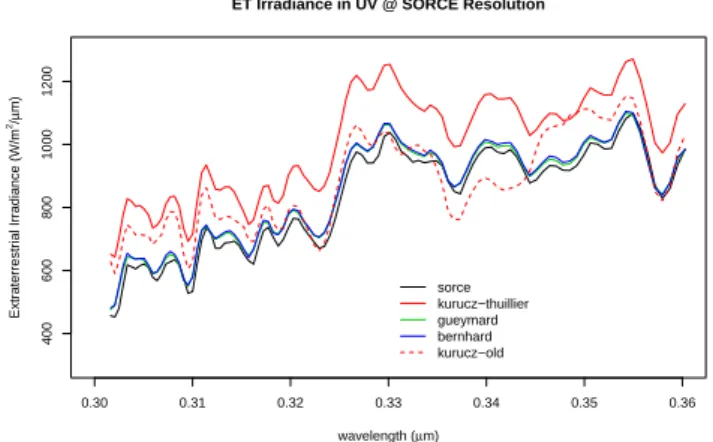
0.30 0.31 0.32 0.33 0.34 0.35 0.36 400 600 800 1000 1200 wavelength (µm) Extraterrestrial Irradiance (W/ m 2/µ m) sorce kurucz−thuillier gueymard bernhard kurucz−old ET Irradiance in UV @ SORCE Resolution
Fig. 1. Five recent extraterrestrial solar spectra for the ultraviolet wavelengths compared at SORCE spectral resolution.
The Kurucz-Thuillier ET spectrum is available at the web site http://kurucz.harvard.edu/sun/IRRADIANCE2005/. It is a Kitt Peak spectrum normalized to Thuillier et al. (2004). Jerry Harder (personal communication) provided the SIM reference spectrum as of 14 August 2007. It is based on multiple measurements made by the Solar Irradiance Mon-itor (SIM) on the SORCE satellite (Harder et al., 2005a, b, c; Rottman et al., 2005).
In Fig. 1 the SIM reference spectrum for the UV is plot-ted with over-plots of the four other spectra ciplot-ted above af-ter convolving these higher resolution spectra with the SIM trapezoidal slit functions. The synthetic Kurucz-old spec-trum in the figure shows little correlation with the rest. The Kurucz-Thullier spectrum is considerably higher in this re-gion of the spectrum than the other spectra, however, the cause is unclear, and upgrades to this spectrum, alluded to at the web site have not yet been made. The SORCE spec-trum is the lowest, but is basically a small, scale factor from the Bernhard and Gueymard spectra. These latter two spec-tra match most closely of the four, primarily because they are both largely based on the ATLAS-3 spectrum. These differ-ences and the continuing problem of choosing a reference ET spectrum led to the approach for comparing spectra outlined in the next section.
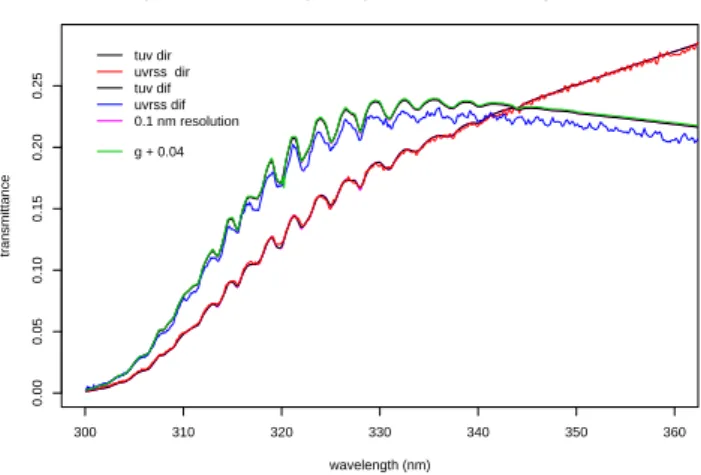
1816 J. J. Michalsky and P. W. Kiedron: UV spectral model and measurement comparisons 300 310 320 330 340 350 360 0.00 0.05 0.10 0.15 0.20 0.25 wavelength (nm) transmittance tuv dir uvrss dir tuv dif uvrss dif 0.1 nm resolution g + 0.04
11 May 2003 @ 09:20; AOD(550 nm) = 0.078; SZA = 44.9 degs; SSA = 0.971
Fig. 2. UV-RSS-measured direct horizontal and diffuse horizon-tal transmittances (red and blue, respectively) compared to modeled UV-RSS slit function-convolved transmittances (black) for a clear sky with the input parameters given in the title. The direct horizon-tal agreement suggests that extinction is well specified. The high diffuse model indicates either asymmetry parameter, single scatter-ing albedo, and/or ground reflectivity is too high. The magenta line is the model output at 0.1 nm spectral resolution. The green line indicates a negligibly higher diffuse calculated with an extrapolated asymmetry parameter for the UV rather than the measured 550-nm asymmetry parameter.
5 Comparisons of direct and diffuse transmittances
The UV-RSS measures direct irradiance, which, in principle, allows the calculation of the top-of-atmosphere (TOA) re-sponse at the UV-RSS spectral resolution through the Lang-ley analysis method. Kiedron et al. (2006) examines the spe-cial care one needs to observe in performing Langley anal-ysis in the UV. The problem is that small changes in ozone column or pressure during the collection of data for the Lan-gley plot can noticeably affect the retrieved TOA response. Specifically, the Langley analysis was modified.
The following equation is generally used to derive the top-of-atmosphere response of the instrument
ln(V ) = ln(Vo) −
X
i
τi∗mi, (1)
where V is the measured response, Vo is the
top-of-atmosphere response (the calibration of the instrument that we are attempting to derive with a Langley analysis), and the sum of products of optical depth τ and air mass m is for Rayleigh scattering, ozone absorption, and aerosol ex-tinction. For the UV-RSS the equation was modified as fol-lows,
ln(V ) + aO3∗DUest∗mO3+τR(P ) ∗ mR= ln(Vo)−τaer∗maer, (2)
where aO3 is the absorption coefficient for ozone, DUestis
an independent estimate of the ozone abundance in Dobson
units, τR is the Rayleigh optical depth as a function of
pres-sure P , τaeris the aerosol optical depth, and the air masses
mXare slightly different for ozone, Rayleigh, and aerosol.
Using this approach, the Rayleigh optical depth changes due to pressure fluctuations are removed at each point and nominal ozone optical depth is subtracted. Thus, the left-hand side is insensitive to pressure variations, and the dif-ferences caused by ozone and aerosol air mass difdif-ferences is significantly reduced. With this approach, transmittances for the UV are calculated by taking the ratio of the measured responses to the extraterrestrial responses. Figure 2 is a plot of the transmittance of the direct and the diffuse irradiances. The direct irradiance that falls on a horizontal plane at the Earth’s surface is divided by the direct beam irradiance at the top of the atmosphere multiplied by the cosine of the ap-parent solar-zenith angle. The diffuse horizontal irradiance at the surface is similarly divided by the direct beam irradi-ance at the top of the atmosphere multiplied by the cosine of the apparent solar-zenith angle. The measured direct trans-mittance is in red and the measured diffuse transtrans-mittance is in blue. The model results are plotted as black lines after passing the UV-RSS slit function over the 0.1 nm resolution model output. The magenta lines, which are difficult to dis-cern, are plotted over the black lines at the original 0.1 nm model output resolution. Obviously, there are minor and, insignificant, differences. In the plots that follow only the model outputs convolved with the UV-RSS slit functions will be plotted.
The direct transmittance model and measurements agree well within the uncertainty of the measurements throughout the spectrum shown. The mean bias difference is less than 0.1%. This suggests that the extinction components, that is, Rayleigh scattering, ozone absorption, and aerosol extinction are correctly specified in the model. The fact that the diffuse model is higher than the measurements with a mean bias of 4.4% suggests that the surface albedo, the single scattering
albedo (̟o), and/or the asymmetry parameter (g) may not
be correct for the UV. Recall that ̟o and g are measured
only at 550 nm and albedo is assumed, not measured, for the UV.
As mentioned in Sect. 3, measurements of green vegeta-tion indicate a rather low UV albedo (Feister and Grewe, 1995; McKenzie et al., 1996), therefore, we expect the as-sumed albedo for the TUV computations to be about 0.015 and wavelength independent. The remaining variables that are unknown in the UV are single scattering albedo and asymmetry parameter. d’Almeida et al. (1991) calculated asymmetry parameters for typical clean continental and av-erage continental aerosols. They find that compared to the asymmetry parameter at 550 nm that the asymmetry param-eter in the UV at 350 nm is about 0.03 higher for both des-ignations of continental aerosols. This is also suggested by the measurements for the typical springtime wavelength de-pendence of asymmetry parameter at the ARM site (Fiebig and Ogren, 2005). The extrapolation based on 450, 550, and
300 310 320 330 340 350 360 0.00 0.05 0.10 0.15 0.20 0.25 wavelength (nm) transmittance tuv dir uvrss dir tuv dif uvrss dif 300 310 320 330 340 350 360 0.00 0.05 0.10 0.15 0.20 0.25 wavelength (nm) transmittance tuv dir uvrss dir tuv dif uvrss dif 300 310 320 330 340 350 360 0.00 0.05 0.10 0.15 0.20 0.25 wavelength (nm) transmittance tuv dir uvrss dir tuv dif uvrss dif
Same as Figure 2 except SSA = 0.901, 0.871, 0.841
Fig. 3. Same as Fig. 2 except the single scattering albedo was low-ered from the 550-nm value of 0.971 to improve the agreement. If we were to assume that surface reflectance and asymmetry param-eter were correct, then single scattering albedo could be retrieved with an uncertainty of around ±0.03 for this low aerosol case.
650 nm calculations of asymmetry parameter suggests that values about 0.04 higher in the UV than the 550 nm measure-ments are appropriate. The green line in Fig. 2 indicates the effect on the diffuse irradiance of an increase of the asymme-try parameter from 0.573 to 0.613. As expected, the higher asymmetry parameter implies an increase in forward scatter-ing toward the surface that results in an increase in diffuse surface irradiance, however, the 0.5% mean bias increase is minor compared to single scattering albedo changes that will be discussed next.
Figure 3 contains the same measurements as in Fig. 2, but the model now uses lower single scattering albedos. There is no effect on the direct model results as extinction of the direct beam is the same. The lower single scattering albe-dos give model results that more closely match the diffuse horizontal transmission measurements, with a single scat-tering albedo of 0.871 giving a mean bias difference only
0.2% higher than the measurements. The two other ̟o’s
dif-fer by ±0.03 from 0.871 and give a bias 1.5% and −1.0% relative to the measurements. Without a formal uncertainty
analysis this suggests that ̟o for low optical depth
condi-tions (≤0.10@550 nm) may be retrieved with a significantly smaller uncertainty than past studies have suggested (Petters et al., 2003; Dubovik et al., 2000). The actual uncertainty in single scattering albedo depends on the uncertainty that we attach to the determinations of the surface reflectance and the asymmetry parameter, which for this study were not mea-sured, but have plausible, assumed values in the UV.
Figure 4 is the transmittance plot for higher sun on the same day as in Fig. 2. The direct UV exceeds the diffuse at all wavelengths. Again the direct transmittance model and measurements agree to within 0.4% and the diffuse transmit-tance model is higher than the measurement by 2.6%.
Low-300 310 320 330 340 350 360 0.0 0.1 0.2 0.3 0.4 0.5 wavelength (nm) transmittance tuv dir uvrss dir tuv dif uvrss dif
11 May 2003 @ 12:30; AOD(550 nm) = 0.084; SZA = 18.7 degs; SSA = 0.944
ssa = 0.874
Fig. 4. Transmittances for a high sun on the same day as Fig. 2 – the direct transmittances again agree and the diffuse transmittances agree after lowering the single scattering albedo by 0.07 for the UV compared to the measured 550-nm value of 0.944.
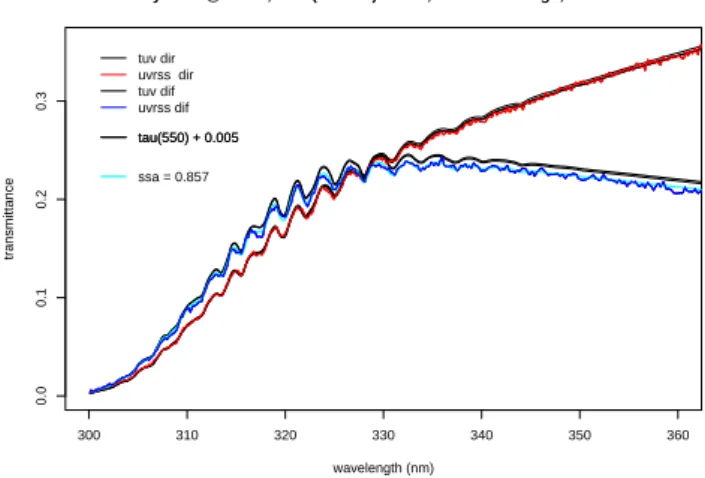
300 310 320 330 340 350 360 0.0 0.1 0.2 0.3 wavelength (nm) transmittance tuv dir uvrss dir tuv dif uvrss dif
11 May 2003 @ 15:00; AOD(550 nm) = 0.07; SZA = 38.5 degs; SSA = 0.957
tau(550) + 0.005 tau(550) + 0.005
ssa = 0.857
Fig. 5. An afternoon case on the same day – the direct transmit-tances agree only after adding 0.005 to the aerosol optical depth at 550 nm and assuming the same wavelength dependence. After this adjustment the single scattering albedo has to be lowered by about 0.1 to achieve diffuse transmittance agreement.
ering the ̟oby 0.07 improves the diffuse horizontal model
and measurement agreement at all wavelengths to within 0.2%. This is a slightly smaller decrease in single scatter-ing albedo than in the previous figure. In Fig. 5 the situation is slightly different. For the afternoon of the same day the direct transmittance model is higher than the measurement by 1.0% (note the thin black line compared to the red line). Adding just 0.005 in aerosol optical depth to the 550-nm op-tical depth and retaining the same wavelength dependence improves the agreement to within 0.2% as indicated with the thick black model line. (Of course, a bias in the measure-ments could explain the disagreement, as well.) This slightly raises the diffuse model from being 3.1% to 3.7% high (thick
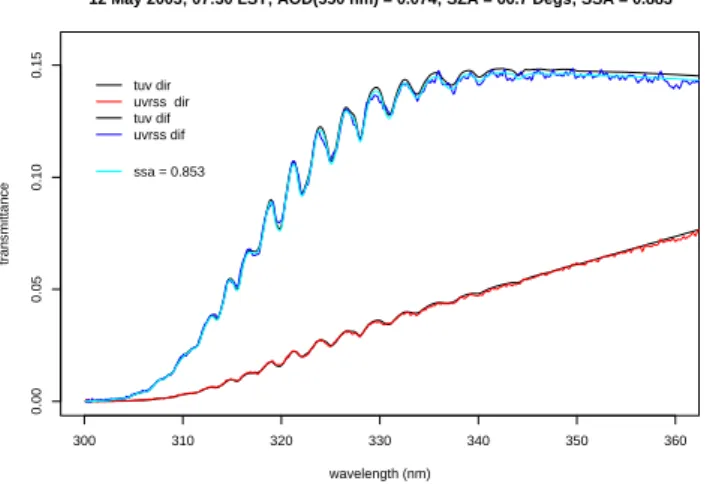
1818 J. J. Michalsky and P. W. Kiedron: UV spectral model and measurement comparisons 300 310 320 330 340 350 360 0.00 0.05 0.10 0.15 wavelength (nm) transmittance tuv dir uvrss dir tuv dif uvrss dif
12 May 2003; 07:30 LST; AOD(550 nm) = 0.074; SZA = 66.7 Degs; SSA = 0.883
ssa = 0.853
Fig. 6. Low-sun case on the next morning – the direct transmit-tances agree, and the model single scattering albedo has to be ad-justed down by only 0.03 to reach agreement with the measured diffuse transmittance. 300 310 320 330 340 350 360 0.00 0.05 0.10 0.15 0.20 0.25 0.30 0.35 wavelength (nm) transmittance tuv dir uvrss dir tuv dif uvrss dif
12 May 2003; 09:50 LST; AOD(550 nm) = 0.077; SZA = 38.9 Degs; SSA = 0.934
ssa = 0.894
Fig. 7. Same morning as in Fig. 6 – nearly the same situation with a single scattering albedo adjustment of 0.04 versus 0.03 as in Fig. 6.
black line is higher than thin black line in the diffuse
com-parison), and a change in the ̟oof 0.1 is required to match
measurements to within 0.4%. In Fig. 6 the transmittances from the early morning of the next day indicate good agree-ment (within 0.9%) for the direct model and measureagree-ment,
and a modest decrease of 0.03 in the ̟o brings the diffuse
model in line with the measurement from being high by 1.2% to being within 0.1% agreement. The same is true for a time later in the morning of the same day shown in Fig. 7, where
a lower ̟oof 0.04 improves the agreement from the diffuse
model being high by 2.1% to agreeing within 0.3%.
In Figs. 8 and 9 the aerosol optical depths are more than twice that for the earlier figures. In Fig. 8 the direct model is too high by 1.9% and an additional aerosol optical depth at 550 nm of 0.007, still a modest increase, is required to im-prove agreement to within 0.5%. In Fig. 8 the diffuse
trans-300 310 320 330 340 350 360 0.00 0.05 0.10 0.15 0.20 wavelength (nm) transmittance tuv dir uvrss dir tuv dif uvrss dif
22 May 2003; 08:00 LST; AOD = 0.18; SZA = 59.6 Degs; SSA = 0.939
tau(550) + 0.007 tau(550) + 0.007 ssa = 0.954
Fig. 8. A higher aerosol case – this is similar to Fig. 5, but
aerosol was adjusted upwards by 0.007 to achieve direct transmit-tance agreement. This improved the diffuse transmittransmit-tance agree-ment, however, in this case, the single scattering albedo had to be raised (by 0.015) to get better agreement.
300 310 320 330 340 350 360 0.00 0.02 0.04 0.06 0.08 0.10 0.12 0.14 wavelength (nm) transmittance tuv dir uvrss dir tuv dif uvrss dif
28 May 2003; 18:00 LST; AOD = 0.183; SZA = 72.1 Degs; SSA = 0.951
tau(550) + 0.017 tau(550) + 0.017 ssa = 0.901
Fig. 9. Similar to Fig. 8 for another high aerosol case – 0.017 had to be added to the aerosol optical depth at 550 nm with the same wave-length dependence to obtain agreement in the direct transmittance. After this adjustment, the single scattering albedo was lowered by 0.05 to improve the diffuse transmittance comparison.
mittance model is too low as opposed to too high as in the earlier cases. The additional aerosol improves the agreement between diffuse model and measurement from the model be-ing low by 3.5% to bebe-ing low by 1.2%. In this case the
̟ohas to be increased by only 0.015 to improve model and
measurement agreement to within 0.2%. In Fig. 9 the di-rect model is again high by 9.7%, and an increase in optical depth of 0.017 is needed to improve agreement with the mea-surements within 0.1%. Note that the increased aerosol does not noticeably change the diffuse transmittance (4.6% high to 4.4% high) as the thick black model line completely covers the thin diffuse model transmittance line for the lower aerosol
amount. Decreasing the ̟oby 0.05 brings the diffuse model
and measurement into agreement to within 0.4%.
6 Discussion
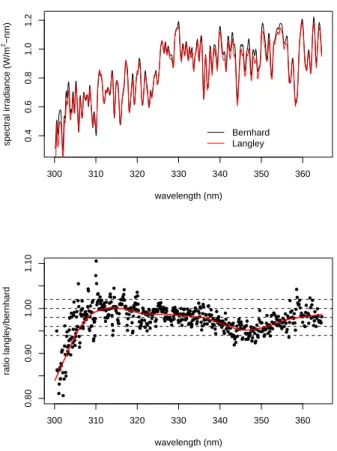
The top of Fig. 10 is a plot of the Bernhard et al. (2004) ex-traterrestrial (ET) spectrum at the UV-RSS resolution. Plot-ted in red is the extraterrestrial spectrum retrieved from the UV-RSS. The UV-RSS is calibrated with a spectral lamp in a portable field calibrator (LI-COR 1800–1802) traceable to NIST lamps (Kiedron et al., 1999). However, the transfer of calibration from NIST lamps was performed five years earlier. Langley plots at every resolution element produce a top of the atmosphere irradiance. The average of the only three Langleys that were deemed useful during this short de-ployment is plotted in Fig. 10 and identified as the Langley extraterrestrial spectrum. The overall match in spectral fea-tures is qualitatively good. If one examines different parts of the spectrum, it appears that the resolution of the two spectra may not be the same throughout the 300–360 nm range. The slit functions of the UV-RSS across the spectrum need further examination as they may have changed from the initial labo-ratory characterization. The bottom of Fig. 10 is the ratio of the two spectra point-by-point and then smoothed (red line) with a lowess fit. The intent here is not to derive an extrater-restrial spectrum with such little data, but it does appear to be plausible with a better calibration and characterization of the instrument at a more appropriate site than the plains of Ok-lahoma. Furthermore, given the uncertainty in the Bernhard ET spectrum and the uncertainty in the lamp-calibrated UV-RSS, this clearly indicates that matching transmittances is a better approach to comparing models and measurements that comparing irradiances. By the way, a much more appropriate effort at deriving the extraterrestrial UV irradiance from the surface of the Earth is described in the paper by Gr¨obner and Kerr (2001).
Overall the aerosol extinction prescribed by the fit to three wavelengths at 332, 415, and 500 nm gave acceptable trans-mission. There were changes for three of the seven cases, but these were modest and within the measurement uncertainties. The ozone bands fit the direct transmittance measurements well, and, therefore, indicate that the Dobson values used were about right. The diffuse ozone bands did not fit quite as well at some of the shorter wavelengths suggesting that the vertical distribution of the aerosol may differ from that used in the TUV model, or that the ozone fraction in the tropo-sphere assigned by the model differs from the actual amount present.
For constant refractive index Mie theory suggests a mod-erate increase in g in the UV compared to the visible and
a moderate decrease in ̟o in the UV compared to the
vis-ible value. In this study about half of the cases suggested
̟oretrievals in the UV that were consistent with Mie theory
while the other retrievals were lower. This hints at a possible
300 310 320 330 340 350 360 0.4 0.6 0.8 1.0 1.2 wavelength (nm) spectral irradiance (W/ m 2−nm) Bernhard Langley
ET Spectra at UV−RSS Resolution from Langleys and Bernhard
● ●● ● ● ● ● ● ● ●● ● ●● ● ● ● ● ● ● ● ● ● ● ● ● ●● ● ● ● ● ● ● ● ● ● ● ● ● ● ● ● ● ● ● ● ● ●● ● ● ● ● ● ● ● ● ● ● ● ● ● ● ● ● ● ●● ● ●● ● ● ● ● ● ● ●● ● ● ● ● ● ● ● ● ● ● ● ● ● ● ● ● ● ● ● ● ● ● ● ● ●● ●● ● ●● ● ● ● ● ● ● ● ● ●●●● ● ● ● ● ● ● ● ● ● ●●● ● ● ●●● ● ● ● ● ● ● ● ● ● ●●● ●●●● ● ●●● ● ● ●●●●●●● ● ● ● ● ● ●●●● ● ● ● ● ● ● ● ● ●●●● ● ● ● ● ● ●● ● ● ● ● ● ● ● ● ● ● ● ● ●●●● ● ● ● ●●●● ● ●● ●● ● ● ● ●●●● ● ● ● ●● ●● ●●●●●● ● ● ● ●●● ● ● ●● ●● ● ● ●●●●●● ● ●● ●●● ● ●●●●●●●●● ● ● ●● ●● ● ●● ●●●●● ● ● ● ● ● ● ● ● ● ● ●●● ● ● ● ●●●● ● ● ●● ●●● ● ● ●● ●● ●● ●●● ● ●●● ● ● ● ● ● ● ● ●● ● ● ● ● ●● ●● ● ● ● ● ● ● ●● ● ● ● ● ● ● ●●● ● ● ● ● ● ● ● ● ● ●●● ● ●● ● ● ● ● ● ● ● ●●● ● ●●● ● ●● ●● ●● ● ● ●● ● ● ● ● ● ●● ● ● ● ● ● ● ● ● ●●● ● ● ● ● ● ● ●●●● ● ● ● ● ● ●● ● ● ● ● ● ●● ● ● ● ● ● ●● ●●● ● ● ● ● ● ● ● ● ●● ● ● ● ● ● ● ● ●● ● ● ● ● ● ●● ● ● ● ● ●● ●●● ● ● ● ● ●● ●● ● ● ● ● ● ● ● ● ● ● ● ● ● ● ● ● ●●● ● ● ● ● ● ●● ●● ● ● ● ●● ● ● ● ● ● ● ● ● ● ● ● ● ● ● ● ● ●●●●● ● 300 310 320 330 340 350 360 0.80 0.90 1.00 1.10 wavelength (nm) ratio langley/bernhard
Fig. 10. (top). The Bernhard extraterrestrial spectrum at UV-RSS spectral resolution in black. The UV-RSS extraterrestrial spec-trum using a NIST-traceable lamp calibration and Langley plot-extrapolations to the top of the atmosphere to derive the ET spec-trum in red. (Bottom) The ratio Langley/Bernhard at each UV-RSS resolution element (dots) and a lowess smoother through these ra-tios in red. Agreement is reasonable given the length of time since the last NIST lamp comparison and the small sample of Langley plots used for the extrapolations.
method for the detection of organics in the aerosol, which will require more study.
The next improvement in the retrieval of single scatter-ing albedo is to make an actual measurement of the sur-face reflectance (albedo) in the UV. At the beginning of this study a wavelength independent albedo for this wavelength
range of 0.034 was assumed. The retrieved ̟o using that
albedo had to be lowered by an additional 0.04 than that sug-gested by Fig. 3 to achieve diffuse agreement illustrating the importance of specifying the albedo correctly if we are to minimize our retrieval bias. Since the Feister and Grewe (1995) and McKenzie et al. (1996) work suggest that the 300–360 nm wavelength albedos are rather featureless and nearly constant, a broadband UV measurement should suf-fice. Since the asymmetry parameter has some effect on the diffuse transmittance, future efforts will try to narrow the un-certainty in the estimated asymmetry parameter. Rather than
1820 J. J. Michalsky and P. W. Kiedron: UV spectral model and measurement comparisons using an extrapolated or climatological behavior as in this
study, an effort to use retrieved sizes to estimate asymmetry parameter will be made. Based on measured surface albe-dos and better estimates of asymmetry parameter, a clear es-timate of retrieved single scattering albedo will be possible with proper assignments of transmittance uncertainties. Fur-ther efforts to retrieve trace species in the UV are contingent on carefully matching spectra that depend on a better under-standing of the actual UV-RSS slit functions during the time of the measurements.
Acknowledgements. The authors wish to thank P. Disterhoft for calibrating and maintaining the UV-RSS; S. Madronich for supplying the TUV model and advising us on aspects of using it; and A. Jefferson for providing and explaining the derivation of the aerosol scattering properties, namely the single scattering albedos
and asymmetry parameters used in this paper. M. van Weele
kindly supplied Mie code to calculate asymmetry parameter and single scattering albedo wavelength dependence. This work was supported by the US Department of Energy through its support of the Atmospheric Radiation Measurement program’s Atmospheric Climate Research Facility.
Edited by: J. Groebner
References
Anderson, G. P., Berk, A., Acharya, P. K., Matthew, M. W., Bern-stein, L. S., J. H.,, H. Dothe, Adler-Golden, S. M., Ratkowski, A. J., Felde, G. W., Gardner, J. A., Hoke, M. L., Richtsmeier, S. C., Pukall, B., Mello, J., and Jeong, L. S.: MODTRAN4: Ra-diative transfer modeling for remote sensing in algorithms for multispectral, hyperspectral, and ultraspectral imagery VI, edited by: Chen, S. and Descour, M. R., Proceedings of SPIE 4049-16, Orlando, Florida, 24 April 2000, 176–183, 2000.
Bernhard, G., Booth, C. R., and Ehramjian, J. C.: Version 2 data of the National Science Foundation’s Ultraviolet Radiation Mon-itoring Network: South Pole, J. Geophys. Res.-Atmos., 109, D21207, doi:10.1029/2004JD004937, 2004.
d’Almeida, G. A., Koepke, P., and Shettle, E. P.: Atmospheric Aerosols: Global Climatology and Radiative Characteristics, A. Deepak Publishing, Hampton, Virginia, USA, 1991.
Clough, S. A., Iacono, M. J., and Moncet, J.-L.: Line-by-line cal-culation of atmospheric fluxes and cooling rates: Application to water vapor, J. Geophys. Res., 97, 15 761–15 785, 1992. Dubovik, O., Smirnov, A., Holben, B. N., King, M. D.,
Kauf-man, Y. J., Eck, T. F., and Slutsker, I.: Accuracy assessments of aerosol optical properties retrieved from Aerosol Robotic Net-work (AERONET) Sun and sky radiance measurements, J. Geo-phys. Res.-Atmos., 105(D8), 9791–9806, 2000.
Elterman, L.: UV, Visible, and IR Attenuation for Altitudes to 50 km. Air Force Cambridge Research Laboratories, AFCRL-68-0153, Hanscom Field, Bedford, Massachuetts, USA, 1968. Feister, U. and Grewe, R.: Spectral albedo measurements in the UV
and visible region over different types of surfaces, Photochem. Photobiol., 62(4), 736–744, 1995.
Gr¨obner, J. and Kerr, J. B.: Ground-based determination of the spectral ultraviolet extraterrestrial solar irradiance: Providing a
link between space-based and ground-based solar UV measure-ments, J. Geophys. Res.-Atmos., 106(D7), 7211–7217, 2001. Gueymard, C. A.: The sun’s total and spectral irradiance for solar
energy applications and solar radiation models, Sol. Energy, 76, 423–453, 2004.
Halthore, R. N. and Schwartz, S. E.: Comparison of model-estimated and measured diffuse downward irradiance at sur-face in cloud-free skies, J. Geophys. Res.-Atmos., 105, 20 165– 20 177, 2000.
Halthore, R. N., Miller, M. A., Ogren, J. A., Sheridan, P. J., Slater, D. W., and Stoffel, T.: Further developments in closure experiments for diffuse irradiance under cloud-free skies at a continental site, Geophys. Res. Lett., 31, L07111, doi:10.1029/2003GL019102, 2004.
Harder, J., Lawrence, G., Fontenla, J., Rottman, G., and Woods, T.: The spectral irradiance monitor: Scientific requirements, in-strument design, and operation modes, Sol. Phys., 203, 141–167, 2005a.
Harder, J., Fontenla, J., Lawrence, G., Woods, T., and Rottman, G.: The spectral irradiance monitor: Measurement equations and calibration, Sol. Phys., 203, 169–203, 2005b.
Harder, J., Fontenla, J., White, O., Rottman, G., and Woods, T.: Solar spectral irradiance variability comparisons of the SORCE SIM instruments with monitors of solar activity and spectral syn-thesis, Memorie della Societa Astronomica Italiena, 76, 735– 742, 2005c.
Kazantzidis, A., Balis, D. S., Bais, A. F., Kazadzis, S., Galani, E., and Kosmidis, E.: Comparison of Model Calculations with Spec-tral UV Measurements during the SUSPEN Campaign: The Ef-fect of Aerosols, J. Atmos. Sci., 58, 1529–1539, 2001.
Kassianov, E. I., Flynn, C. J., Ackerman, T. P., and Barnard, J. C.: Aerosol single-scattering albedo and asymmetry parameter from MFRSR observations during the ARM Aerosol IOP 2003, At-mos. Chem. Phys., 7, 3341–3351, 2007,
http://www.atmos-chem-phys.net/7/3341/2007/.
Kiedron, P. W., Michalsky, J. J., Berndt, J. L., and Harrison, L. C.: Comparison of spectral irradiance standards used to calibrate shortwave radiometers and spectroradiometers, Appl. Optics, 38, 2432–2439, 1999.
Kiedron, P. W., Harrison, L. H., Berndt, J. L., Michalsky, J. J., and Beaubien, A. F.: Specifications and performance of UV rotating shadowband spectroradiometer (UV-RSS), Proceedings of SPIE, Vol. 4482, San Diego, California, 249–258, 2001.
Kiedron, P., Schlemmer, J., Slusser, J., and Disterhoft, P.: Vali-dation of ozone and aerosol retrieval methods with UV Rotat-ing Shadowband Spectroradiometer (RSS), ProceedRotat-ings of SPIE, Vol. 6362, Stockholm, Sweden, 636211-1–636211-12, 2006. Kouremeti, N., Bais, A., Kazandzis, S., Blumthaler, M., and
Schmitt, R.: A CCD spectrometer for direct solar irradiance and sky radiance measurements, in: Proceedings of the UV Con-ference “One Century of UV Radiation Research,” edited by: Gr¨obner, J., 18–20 September 2007, Davos, Switzerland, 55–56, 2007.
Kurucz, R. L., Furenlid, I., Brault, J., and Testerman, L.: Solar flux atlas from 296 to 1300 nm, National Solar Observatory Atlas No. 1, Harvard Univ. Press, Cambridge, Mass., available at: ftp: //ftp.noao.edu/fts/fluxatl/, 1984.
Kurucz, T. L.: Synthetic infrared spectra, Infrared Solar Physics, IAU Symp. 154, edited by: Rabin, D. M. and Jefferies, J.
T., Kluwer Acad. Publishers, Norwell, Massachuetts, 523–531, 1994.
Madronich, S.: The atmosphere and UV-B radiation at ground level. Environmental UV Photobiology, Plenum Press, 1–39, 1993. Mayer, B., Seckmeyer, G., and Kylling, A.: Systematic long-term
comparison of spectral UV measurements and UVSPEC mod-eling results, J. Geophys. Res.-Atmos., 102(D7), 8755–8768, doi:10.1029/97JD00240, 1997.
Mayer, B. and Kylling, A.: Technical note: The libRadtran software package for radiative transfer calculations – description and ex-amples of use, Atmos. Chem. Phys., 5, 1855–1877, 2005, http://www.atmos-chem-phys.net/5/1855/2005/.
McKenzie, R. L., Kotkamp, M., and Ireland, W.: Upwelling UV spectral irradiances and surface albedo measurements at Lauder, New Zealand, Geophys. Res. Lett., 23, 14, 1761–1764, 1996. Michalsky, J. J., Anderson, G. P., Barnard, J., Delamere, J.,
Guey-mard, C., Kato, S., Kiedron, P., McComiskey, A., and Ricchi-azzi, P.: Shortwave radiative closure studies for clear skies during the Atmospheric Radiation Measurement 2003 Aerosol Inten-sive Observation Period, J. Geophys. Res.-Atmos., 111, D14S90, doi:10.1029/2005JD006341, 2006.
Petters, J. L., Saxena, V. K., Slusser, J. R., Wenny, B. N., and Madronich, S.: Aerosol single scattering albedo retrieved from measurements of surface UV irradiance and a radia-tive transfer model, J. Geophys. Res.-Atmos., 108(D9), 4288, doi:10.1029/2002JD002360, 2003.
Rottman, G., Harder, J., Fontenla, J., Woods, T., White, O., and Lawrence, G.: The Spectral Irradiance Monitor (SIM): Early Ob-servations, Sol. Phys., 203, 205–224, 2005.
Stamnes, K., Tsay S. C., Wiscombe, W. J., and Jayaweera, K.: Nu-merically stable algorithm for discrete-ordinate-method raditive transfer in multiple scattering and emitting layered media, Appl. Optics, 27, 2502–2509, 1988.
Thuillier, G., Floyd, L., Woods, T. N., Cebula, R., Hilsenrath, E., Herse, M., and Labs, D.: Solar irradiance reference spectra, in: Solar Variability and its Effects on Climate, edited by: Pap, J. M. and Fox, P., Geophysical Monograph, 141, American Geophysi-cal Union, 171–194, 2004.
U.S. Standard Atmosphere: U.S. Government Printing Office,
Washington, D.C., 1976.
vanHoosier, M. E.: Solar ultraviolet spectral irradiance data with increased wavelength and irradiance accuracy, in: Ultraviolet At-mospheric and Space Remote Sensing: Methods and Instrumen-tation, edited by: Huffman, R. E. and Stergis, C. G., Proc., SPIE Int. Soc. Opt. Eng., 2831, 57–64, 1996.
Weihs, P. and Webb, A. R.: Accuracy of spectral UV model calcu-lations 2. Comparison of UV calcucalcu-lations with measurements, J. Geophys. Res.-Atmos., 102(D1), 1551–1560, 1997.
Wenny, B. N., Saxena, V. K., and Frederick, J. E.: Aerosol op-tical depth measurements and their impact on surface levels of ultraviolet-B radiation, J. Geophys. Res.-Atmos., 106(D15), 17 311–17 320, 2001.
![[PDF] Apostila de bootstrap 4 cours PDF [ES] | Cours Bootstrap](data:image/gif;base64,R0lGODlhAQABAIAAAP///wAAACH5BAEAAAAALAAAAAABAAEAAAICRAEAOw==)