HAL Id: hal-00297510
https://hal.archives-ouvertes.fr/hal-00297510
Submitted on 18 Feb 2005
HAL is a multi-disciplinary open access
archive for the deposit and dissemination of
sci-entific research documents, whether they are
pub-lished or not. The documents may come from
teaching and research institutions in France or
abroad, or from public or private research centers.
L’archive ouverte pluridisciplinaire HAL, est
destinée au dépôt et à la diffusion de documents
scientifiques de niveau recherche, publiés ou non,
émanant des établissements d’enseignement et de
recherche français ou étrangers, des laboratoires
publics ou privés.
the North Sea
C. van der Zee, L. Chou
To cite this version:
C. van der Zee, L. Chou. Seasonal cycling of phosphorus in the Southern Bight of the North Sea.
Biogeosciences, European Geosciences Union, 2005, 2 (1), pp.27-42. �hal-00297510�
www.biogeosciences.net/bg/2/27/ SRef-ID: 1726-4189/bg/2005-2-27 European Geosciences Union
Biogeosciences
Seasonal cycling of phosphorus in the Southern Bight of the North
Sea
C. van der Zee and L. Chou
Laboratoire d’Oc´eanographie Chimique et G´eochimie des Eaux, Universit´e Libre de Bruxelles, Campus de la Plaine – CP 208, Boulevard du Triomphe, B-1050 Brussels, Belgium
Received: 22 September 2004 – Published in Biogeosciences Discussions: 12 October 2004 Revised: 10 January 2005 – Accepted: 14 January 2005 – Published: 18 February 2005
Abstract. We have investigated the seasonal cycle of nutri-ents, chlorophyll a, dissolved organic nitrogen (DON), and dissolved and particulate organic carbon (DOC and POC) for 10 stations in the Belgian coastal zone. Special attention was given to phosphorus speciation, i.e. dissolved inorganic and organic phosphorus (DIP and DOP) and particulate inorganic and organic phosphorus (PIP and POP).
Spatial and temporal trends of the inorganic nutrients
and the organic species are discussed. The Belgian part
of the southern North Sea is strongly influenced by the river plumes of the Rhine, Meuse and Scheldt resulting in northeast-southwest salinity gradient. Extrapolation of win-ter nutrient and DOC concentrations versus salinity plots yielded zero-salinity values typical of the river Scheldt. The polyphosphate concentration did not show any temporal trend, whereas both the phosphate and the DOP concentra-tions exhibited distinct seasonal variaconcentra-tions. Silica or phos-phorus was the potential limiting nutrient for phytoplankton growth based on elemental ratios.
1 Introduction
The Southern Bight of the North Sea receives nutrients from domestic, industrial and agricultural wastewater discharge, river inputs and atmospheric deposition. Most of these nu-trients are linked to anthropogenic activities that have signif-icantly increased the riverine flux of nitrogen (N) and phos-phorus (P) to the coastal zones of the North Sea (North Sea Task Force, 1993). The principal land source of another ma-jor nutrient, dissolved silicate (Si), has remained constant as it is not influenced by human activity but through chemical weathering of silicate minerals. The flux of dissolved Si from the rivers that reaches the coastal areas, however, has
de-Correspondence to: C. van der Zee
(cvdzee@ulb.ac.be)
creased in some areas, for instance, from the Rhine (Conley et al., 1993 and references herein). As a consequence, the nu-trient ratios in the riverine flux to the coastal zone have dras-tically changed. This results in a concomitant modification of phytoplankton species composition and thus of the func-tioning of the coastal ecosystem. For example, a reduced im-portance of the diatom bloom and the frequent occurrence of massive Phaeocystis blooms have been observed (Lancelot et al., 1987).
Turner et al. (2003a, b) reviewed data for dissolved inor-ganic nitrogen (DIN), dissolved inorinor-ganic phosphate (DIP) and dissolved silicate in the world’s largest rivers in order to predict future aquatic nutrient limitations, assuming the predicted increase in fertilizer use (which has a N:P ratio of 26). The authors found that the coastal areas in north-ern Europe are most likely to have both P and Si limitation. Smith et al. (2003) compiled an extended database of nutri-ent loads from about 165 sites and found that even though the DIN and DIP follow different biogeochemical cycles, fluxes of DIN and DIP are tightly coupled with a constant ratio of about 18:1. At the Second International Conference on the Protection of the North Sea (in London, 1987), all countries surrounding the North Sea agreed on reducing the anthro-pogenic input of nutrients by 50% between 1985 and 1995 for areas where nutrients cause pollution (Parcom, 1988). The 50% reduction commitments by the North Sea border-ing states were mostly achieved for phosphorus, but reduc-tions for nitrogen were estimated to be on the order of 25% between 1985 and 1995 (Osparcom, 2000). Recently, Sko-gen et al. (2004) ran model scenarios for the years of 1988 and 1989 with reduced nutrient inputs from the rivers to the North Sea. Simulation results indicated that a 50% decrease in the N and P loadings would lead to a decline in the primary production by 10–30% in the southern North Sea. The model simulation using a reduction only in the P load suggested that P would limit the primary production in the southern North Sea, while N would be limiting in the northern North Sea.
N51º 51º30 N52º
E2º 2º30 E3º 3º30 E4º 4º30
NIEUWPOORT OOSTENDE ZEEBRUGGE Belgium The Netherlands 120 130 215 230 330 700 710 ZG02 780 B07 Scheldt N51º 51º30 N52º
E2º 2º30 E3º 3º30 E4º 4º30
NIEUWPOORT OOSTENDE ZEEBRUGGE Belgium The Netherlands 120 130 215 230 330 700 710 ZG02 780 B07 Scheldt
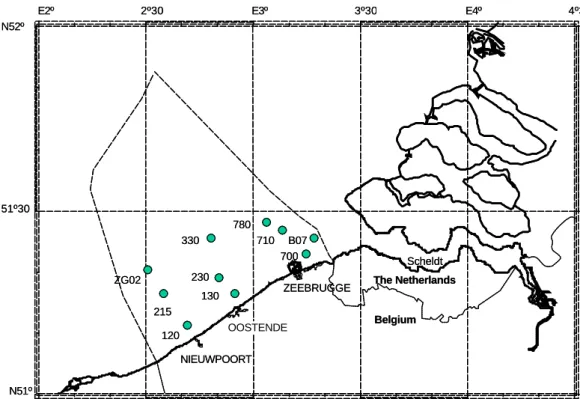
Fig. 1. Map of the Belgian coastal zone indicating the location of the ten stations.
Philippart et al. (2000) showed that the phytoplankton community changed drastically in the eutrophic Marsdiep (westernmost inlet of the Wadden Sea) both between 1976 and 1978 and again between 1987 and 1988, whereas it was stable before (1974–1976), in-between (1978–1987)
and thereafter (1988–1994). These major changes
coin-cide with changes in absolute and relative (total N: total
P) nutrient concentrations. In 1977, the system shifted
from a phosphorus-controlled situation, towards a nitrogen-controlled environment, and re-shifted towards P control in 1987–1988. This coincidence implies a strong relationship between N:P ratios and the phytoplankton community struc-ture. Phosphate concentrations dropped a little further since 1992 in the Marsdiep and since 1994 (until 2000) a decrease in primary productivity, chlorophyll a concentration and
Phaeocystis cell numbers was observed (Cad´ee and
Hege-man, 2002). These are the first signs of de-eutrophication. The Belgian coastal zone is greatly influenced by the rivers Rhine, Meuse and the Scheldt (Van Bennekom and Wet-steijn, 1990; Lacroix et al., 2004). As observed generally in the North Sea, the phosphorus flux decreased more in re-cent years than the nitrogen flux from the Scheldt to the
Bel-gian coastal zone. The annual phosphate (PO4)load
sup-plied by the river Scheldt to the Belgian coast was on
aver-age 0.032×10⁹mol between 1990 and 1993, whereas about
0.066×10⁹mol were supplied annually in the 1980s (Lenhart
et al., 1996). The annual nitrate load, however, was on
aver-age 1.4×10⁹mol in the 1980s and still 1.2×10⁹mol between
1990 and 1993 (Lenhart et al., 1996). Two major phyto-plankton communities, the diatoms and Phaeocystis, domi-nate the nutrient removal in the Belgian coastal zone during the spring bloom. Tungaraza et al. (2003) measured the
nu-trient concentrations at station 330 (51◦260N, 2◦48.50E) in
the Belgian coastal zone between late winter and early
sum-mer in 1996 and 1997. They found that the PO4
concentra-tion did not show a pronounced seasonal pattern. Silicate and nitrate, on the other hand, showed clear seasonal varia-tions with the lowest concentravaria-tions observed at the end of spring and during summer. Rousseau et al. (2002) did ob-serve a seasonal pattern in the phosphate concentrations at
station 330 in 1995. The PO4 concentration started to
de-crease between February and March with the onset of the early-spring diatom bloom. In the second half of May, the decline in the Phaeocystis and Rhizosolania spp. bloom
cor-responded to the lowest DIN (3.3 µM), Si(OH)4 (0.9 µM)
and PO4 (0.03 µM) concentrations recorded during spring.
The lowest seasonal pCO2values coincide with the
Phaeo-cystis bloom and the lowest nutrient levels (Gypens et al.,
2004).
These studies, however, focussed mainly on the role of ni-trogen, silicon and carbon in the Belgian coastal zone, and
the only phosphorus species measured was PO4. Little
re-search has been devoted to the phosphorus cycle in the Bel-gian coastal zone, while this element is an important and po-tentially limiting nutrient. Also, with the changing N:P ratio of the riverine fluxes, recent data are required to assess the
present nutrient situation of the ecosystem. In this context, we visited 10 stations located on the Belgian Continental Shelf over one year (from August 2002 to December 2003), giving particular attention to the speciation of phosphorus.
2 Materials and methods
2.1 Study site and sampling methods
The study area comprised the Belgian coastal zone of the southern North Sea (Fig. 1). This part of the North Sea is highly influenced by the eutrophied rivers Scheldt and Rhine/Meuse, and by oceanic water flowing from the At-lantic through the Channel into the North Sea. The gross pri-mary production in the Belgian coastal zone was estimated
to be 225 g C m−2y−1(Gypens et al., 2004). The water
col-umn is completely mixed vertically throughout the year, due to the strong tidal currents and shallow water depth. The wa-ter depth ranges from ∼10–15 m for stations B07, 700, 710, 120, 130 and 230, to ∼18–28 m for the remaining stations 780, 330, 215 and ZG02. The 10 stations can be grouped along three near shore-offshore transects: one located close to the mouth of the Scheldt (stations 700, B07, 710 and 780), a second one near the city of Oostende (stations 130, 230 and 330) and the third most southern transect near Nieuw-poort (stations 120, 215 and ZG02). Surface waters were collected with Niskin bottles from 1 m water depth during near-monthly surveys with the RV Zeeleeuw in the Belgian coastal zone (Table 1 and Fig. 1). Samples were filtered for dissolved phosphorus speciation, nitrogen speciation, dis-solved organic carbon (DOC) and disdis-solved silicate determi-nation. The particulate phase was collected on filters for the measurement of chlorophyll a, suspended particulate matter (SPM), and carbon and phosphorus species.
2.2 Chlorophyll a and particulate organic carbon
Chlorophyll a was determined on GF/F filters after filtration of 250-ml seawater under low suction, following the fluoro-metric method of Yentsch and Menzel (1963). Filters were
stored at −20◦C until analyses. For analysis, the filters were
extracted with 90% acetone at −20◦C for 24 h. Samples were
centrifuged (10 min, 5500 rpm) and the fluorescence of the extract was measured with a Shimadzu RF-150 fluorometer, using an excitation wavelength of 430 nm and an emission wavelength of 663 nm. The fluorescence was calibrated with a stock solution of pure chlorophyll a (Merck).
Particulate organic carbon (POC) measurements were per-formed on particulate matter collected by filtration of
sea-water on precombusted (4 h, 500◦C) GF/F filters. POC was
measured using a Fisions NA-1500 elemental analyser af-ter carbonate removal from the filaf-ters by strong acid fumes
overnight. Certified reference stream sediment (STSD-2)
from the Geological Survey of Canada was used for the cali-bration.
Table 1. Sampling locations and dates.
Station name Latitude Longitude Sampling dates Nieuwpoort Transect 23 August 2002 120 51◦11.10 2◦42.00 27 September 2002 215 51◦16.50 2◦36.80 29 October 2002 ZG02 51◦20.00 2◦30.00 21 November 2002
23 December 2002 Oostende Transect 20 January 2003 130 51◦16.20 2◦54.20 26 February 2003 230 51◦18.40 2◦51.00 31 March 2003 330 51◦26.00 2◦48.50 25 April 2003
26 May 2003 Scheldt Transect 30 June 2003 700 51◦22.60 3◦13.20 31 July 2003 710 51◦26.50 3◦08.30 28 August 2003 780 51◦28.30 3◦03.50 26 September 2003 B07 51◦25.90 3◦17.90 9 December 2003
2.3 Dissolved Si and N species and DOC
Water samples for silicate were taken in plastic bottles and filtered on a plastic filtration set. Dissolved silicate was mea-sured following the method of Grasshoff et al. (1983). Ni-trate, nitrite and ammonium were determined colorimetri-cally. Nitrate and nitrite were analysed with a Technicon Autoanalyzer system following Grasshoff et al. (1983). Am-monium was measured with the indophenol blue technique according to Koroleff (1969). The dissolved organic nitro-gen (DON) was determined as the difference between to-tal dissolved nitrogen and the dissolved inorganic nitrogen (nitrate, nitrite and ammonium). Total dissolved nitrogen (TDN) was measured by wet oxidation in alkaline
persul-phate (120◦C, 30 min) (Grasshoff et al., 1983). The
preci-sion of the TDN analysis was 1.0 µM. The DOC was deter-mined with a Shimadzu TOC-5000 analyser using the widely accepted high-temperature catalytic oxidation (HTCO) tech-nique (Sugimura and Suzuki, 1988; Suzuki, 1993).
2.4 Phosphorus speciation
Dissolved phosphorus species were determined after
filtra-tion through precombusted (4 h, 500◦C) GF/F filters, which
were used for the particulate phosphorus speciation. Sol-uble reactive phosphorus, hereafter phosphate, was mea-sured according to the method of Grasshoff et al. (1983). Dissolved inorganic phosphorus (DIP) was determined as
phosphate after digestion with 9N H2SO4 (120◦C, 30 min).
DIP comprises phosphate and polyphosphates, although hy-drolysis of acid-labile organic phosphorus compounds may also contribute to this parameter. Polyphosphate was de-termined as the difference between DIP and phosphate
(Polyphosphate=DIP–PO4). Total dissolved phosphorus
0 10 20 30 40 50
Aug-02 Nov-02 Feb-03 May-03 Aug-03 Nov-03
Chl-a (µg/l) #120 #215 ZG02 0 10 20 30 40 50
Aug-02 Nov-02 Feb-03 May-03 Aug-03 Nov-03
Chl-a (µg/l) #130 #230 #330 0 10 20 30 40 50
Aug-02 Nov-02 Feb-03 May-03 Aug-03 Nov-03
Chl-a (µg/l) B07 #700 #710 #780 0 1 2 3 4 5 6
Aug-02 Nov-02 Feb-03 May-03 Aug-03 Nov-03
POC (mg/l) #120 #215 ZG02 0 1 2 3 4 5 6
Aug-02 Nov-02 Feb-03 May-03 Aug-03 Nov-03
POC (mg/l) #130 #230 #330 0 1 2 3 4 5 6
Aug-02 Nov-02 Feb-03 May-03 Aug-03 Nov-03
POC (mg/l)
B07 #700 #710 #780
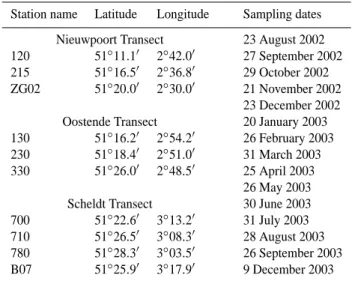
Fig. 2. Seasonal trend in the chlorophyll a and the POC concentrations for the ten stations investigated. The stations are grouped per
transect: on the Nieuwpoort transect stations 120, 215 and ZG02, on the Oostende transect stations 130, 230 and 330 and on the Scheldt transect stations B07, 700, 710 and 780.
(120◦C, 30 min) (Grasshoff et al., 1983). The precision of
the TDP analysis was 0.02 µM. Dissolved organic phospho-rus (DOP) was subsequently calculated as the difference be-tween TDP and phosphate as upper estimate (DOP=TDP–
PO4)and the difference between TDP and DIP as lower
es-timate. Filters for the total particulate phosphorus (TPP)
de-termination were combusted at 500◦C for 1.5 h with MgSO4
and subsequently extracted in 1N HCl for 24 h (Solorzano and Sharp, 1980). Filters for particulate inorganic phospho-rus (PIP) were extracted in 1N HCl for 24 h. Particulate or-ganic phosphorus (POP) was calculated as the difference be-tween TPP and PIP (POP=TPP–PIP). Additionally, the un-filtered water sample was digested by wet oxidation in acid persulphate, which gives the total phosphorus.
In order to distinguish the contribution to POP of resus-pended sediment from that of phytoplankton, we have cor-rected the POP concentration as follows. The POP
concen-tration resulting from resuspended sediment was estimated by multiplying the PIP concentration at a given station dur-ing a given campaign with the lowest POP/PIP ratio of the SPM at each station. This value was then subtracted from the POP concentration at the given station during the given campaign. The lowest POP/PIP ratio was used because re-suspended sediment is expected to have a lower POP/PIP
ratio than pelagic material. Thus, corrected POP=POP–
(PIP×(POP/PIP)lowest). The lowest POP/PIP ratios range
from 0.22 to 0.83 for the individual stations. The average POP/PIP ratio is 0.61, which compares well with the value of 0.53 for the POP/(Fe-bound P) ratio in the Wadden Sea near the Elbe estuary (van Beusekom and Brockmann, 1998).
0 0.5 1 1.5 2 2.5
Aug-02 Nov-02 Feb-03 May-03 Aug-03 Nov-03
POC:Chl a (mg/µg) #120 #215 ZG02 0 0.5 1 1.5 2 2.5
Aug-02 Nov-02 Feb-03 May-03 Aug-03 Nov-03
POC:Chl a (mg/µg) #130 #230 #330 0 0.5 1 1.5 2 2.5
Aug-02 Nov-02 Feb-03 May-03 Aug-03 Nov-03
POC:Chl a (mg/µg) B07 #700 #710 #780 0 0.1 0.2 0.3 0.4
Aug-02 Nov-02 Feb-03 May-03 Aug-03 Nov-03
POC:SPM (mg/mg) #120 #215 ZG02 0 0.1 0.2 0.3 0.4
Aug-02 Nov-02 Feb-03 May-03 Aug-03 Nov-03
POC:SPM (mg/mg) #130 #230 #330 0 0.1 0.2 0.3 0.4
Aug-02 Nov-02 Feb-03 May-03 Aug-03 Nov-03
POC:SPM (mg/mg)
B07 #700 #710 #780
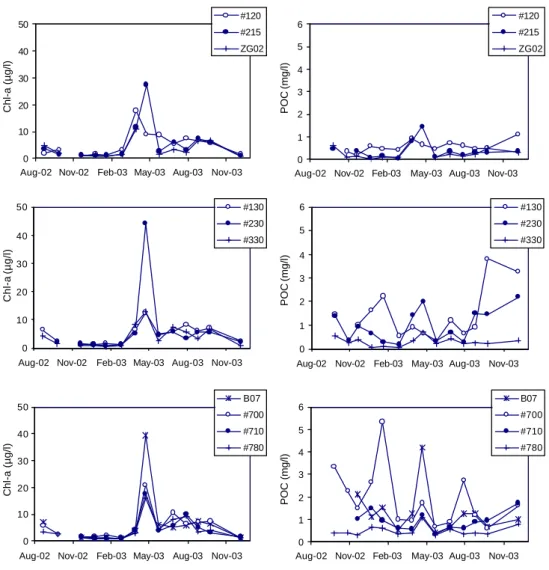
Fig. 3. Seasonal trend in the ratios of POC:Chl a and POC:SPM for the ten stations investigated. The stations are grouped per transect: on
the Nieuwpoort transect stations 120, 215 and ZG02, on the Oostende transect stations 130, 230 and 330 and on the Scheldt transect stations B07, 700, 710 and 780.
3 Results
3.1 Chlorophyll a, POC and DOC
The chlorophyll a concentration was low from September 2002 until February 2003 after which it increased at all sta-tions (Fig. 2). The highest concentrasta-tions in chlorophyll a were observed during the cruises at the end of March and April 2003. The chlorophyll a concentration remained at a higher level from May to September 2003 as compared to the values from September 2002 to February 2003. Finally, the chlorophyll a concentration returned to a lower level in December 2003. No data are available between September 2003 and December 2003.
The POC concentration did not show a clear seasonal trend except for the deep stations (Fig. 2). The highest concentra-tions were found at the shallow staconcentra-tions B07 and 700 close to the mouth of the Scheldt. The seasonal trends in POC
and chlorophyll a concentrations were most similar at three deeper stations (215, ZG02, 330). These observations sug-gest that resuspended sediment is an important contribution to the POC concentration. Figure 3 shows that in winter the high POC:Chl a ratio is accompanied by the low POC:SPM ratio, suggesting a greater contribution of resuspended sedi-ment to the POC concentration during this period. The low POC:Chl a ratio and high POC:SPM ratio observed in spring and summer indicate that phytoplankton is the dominant con-tribution to the POC concentration (Fig. 3). The POC:Chl
a ratio in spring was about 0.05–0.08 (mg µg−1)for the
stations on the Nieuwpoort and Oostende transects, which is typical for phytoplankton (Abril et al., 2002 and refer-ences therein). A slightly higher POC:Chl a ratio of 0.07–
0.11 (mg µg−1)was recorded for the stations on the Scheldt
transect. The relatively high POC:Chl a maximal values and the relatively low POC:SPM maximal values at the stations
c 0 50 100 150 200 250 300
Aug-02 Nov-02 Feb-03 May-03 Aug-03 Nov-03
DOC (µM) B07 #700 #710 #780 a 0 50 100 150 200 250 300
Aug-02 Nov-02 Feb-03 May-03 Aug-03 Nov-03
DOC (µM) #120 #215 ZG02 b 0 50 100 150 200 250 300
Aug-02 Nov-02 Feb-03 May-03 Aug-03 Nov-03
DOC (µM) #130 #230 #330 d 0 40 80 120 160 28 29 30 31 32 33 34 35 Salinity (psu) DOC (µM)
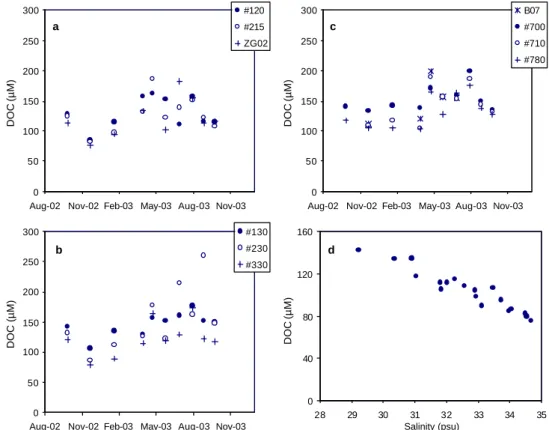
Fig. 4. Seasonal trend in the DOC concentration for the stations, (a) on the Nieuwpoort transect, (b) on the Oostende transect and (c) on the
Scheldt transect. (d) The DOC concentration versus salinity plot for the months of November 2002 and January 2003.
along the Scheldt transect, as compared to the stations along the Nieuwpoort transect, indicate that the contribution of re-suspended sediment to the SPM is more important at the sta-tions located close to the mouth of the estuary.
The seasonal evolution in the DOC values follows the clas-sical trend with minimal values in winter and elevated val-ues during spring-summer (Fig. 4a, b, c). The DOC con-centration exhibits an increasing trend from its minimum in November 2002 until April 2003, remaining elevated from April to July 2003, after which it again decreased. Figure 4d indicates that the winter DOC values (November 2002 and
January 2003) correlate well with salinity (R2=0.91, n=19).
3.2 Dissolved Si and N species
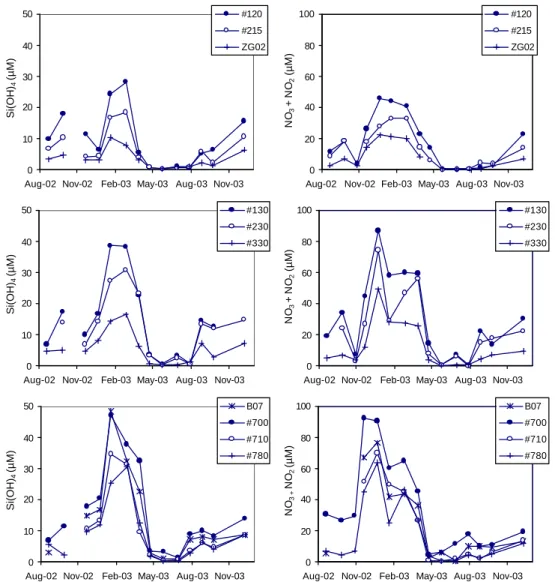
The seasonal pattern in the silicate concentration showed the same trend for all stations (Fig. 5). The silicate concentration was the highest in the months of January and February, and reached its lowest values in May. Two general trends can be observed. First, the maximal silicate concentrations observed in winter are higher at the stations on the Scheldt transect close to the mouth of the estuary (700, 710, 780 and B07;
35–48 µM Si(OH)4), than those of the Nieuwpoort transect
(120, 215, ZG02; 10–28 µM Si(OH)4), the most
southwest-ern transect. The maximal silicate values at the stations of the Oostende transect (130, 230 and 330) are intermediate (17–
39 µM Si(OH)4). Secondly, the dissolved silicate
concen-tration decreases going from the near-shore to the offshore stations along each transect.
Nitrate is the predominant dissolved nitrogen species of the four N species measured. The nitrate plus nitrite (here-after referred to as nitrate) concentration at all stations in-creased after October 2002 and remained high from Decem-ber 2002 to February/March 2003 after which it reached its
lowest values in May 2003 (Fig. 5). Similar to the
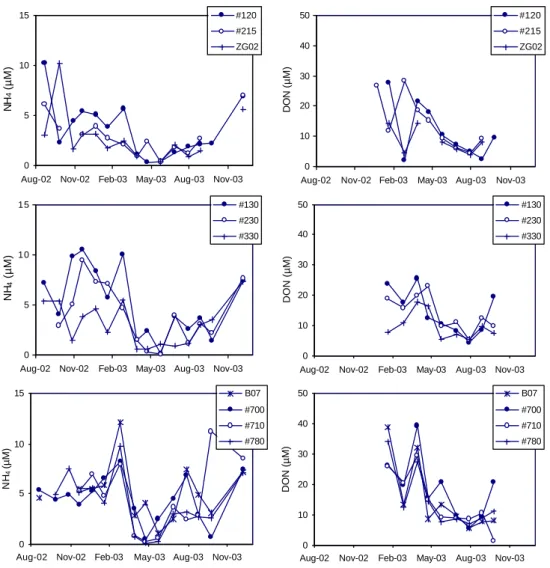
sili-cate concentration, the maximal nitrate concentrations are higher at stations located close to the mouth of the Scheldt estuary as compared to those along the Nieuwpoort transect. Along each transect, a trend of decreasing nitrate concentra-tion from the coast seaward is also apparent. The variaconcentra-tion in the ammonium concentration with time is less pronounced than for nitrate, but again a minimum in the concentration oc-curs around April–May 2003 (Fig. 6). Differences in ammo-nium concentration between the stations are much less dis-tinct than for the silicate and nitrate data. The DON concen-trations are the highest in winter and start to decrease after March 2003 until they reach their minimum in July (Fig. 6). The DON seasonal patterns for the stations on the same tran-sect are very similar.
The dissolved silicate, nitrate and ammonium concentra-tions in the winter months (November and December 2002,
0 20 40 60 80 100
Aug-02 Nov-02 Feb-03 May-03 Aug-03 Nov-03
NO 3 + NO 2 (µM) #120 #215 ZG02 0 20 40 60 80 100
Aug-02 Nov-02 Feb-03 May-03 Aug-03 Nov-03
NO 3 + NO 2 (µM) #130 #230 #330 0 20 40 60 80 100
Aug-02 Nov-02 Feb-03 May-03 Aug-03 Nov-03
NO 3 + NO 2 (µM) B07 #700 #710 #780 0 10 20 30 40 50
Aug-02 Nov-02 Feb-03 May-03 Aug-03 Nov-03
Si(OH) 4 (µM) #120 #215 ZG02 0 10 20 30 40 50
Aug-02 Nov-02 Feb-03 May-03 Aug-03 Nov-03
Si(OH) 4 (µM) #130 #230 #330 0 10 20 30 40 50
Aug-02 Nov-02 Feb-03 May-03 Aug-03 Nov-03
Si(OH) 4 (µM) B07 #700 #710 #780
Fig. 5. Seasonal trend in the concentrations of silicate and nitrate for the stations on the Nieuwpoort transect (120, 215 and ZG02), on the
Oostende transect (130, 230 and 330) and on the Scheldt transect (B07, 700, 710 and 780).
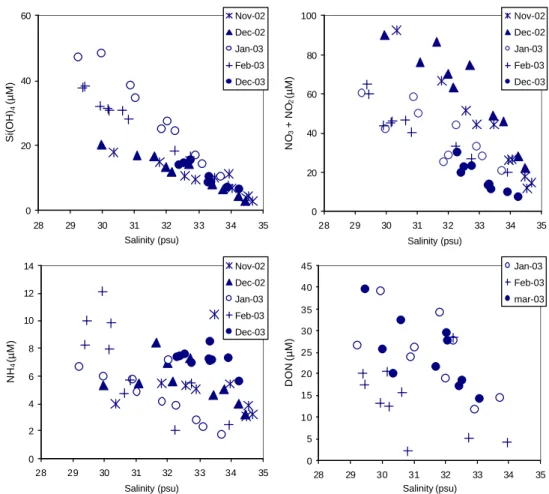
and January, February and December 2003) have been plot-ted against salinity (Fig. 7). Within the same month, the dif-ferences in silicate and nitrate concentrations between sta-tions can be largely explained by differences in salinity. But differences exist between the winter months, which could be attributed to variations in river discharges. The ammonium concentration correlated with salinity only in January 2003 and not during any other winter month (Fig. 7), showing the non-conservative behaviour of this nutrient. DON ver-sus salinity plot (Fig. 7) shows a weak correlation between these two parameters for January and March 2003 samples
(R2=0.45, n=19).
3.3 Phosphorus species
Three dissolved P species were determined: phosphate
(PO4), polyphosphates and dissolved organic phosphorus
(DOP). The polyphosphate concentration was always very
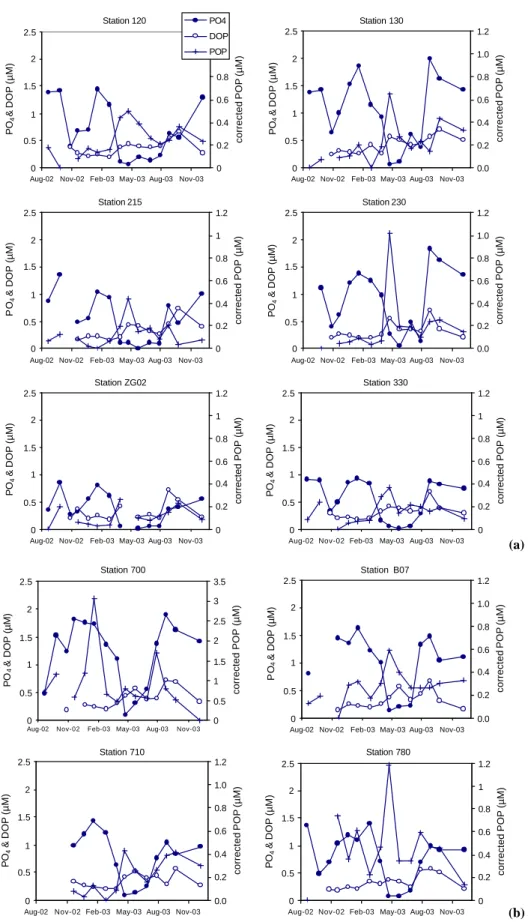
low, generally less than 0.11 µM, and did not show any sea-sonal or spatial variation (data not shown). The seasea-sonal pat-tern of the DOP concentration appears to exhibit two max-ima: one around May 2003 and a second one at a higher con-centration around August-September 2003 (Fig. 8a, b). The DOP concentration was similar for all stations and was
usu-ally low compared to the PO4 concentration, although the
DOP concentration exceeded the PO4 concentration at all
stations in the months of April and May 2003. The PO4
con-centration at the different stations shows a decreasing trend along a transect going from the coast to the open sea (Fig. 8a, b). However, the differences in concentration are not as pro-nounced as observed for the silicate and the nitrate concen-trations. At the stations of the Nieuwpoort transect (120, 215
and ZG02) and station 330, the strongest decline in PO4
con-centrations was observed between February and March 2003, whereas the other stations showed a strong decline between
0 5 10 15
Aug-02 Nov-02 Feb-03 May-03 Aug-03 Nov-03
NH 4 (µM) #120 #215 ZG02 0 5 10 15
Aug-02 Nov-02 Feb-03 May-03 Aug-03 Nov-03
NH 4 (µM) #130 #230 #330 0 5 10 15
Aug-02 Nov-02 Feb-03 May-03 Aug-03 Nov-03
NH 4 (µM) B07 #700 #710 #780 0 10 20 30 40 50
Aug-02 Nov-02 Feb-03 May-03 Aug-03 Nov-03
DON (µM) #120 #215 ZG02 0 10 20 30 40 50
Aug-02 Nov-02 Feb-03 May-03 Aug-03 Nov-03
DON (µM) #130 #230 #330 0 10 20 30 40 50
Aug-02 Nov-02 Feb-03 May-03 Aug-03 Nov-03
DON (µM)
B07 #700 #710 #780
Fig. 6. Seasonal trend in the concentrations of ammonium and dissolved organic nitrogen (DON) for the stations on the Nieuwpoort transect
(120, 215 and ZG02), on the Oostende transect (130, 230 and 330) and on the Scheldt transect (B07, 700, 710 and 780).
March and April 2003. The lowest values for the PO4
con-centration were measured in April at the following stations: 120, 130, 700, 710, 780 and B07, whereas the lowest values at stations 215, 230 and 330 were measured in May 2003. No data are available for station ZG02 in April 2003. At
most stations, the PO4concentrations increase from August
onwards reaching the winter values again in the fall. This seasonal pattern was not observed for silicate and nitrate.
The corrected POP concentration, as calculated in Sect. 2.4, was highest in April 2003 for all stations, with the exceptions of station ZG02 that was not sampled during this month and of station 700 that exhibits two additional and higher peaks in corrected POP concentration in January and July 2003 (Fig. 8a, b). The corrected POP and POC
con-centrations are correlated (R2=0.52), as well as the POP
con-tent and POC:SPM ratio (R2=0.67). In general, the corrected
POP concentrations are elevated in spring and summer when
the PO4concentrations are low. The seasonal trends of the
corrected POP concentration and the POP content are sim-ilar (data not shown). The highest values of POP content are observed at the stations further away from the mouth of the Scheldt estuary. The PIP contents at the stations of the Scheldt transect are very similar to those of POP as well as the seasonal trend (data not shown). However, at the stations of the other two transects the PIP content is similar to the POP content in the winter, but PIP content does not increase in spring as the POP content does.
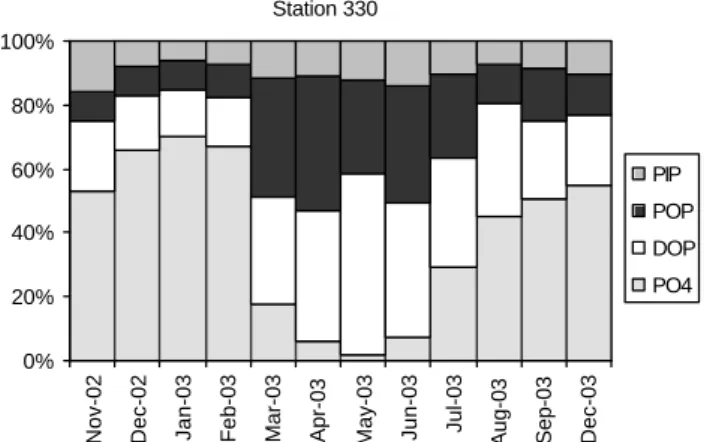
The relative concentrations of PO4, DOP, uncorrected POP
and PIP for station 330 are plotted in order to visually summarise the seasonal transformations between dissolved vs. particulate and organic vs. inorganic phosphorus phases (Fig. 9).
The winter phosphate concentration correlated with salin-ity, in contrast to the spring and summer values (Fig. 10). In February 2003, the phosphate concentration was depressed somewhat in the lower salinity range, decreasing further in
0 20 40 60 28 29 30 31 32 33 34 35 Salinity (psu) Si(OH) 4 (µM) Nov-02 Dec-02 Jan-03 Feb-03 Dec-03 0 2 4 6 8 10 12 14 28 29 30 31 32 33 34 35 Salinity (psu) NH 4 (µM) Nov-02 Dec-02 Jan-03 Feb-03 Dec-03 0 5 10 15 20 25 30 35 40 45 28 29 30 31 32 33 34 35 Salinity (psu) DON (µM) Jan-03 Feb-03 mar-03 0 20 40 60 80 100 28 29 30 31 32 33 34 35 Salinity (psu) NO 3 + NO 2 (µM) Nov-02 Dec-02 Jan-03 Feb-03 Dec-03
Fig. 7. Dissolved silicate, nitrate and ammonium concentrations versus salinity in the winter months (November and December 2002 and
January, February and December 2003). The DON concentration versus salinity in the months of January, February and March 2003.
spring. The DOP concentration was generally lower in win-ter than in spring and summer, and was never correlated with the salinity (Fig. 10).
4 Discussion
4.1 Spatial trends
The spatial distributions of the major nutrients in the Bel-gian coastal zone result from the mixing of relatively low nutrient-high salinity North Atlantic water flowing northeast-ward through the Channel into the North Sea with high nu-trient freshwater which is discharged from the rivers Rhine, Meuse and Scheldt. The freshwater flows clockwise south-westward along the southernmost part of the Dutch (south of the mouth of the Rhine) and Belgian coasts, before it mixes with the northeastward flowing Channel water (van Bennekom and Wetsteyn, 1990; Lacroix et al., 2004). This water circulation pattern is reflected in the winter nutrient concentrations at the different stations: high nutrient con-centrations at the stations on the Scheldt transect as well as the coastal stations 120 and 130, which are located in the
Rhine/Meuse and Scheldt plumes and lower nutrient concen-trations at the other stations. Basically, this pattern creates a winter nutrient gradient in the nearshore-offshore direction and in the northeast-southwest direction. The influence of riverine nutrient input was also apparent from the DOC, ni-trate, silicate and phosphate versus salinity plots in winter (Figs. 4, 7 and 10). The extrapolation of the winter DOC plot to zero-salinity gives a value of 499 µM, which is typ-ical of the Scheldt river endmember (461–538 µM, unpub-lished results; 567 µM, Abril et al., 2002). DOC values at zero-salinity in the Rhine are typically half of those of the Scheldt (242 µM, Abril et al., 2002). Extrapolation of the winter nitrate and silicate concentrations versus salinity
plot results in river values of 235 µM Si(OH)4and 353 µM
NO3 at zero salinity. These values do not compare well
with the winter values in the Rhine at Maassluis, which were
119 µM Si(OH)4and 214 µM NO3in 2003 (RWS). For the
Scheldt on the other hand, higher concentrations of 344 µM
NO3 were measured near Antwerp in winter 2003 (average
of January, February, November and December). Silicate concentrations measured in March 2003 along a longitudinal transect on the Scheldt showed a conservative behaviour of
Station 120 0 0.5 1 1.5 2 2.5
Aug-02 Nov-02 Feb-03 May-03 Aug-03 Nov-03
PO 4 & DOP (µM) 0 0.2 0.4 0.6 0.8 1 1.2 corrected POP (µM) PO4 DOP POP Station 215 0 0.5 1 1.5 2 2.5
Aug-02 Nov-02 Feb-03 May-03 Aug-03 Nov-03
PO 4 & DOP (µM) 0 0.2 0.4 0.6 0.8 1 1.2 corrected POP (µM) Station ZG02 0 0.5 1 1.5 2 2.5
Aug-02 Nov-02 Feb-03 May-03 Aug-03 Nov-03
PO 4 & DOP (µM) 0 0.2 0.4 0.6 0.8 1 1.2 corrected POP (µM) Station 130 0 0.5 1 1.5 2 2.5
Aug-02 Nov-02 Feb-03 May-03 Aug-03 Nov-03
PO 4 & DOP (µM) 0.0 0.2 0.4 0.6 0.8 1.0 1.2 corrected POP (µM) Station 230 0 0.5 1 1.5 2 2.5
Aug-02 Nov-02 Feb-03 May-03 Aug-03 Nov-03
PO 4 & DOP (µM) 0.0 0.2 0.4 0.6 0.8 1.0 1.2 corrected POP (µM) Station 330 0 0.5 1 1.5 2 2.5
Aug-02 Nov-02 Feb-03 May-03 Aug-03 Nov-03
PO 4 & DOP (µM) 0 0.2 0.4 0.6 0.8 1 1.2 corrected POP (µM) (a) Station 710 0 0.5 1 1.5 2 2.5
Aug-02 Nov-02 Feb-03 May-03 Aug-03 Nov-03
PO 4 & DOP (µM) 0.0 0.2 0.4 0.6 0.8 1.0 1.2 corrected POP (µM) Station 700 0 0.5 1 1.5 2 2.5
Aug-02 Nov-02 Feb-03 May-03 Aug-03 Nov-03
PO 4 & DOP (µM) 0 0.5 1 1.5 2 2.5 3 3.5 corrected POP (µM) Station 780 0 0.5 1 1.5 2 2.5
Aug-02 Nov-02 Feb-03 May-03 Aug-03 Nov-03
PO 4 & DOP (µM) 0 0.2 0.4 0.6 0.8 1 1.2 corrected POP (µM) Station B07 0 0.5 1 1.5 2 2.5
Aug-02 Nov-02 Feb-03 May-03 Aug-03 Nov-03
PO 4 & DOP (µM) 0.0 0.2 0.4 0.6 0.8 1.0 1.2 corrected POP (µM) (b)
Fig. 8. (a) Seasonal trends in the PO4, DOP and corrected POP concentrations for the Nieuwpoort transect (120, 215 and ZG02) and Oostende transect (130, 230 and 330). (b) Seasonal trends in the PO4, DOP and corrected POP concentrations for the Scheldt transect (B07, 700, 710 and 780). Please note the different scale for the corrected POP concentration of station 700.
silicate and a zero-salinity concentration of 211 µM Si(OH)4 was measured (V. Carbonnel, personal communication). The Scheldt DOC, nitrate and silicate values agree very well with extrapolated values from the Belgian coastal zone nutrient-salinity plots. Based on these observations, we conclude that the influence of the Rhine water in the Belgian coastal zone on the winter DOC, nitrate and silicate concentrations could not be detected in our study. The extrapolation of the phos-phate winter concentration versus salinity yields a zero salin-ity phosphate concentration of 7.6 µM. The difference in the concentration between the two river endmembers is not so
large for PO4 as those found for DOC, nitrate and silicate.
However, phosphate concentrations of 6.6 µM were recorded for the Scheldt at Temse and lower values of about 4.0 µM for the Rhine (unpublished results).
The lack of a spatial trend in the DOP concentration and the lack of a correlation with salinity at any time of the year suggests that DOP is produced at sea in the Belgian coastal zone (Figs. 8 and 10). The DON and DOP versus salinity trends are not the same (Figs. 7 and 10). For DON a correla-tion existed with salinity in the months of January and March 2003, implying that in contrast to the DOP riverine input may be a source of DON for the Belgian coastal zone. The ex-trapolated zero-salinity DON concentration of 157 µM might be high, although Dafner et al. (1999) reported a DON con-centration of 110 µM downstream of Antwerp. Tradition-ally one would expect maximal DON concentrations during summer and minimal values during winter (e.g. Butler et al., 1979). The difference between the seasonal patterns of DON found in this study and that of Butler et al. (1979) may be ex-plained by the fact that the Scheldt is heavily polluted espe-cially with respect to nitrogen, whereas the western English Channel was not between 1969 and 1977.
The timing of the spring bloom, as reflected by the chloro-phyll a data (Fig. 2), seems to be evenly distributed over the Belgian coastal zone. There are two pronounced peak val-ues, at station 230 and station B07 at the end of April 2003. General trends as seen in the nutrient distribution, however, are not apparent for chlorophyll a in our data set. Sampling was conducted once a month, too low a frequency to dis-cern patterns in the phytoplankton bloom between stations, such as in the exact timing and intensity of the bloom. The spatial distribution of the particulate organic carbon (Fig. 3) and phosphorus (not shown) contents indicates an increas-ing trend goincreas-ing from the northeast to the southwest. This trend is caused by the dilution of organic-rich pelagic mate-rial with relatively organic-poor resuspended sediment at the more turbid stations near the mouth of the Scheldt estuary as was demonstrated in Sect. 3.1.
4.2 Seasonal trends in phosphate concentration
Besides the minimum in PO4 concentration in spring,
an-other minimum was observed in October 2002, which was not accompanied by an increase in corrected POP or
chloro-Station 330 0% 20% 40% 60% 80% 100%
Nov-02 Dec-02 Jan-03 Feb-03 Mar-03 Apr-03 May-03 Jun-03 Jul-03 Aug-03 Sep-03 Dec-03
PIP POP DOP PO4
Fig. 9. Relative contributions of PO4, DOP, POP and PIP to the total P for station 330.
phyll a concentration. This latter minimum was caused by the increased contribution of high salinity-low nutrient wa-ter from the Channel. Phosphate concentration versus salin-ity plots for the different months indicate a more or less conservative behaviour in the winter months (October 2002, November 2002, December 2002, January 2003 and De-cember 2003), whereas biological activity determines the phosphate concentration in spring-summer and summer-fall (Fig. 10).
The largest decrease in the major nutrient concentrations occurs between the end of February and the end of April 2003 (Figs. 5 and 8) coinciding with the largest increase in chlorophyll a concentration (Fig. 2). It also corresponds to an increase in POC:SPM, a decrease in POC:Chl a ra-tios (Fig. 3), and an increase in corrected POP concentra-tion (Fig. 8). For the northeastern staconcentra-tions (700, 710, 780, B07, 130 and 230) the largest decline in nutrients occurs be-tween the end of March and the end of April 2003, whereas for the southwestern stations the major decrease occurs one month earlier. This is consistent with the findings of Gon-zales (unpublished results); the spring bloom was initiated in the southwest in late February 2003 and had spread to-wards the northeast by the end of April (MIDAS). Spatial and
temporal patterns in oxygen saturation, pCO2 and
chloro-phyll a concentration in the Belgian coastal zone described by Borges and Frankignoulle (2002) match these observa-tions. The timing of the spring bloom initiation could be related to light conditions due to the spatial distribution of
the SPM. At the end of the summer, the dissolved Si, PO4
and DIN concentrations increase again when their supply ex-ceeds their consumption. In contrast to the dissolved Si and
DIN, the PO4concentrations have already reached their
pre-bloom levels by the fall. This difference in the seasonal evo-lution of P versus N and Si was also noted in a compilation of nutrient data from 1993–2000 in the same area (De Galan et al., 2004). Thus, the rate of regeneration and/or supply of phosphorus is higher than that for dissolved Si and DIN
0 0.5 1 1.5 2 2.5 29 30 31 32 33 34 35 Salinity (psu) PO 4 (µM) Oct-02 Nov-02 Dec-02 Jan-03 Feb-03 Dec-03 0 0.5 1 1.5 2 2.5 29 30 31 32 33 34 35 Salinity (psu) PO 4 (µM) Aug-02 Sep-02 mar-03 Apr-03 Jun-03 Jul-03 Aug-03 Sep-03 0 0.2 0.4 0.6 0.8 29 30 31 32 33 34 35 Salinity (psu) DOP (µM) 0 0.2 0.4 0.6 0.8 29 30 31 32 33 34 35 Salinity (psu) DOP (µM)
Fig. 10. PO4and DOP concentrations versus salinity, data of all the stations in different months. For the month of May, no salinity data were available. DOP was not determined for the months of August and September 2002.
in the Belgian coastal zone. One source of these nutrients is river run-off from the Rhine/Meuse and Scheldt. In 2003, the nitrate to phosphate ratio in the Rhine at Maassluis varied between 27 and 243 (RWS) and between 40 and 249 in the Scheldt at Antwerp (unpublished results). These ratios indi-cate that there was always more nitrate delivered to the Bel-gian coastal zone than phosphate (ratio>16). Another source for nitrogen is atmospheric input, but for phosphorus this is negligible in the North Sea (Brion et al., 2004). Both atmo-spheric and riverine input would deliver more nitrogen than phosphorus and are therefore not likely to cause the earlier replenishment of phosphate as compared to nitrate in the Bel-gian coastal zone. In the Southern Bight of the North Sea, the oceanic/riverine inflow rates of phosphate, nitrate and silicate are insufficient to support their seasonal cycle and therefore internal recycling is required (Prandle et al., 1997). Since the supply of phosphate to the Belgian coastal zone is not higher than that of silicate and nitrate, the difference can be attributed to the internal cycling. Preferential regeneration of P over N and C has already been demonstrated both in the hydrolysis of dissolved organic matter (e.g. Hopkinson et al., 1997; Clark et al., 1998; Vidal et al., 1999) and in the remineralisation of particulate organic matter (Bishop et al.,
1977; Garber, 1984; Martin et al., 1987). Alternatively, the loss of nitrate via denitrification to the atmosphere and the buffering of phosphate via sorption on suspended matter or the sediment might also play a role.
4.3 Phosphate being the first limiting nutrient
Typical nitrate and phosphate half saturation constants for coastal phytoplankton populations are around 1–2 µM and 0.1–0.5 µM, respectively, and typical silicate half saturation constants for coastal diatom populations are around 1–2 µM (Fisher et al., 1988). In our study area, the lowest nutri-ent concnutri-entrations recorded for the individual stations range
from <0.01 to 0.13 µM for PO4, from 0.27 to 1.53 µM for
Si(OH)4and from 0.37 to 5.48 µM for NO3. The first
nu-trient to drop below its half saturation constant is phosphate, then silicate and later nitrate, although not at all stations.
Table 2 attempts to indicate possible limiting nutrients for phytoplankton growth. The concentrations of 6DIN, phos-phate and silicate are given in the months when they are lowest for individual stations. For some stations, all three nutrients reach their lowest levels in the same month; then only the data of that month are listed and the N:P, Si:P and Si:N ratios are given. When N:P and Si:P are larger than
Table 2. Lowest nutrient concentrations observed (in bold), N:P, Si:P and Si:N ratios and possible limiting nutrient for each station.
Station Date 6DIN DIP Si N:P Si:P Si:N Limiting
(µM) (µM) (µM) Ratio Ratio Ratio Nutrient 120 Apr. 2003 14.05 0.07 0.92 211 14 0.1 Si (P) * May 2003 0.78 0.19 0.41 4 2 0.5 Si 215 May 2003 0.66 <0.01 0.36 >66 >36 0.5 P ZG02 May 2003 0.73 0.02 0.36 35 17 0.5 P 130 Apr. 2003 16.87 0.07 3.63 253 54 0.2 P May 2003 0.60 0.10 0.46 6 5 0.8 Si 230 May 2003 0.37 0.04 0.36 9 9 1.0 ? 330 May 2003 1.31 0.01 0.27 116 24 0.2 P 700 Apr. 2003 5.48 0.10 3.72 53 36 0.7 P June 2003 16.37 0.57 1.53 29 3 0.1 Si 710 Apr. 2003 1.51 0.09 2.27 18 27 1.5 P May 2003 1.15 0.13 0.55 9 4 0.5 Si 780 Apr. 2003 3.76 0.08 1.95 50 26 0.5 P May 2003 0.92 0.08 0.36 11 4 0.4 Si B07 Apr. 2003 6.85 0.13 2.79 52 21 0.4 P June 2003 3.30 0.23 1.06 14 5 0.3 Si
* Because Si can only be a limiting nutrient for diatoms, the limiting nutrient for Phaeocystis is indicated in brackets (P).
16, phosphate is likely to be the limiting nutrient. In the case where Si:P<16 and Si:N<1, then silicate is likely to be the limiting nutrient (for diatom growth). When N:P<16 and Si:N>1, nitrogen would be the limiting element. Note that for the four stations near the mouth of the estuary (700, 710, 780 and B07) and station 130, the phytoplankton is first P-limited but then becomes Si-limited. The stations that are least influenced by the river plumes (ZG02 and 330) are likely to be P-limited for phytoplankton growth. Phospho-rus limitation of primary production during the early spring bloom was also observed in the Gironde plume (Herbland et al., 1998; Labry et al., 2002), whereas the winter bloom was initiated by light availability (Labry et al., 2001). Pigment analyses and microscopic cell counts conducted on water samples obtained during the same cruises show that the phy-toplankton community was dominated by diatoms, except in April 2003 (R. Gonzales, unpublished results). The contri-bution of Phaeocystis to the total chlorophyll a was larger than 50% in April 2003 for all stations except station ZG02, which was not sampled in April, and station 700 (35%; R. Gonzales, unpublished results). At station 120, Si was indi-cated as limiting nutrient in April 2003 (Table 2). However, as Si can only be a limiting nutrient for diatoms and
Phaeo-cystis dominates the phytoplankton community, the limiting
nutrient for non-diatom species would be P as indicated in brackets. During the cruise in late May 2003, diatoms were again the dominant species. At no time is the
phytoplank-ton community limited by inorganic nitrogen in the Belgian coastal zone. When the N:P ratios are calculated using total dissolved N and P concentrations, i.e. including dissolved or-ganic nitrogen and phosphorus, P is limiting. This is because the DON concentration is more than 16 times that of DOP in the months considered. DON always constitutes a large frac-tion of the total dissolved nitrogen, in contrast to DOP, which becomes an important fraction only when the phosphate lev-els are low. De Galan et al. (2004) also reported that DON represents a major fraction of the total dissolved nitrogen, but a seasonal trend in the DON concentrations was not ob-served, possibly due to a too low sampling frequency.
4.4 DOP and phosphorus cycling
When the PO4 concentration is low, DOP is an important
source of biologically available phosphorus for both bac-teria and phytoplankton in marine ecosystems (Orrett and Karl, 1987; Bj¨orkman and Karl, 1994). DOP is not read-ily available to phytoplankton and bacteria, but it can be utilized as a phosphorus source by means of hydrolytic en-zymes: the non-specific alkaline phosphatase (Perry, 1972)
and 50-nucleotidase (Ammerman and Azam, 1985; Flynn et
al., 1986). Alkaline phosphatase is induced by low PO4
con-centrations and cleaves the -PO4moiety from organic
phos-phorus compounds after which the cell can assimilate the
PO4. Van Boekel and Veldhuis (1990) have shown that
by the external phosphate concentration and that the thresh-old concentration for derepression is around 0.5 µM. Unlike
alkaline phosphatase, 50-nucleotidase recognizes the carbon
moiety of nucleotides and is not inhibited at high PO4levels.
The winter DOP concentrations in the Belgian coastal zone (Fig. 10) are comparable to those reported for the olig-otrophic North Pacific Subtropical Gyre (∼0.2 µM; Church et al., 2002), the oligotrophic central Atlantic Ocean (0.1– 0.3 µM; Vidal et al., 1999) and the northeastern continental shelf of the USA (∼0.2 µM; Hopkinson et al., 1997). The el-evated DOP concentrations in the Belgian coastal zone are of similar magnitude to those reported for surface waters along the north coast of Australia (Mulholland et al., 2002) and the Southern California Bight (Ammerman and Azam, 1991). DOP concentrations of ∼0.2 µM are reported for the Baltic Sea, but higher DOP values of 0.35–0.75 µM were measured in cyanobacterial blooms (Nausch et al., 2004). The seasonal pattern of DOP (monthly averages from 1969 to 1977) in the Channel shows winter concentrations of 0.14–0.18 µM and elevated concentrations of 0.20–0.28 µM from April to Au-gust (Butler et al., 1979).
When the PO4 concentration is low, a significant
frac-tion of the dissolved P is present in the form of DOP.
Be-tween March and July, when the PO4concentration is lowest
(Fig. 8), phytoplankton and bacteria may have to turn to DOP as their phosphorus source. In general, it is assumed that elevated dissolved organic matter (DOM) concentrations in surface waters result from enhanced DOM production asso-ciated with primary production (Duursma, 1961). This may be due to DOM excretion from cells (Lancelot, 1979), vi-ral mediated cell lysis (Furhman and Shuttle, 1993), sloppy feeding by zooplankton (Eppley et al., 1981) or from parti-cle solubilization (Smith et al., 1992). The seasonal trend in DOP shows two periods of elevated concentrations (Fig. 8). The first period is in April for the most southwestern stations and in May for the most northeastern stations. This period of
elevated DOP concentration coincides with the lowest PO4
concentration and the highest chlorophyll a and corrected POP concentration, and therefore most likely corresponds to the period of elevated primary production. The second period of elevated DOP concentration occurs in August-September when the corrected POP concentration and the POP content
have decreased strongly and the PO4 concentration has
in-creased again. In this period, the organic phosphorus con-tained in cells is released upon their lysis and degraded, and the DOP is presumably further remineralised into phosphate. Turk et al. (1992) have demonstrated that bacterial biomass grazed by protozoa plays an important role in the cycling of P, due to the ejection of the consumed bacterial DNA and the subsequent rapid DNA degradation and liberation
of PO4. Thus, the elevated DOP concentrations indicate the
start of two distinct and consecutive periods of intensive P cycling. During the first period P is regenerated and sus-tains the bloom, and during the second period P is recycled as biomass is decaying.
5 Conclusions
Nutrient and P speciation data obtained by monthly cruises during one complete year were presented for 10 stations in Belgian coastal zone, and spatial and seasonal trends were studied. The river Scheldt has a strong influence on the dis-tribution of inorganic nutrients, DOC and possibly DON, but not on that of the DOP.
At most of the stations studied, PO4is the first nutrient to
decrease below its half-saturation value during the bloom
pe-riod, thereafter Si(OH)4and subsequently NO3. The
elemen-tal ratios of N, P and Si suggest that either P- or Si-limitation of phytoplankton growth could develop, and that at the sta-tions on the Scheldt transect, P-limitation is followed by
Si-limitation. The rate of regeneration of PO4 is much faster
than that of NO3and Si(OH)4, so that PO4is often already
restored to its winter concentrations in August/September. The DOP concentration is elevated at the time of the
low-est PO4 concentration and highest primary production as is
also frequently observed for the DOC concentration, but not for DON at our stations. A second period of elevated DOP concentration occurs during the decline of the bloom when
POP is degraded and PO4levels are restored. Thus, elevated
DOP concentrations are indicative for the onset of periods of intensive internal cycling of P. Phosphorus regeneration is an important process in the Southern Bight of the North Sea,
which allows phytoplankton growth even at very low PO4
levels.
Acknowledgements. The authors wish to thank the captain and
crew of the RV Zeeleeuw, A. Cattrijsse and F. Hernandez (VLIZ), as well as N. Roevros (ULB-LOGCE) for their logistic support. We are grateful to M. Tsagaris and C. de Marneffe (ULB-LOGCE) for their analytical work in the laboratory and to our ULB-LOGCE colleagues for their assistance at sea. R. James Evans polished our English. The comments and suggestions provided by the three anonymous reviewers and the handling editor helped to improve the clarity of this paper and are greatly appreciated. This study was supported by the Belgian Federal Science Policy Office under contract no. EV/11/20B (CANOPY). Partial funding provided by the SISCO project (contract no. EV/11/17A) is also acknowledged. This paper is dedicated to the late R. Wollast, a beloved colleague and friend, whom we miss dearly.
Edited by: A. Boetius
References
Abril, G., Nogueira, M., Etcheber, H., Cabec¸adas, G., Lemaire, E., and Brogueira, M. J.: Behaviour of organic carbon in nine con-trasting European estuaries, Est. Coast Shelf Sci., 54, 241–262, 2002.
Ammerman, J. W. and Azam, F.: Bacterial 5’-nucleotidase in aquatic ecosystems: A novel mechanism for phosphorus regen-eration, Science, 227, 1338–1340, 1985.
Ammerman, J. W. and Azam, F.: Bacterial 5’-nucleotidase activ-ity in estuarine and coastal marine waters: Role in phosphorus regeneration, Limnol. Oceanogr., 36, 1437–1447, 1991. Bishop, J. K. B., Collier, R. W., Ketten, D. R., and Edmond, J.
M.: The chemistry, biology and vertical flux of particulate matter from the upper 400 m of the equatorial Atlantic ocean, Deep Sea Res., 24, 511–548, 1977.
Bj¨orkman, K. and Karl, D. M.: Bioavailability of inorganic and or-ganic phosphorus compounds to natural assemblages of microor-ganisms in Hawaiian coastal waters, Mar. Ecol. Progr. Ser., 111, 265–273, 1994.
Borges, A. V. and Frankignoulle, M.: Distribution and air-water exchange of carbon dioxide in the Scheldt plume off the Belgian coast, Biogeochem., 59, 41–67, 2002.
Brion, N., Baeyens, W., De Galan, S., Elskens, M., and Laane, R. W. P. M.: The North Sea: source or sink for nitrogen and phosphorus to the Atlantic Ocean?, Biogeochem., 68, 277–295, 2004. Butler, E. I., Knox, S., and Liddicoat, M. I.: The relationship
be-tween inorganic and organic nutrients in sea water, J. Mar. Biol. Ass. U.K., 59, 239–250, 1979.
Cad´ee, G. C. and Hegeman, J.: Phytoplankton in the Marsdiep at the end of the 20th century; 30 years of monitoring biomass, primary production and Phaeocystis blooms, J. Sea Res., 48, 97– 110, 2002.
Church, J. J., Ducklow, H. W., and Karl, D. M.: Multiyear increases in dissolved organic matter inventories at station ALOHA in the North Pacific Subtropical Gyre, Limnol. Oceanogr., 47, 1–10, 2002.
Clark, L. L., Ingall, E. D., and Benner, R.: Marine phosphorus is selectively remineralized, Nature, 393, 426, 1998.
Conley, D. J., Schelske, C. L., and Stoermer, E. F.: Modification of the biogeochemical cycle of silica with eutrophication, Mar. Ecol. Progr. Ser., 101, 179–192, 1993.
Dafner, E., De Galan, S., and Goeyens, L.: Microwave digestion of organic substances, a useful tool for dissolved organic nitrogen measurements, Wat. Res., 33, 548–554, 1999.
De Galan, S., Elskens, M., Goeyens, L., Pollentier, A., Brion, N., and Baeyens, W.: Spatial and temporal trends in nutrient concen-trations in the Belgian continental area of the North Sea during the period 1993–2000, Est. Coast. Shelf Sci., 61, 517–528, 2004. Duursma, E.: Dissolved organic carbon, nitrogen and phosphorus
in the sea, Neth. J. Sea Res., 1, 1–148, 1961.
Eppley, R., Horrigan, S., Fuhrman, J., Brooks, E., Price, C., and Sellner, K.: Origins of dissolved organic mater in Southern Cal-ifornia coastal waters: experiments on the role of zooplankton, Mar. Ecol. Progr. Ser., 6, 149–159, 1981.
Fisher, T. R., Harding, L. W., Stanley, D. W., and Ward, L. G.: Phy-toplankton, nutrients and turbidity in the Chesapeake, Delaware and Hudson estuaries, Est. Coast. Shelf Sci., 27, 61–93, 1988. Flynn, K. J., Opik, H., and Syrett, P. J.: Localization of the alkaline
phosphatase and 5’-nucleotidase activities of the diatom Phaeo-dactylum tricornutum, J. Gen. Microbiol., 132, 289–298, 1986. Furhman, J. and Shuttle, C.: Viruses in marine planktonic systems,
Oceanography, 6, 51–63, 1993.
Garber, J.: Laboratory study of nitrogen and phosphorus mineral-ization during the decomposition of coastal plankton and seston, Est. Coast. Shelf Sci., 18, 685–702, 1984.
Grasshoff, K., Ehrhardt, M., and Kremling, K. (Eds.): Methods of Seawater Analysis, Verlag Chemie, Basel, 1983.
Gypens, N., Lancelot, C., and Borges, A. V.: Carbon dynamics and CO2air-sea exchanges in the eutrophied coastal waters of the southern bight of the North Sea: a modeling study, Biogeo-sciences, 1, 147–157, 2004,
SRef-ID: 1726-4189/bg/2004-1-147.
Herbland, A., Delmas, D., Laborde, P., Sautour, B., and Artigas, F.: Phytoplankton spring bloom of the Gironde plume waters in the Bay of Biscay: early phosphorus limitation and food-web consequences, Oceanol. Acta, 21, 279–291, 1998.
Hopkinson Jr., C. S., Fry, B., and Nolin, A. L.: Stoichiometry of dissolved organic matter dynamics on the continental shelf of the northeastern U.S.A., Cont. Shelf Res., 17, 473–489, 1997. Koroleff, F.: Direct determination of ammonia in natural waters as
indophenol blue, Int. Council Expl. Sea, 9, 19–22, 1969. Lacroix, G., Ruddick, K., Ozer, J., and Lancelot, C.: Modelling the
impact of the Scheldt and Rhine/Meuse plumes on the salinity distribution in Belgian waters (southern North Sea), J. Sea Res., 52, 149–163, 2004.
Labry, C., Herbland, A., Delmas, D., Laborde, P., Lazure, P., Froidefond, J. M., Jegou, A. M., and Sautour, B.: Initiation of winter phytoplankton blooms within the Gironde plume waters in the Bay of Biscay, Mar. Ecol. Progr. Ser., 212, 117–130, 2001. Labry, C., Herbland, A., and Delmas, D.: The role of phosphorus on planktonic production of the Gironde plume waters in the Bay of Biscay, J. Plankt. Res., 24, 97–117, 2002.
Lancelot, C.: Gross excretion rate of natural marine phytoplank-ton and heterotrophic uptake of excreted products in the south-ern North Sea, as determined by short-term kinetics, Mar. Ecol. Progr. Ser., 1, 179–186, 1979.
Lancelot, C., Billen, G., Sournia, A., Weisse, T., Colijn, F., Veld-huis, M. J. W., Davies, A., and Wassman, P.: Phaeocystis blooms and nutrient enrichment in the continental coastal zones of the North Sea, Ambio, 16, 38–46, 1987.
Lenhart, H. J., P¨atsch, J., and Radach, G.: Daily nutrient loads of the European continental rivers for the years 1977–1993, Institut f¨ur Meereskunde Bibliothek, Hamburg, Germany, 1996. Martin, J., Knauer, G., Karl, D., and Broenkow, W.: VERTEX:
car-bon cycling in the northeast Pacific, Deep-Sea Res., 34, 257–285, 1987.
MIDAS, Marine Information and Data Acquisition System: Flan-ders Marine Institute, underway data of the RV Zeeleeuw are available from http://www.vliz.be.
Mulholland, M. R., Floge, S., Carpenter, E. J., and Capone, D. G.: Phosphorus dynamics in cultures and natural populations of Tri-chodesmium spp., Mar. Ecol. Progr. Ser., 239, 45–55, 2002. Nausch, M., Nausch, G., and Wasmund, N.: Phosphorus dynamics
during the transition from nitrogen to phosphate limitation in the central Baltic Sea, Mar. Ecol. Progr. Ser., 266, 15–25, 2004. North Sea Task Force: North Sea Quality Status Report (QSR), Oslo
and Paris Commisions, London and International Council for the Exploration of the Sea, Copenhagen, 1993.
Orrett, K. and Karl, D. M.: Dissolved organic phosphorus produc-tion in surface waters, Limnol. Oceanogr., 32, 383–395, 1987. OSPARCOM: Quality status report 2000, OSPAR Commission,
London, available from http://www.ospar.com, 212, 2002. Parcom: Parcom recommandation 88/2 of 17 June 1988 on the
re-duction in inputs of nutrients to the parties convention area, avail-able from http://www.ospar.org, 1, 1988.
North Pacific waters using a sensitive fluorometric method, Mar. Biol., 15, 113–119, 1972.
Philippart, C. J. M., Cadee, G. C., van Raaphorst, W., and Riegman, R.: Long-term phytoplankton-nutrient interactions in a shallow coastal sea: Algal community structure, nutrient budgets, and denitrification potential, Limnol. Oceanogr., 45, 131–144, 2000. Prandle, D., Hydes, D. J., Jarvis, J., and McManus, J.: The seasonal cycles of temperature, salinity, nutrients and suspended sediment in the southern North Sea in 1988 and 1989, Est. Coast. Shelf Sci., 45, 669–680, 1997.
Rousseau, V., Leynaert, A., Daoud, N., and Lancelot, C.: Diatom succession, silicification and silicic acid availability in Belgian coastal waters (southern North Sea), Mar. Ecol. Progr. Ser., 236, 61–73, 2002.
RWS, Rijkswaterstaat: Database is available from http://www. waterbase.nl.
Skogen, M. D., Søiland, H., and Svendsen, E.: Effects of changing nutrient loads to the North Sea, J. Mar. Sys., 46, 23–38, 2004. Smith, D., Simon, M., Alldredge, A., and Azam, F.: Intense
hy-drolytic enzyme activity on marine aggregates and implications for rapid particle dissolution, Nature, 359, 129–142, 1992. Smith, S. V., Swaney, D. P., Talaue-McManus, L., Bartley, J. D.,
Sandhei, P. T., McLaughlin, C. J., Dupara, V. C., Crossland, C. J., Buddemeier, R. W., Maxwell, B. A., and Wulff, F.: Humans, hydrology, and the distribution of inorganic nutrient loading to the ocean, BioScience, 53, 235–245, 2003.
Solorzano, L. and Sharp, J. H.: Determination of total dissolved phosphorus and particulate phosphorus in natural waters, Lim-nol. Oceanogr., 25, 754–758, 1980.
Sugimura, Y. and Suzuki, Y.: A high-temperature catalytic oxida-tion method for the determinaoxida-tion of non-volatile dissolved or-ganic carbon in seawater by direct injection of a liquid sample, Mar. Chem., 24, 105–131, 1988.
Suzuki, Y.: On the measurement of DOC and DON in seawater, Mar. Chem., 41, 287–288, 1993.
Tungaraza, C., Rousseau, V., Brion, N., Lancelot, C., Gichuki, J., Baeyens, W., and Goeyens, L.: Contrasting nitrogen uptake by diatom and Phaeocystis-dominated phytoplankton assemblages in the North Sea, J. Exp. Mar. Biol. Ecol., 292, 19–41, 2003. Turk, V., Rehnstam, A., Lundberg, E., and Hagstrom, A.: Release of
bacterial DNA by marine nanoflagellates, an intermediate step in phosphorus regeneration, Appl. Environ. Microbiol., 58, 3744– 3750, 1992.
Turner, R. E., Rabalais, N. N., Justic, D., and Dortch, Q.: Fu-ture aquatic nutrient limitations, Mar. Poll. Bul., 46, 1032–1034, 2003a.
Turner, R. E., Rabalais, N. N., Justic, D., and Dortch, Q.: Global patterns of dissolved N, P and Si in large rivers, Biogeochem., 64, 297–317, 2003b.
Van Bennekom, A. J. and Wetsteijn, F. J.: The winter distribution of nutrients in the southern bight of the North Sea (1961–1978) and in the estuaries of the Scheldt and the Rhine/Meuse, Neth. J. Sea Res., 25, 75–87, 1990.
Van Beusekom, J. J. E. and Brockmann, U. H.: Transformation of phosphorus in the Elbe estuary, Estuaries, 21, 518–526, 1998. Van Boekel, W. H. M. and Veldhuis, M. J. W.: Regulation of
alka-line phosphatase synthesis in Phaeocystis sp., Mar. Ecol. Prog. Ser., 61, 281–289, 1990.
Vidal, M., Duarte, C. M., and Agusti, S.: Dissolved organic nitrogen and phosphorus pools and fluxes in the central Atlantic Ocean, Limnol. Oceanogr., 44, 106–115, 1999.
Yentsch, C. S. and Menzel, D. W.: A method for the determination of phytoplankton chlorophyll and phaeophytin by fluorescence, Deep-Sea Res., 10, 221–231, 1963.