HAL Id: hal-02051013
https://hal.sorbonne-universite.fr/hal-02051013
Submitted on 27 Feb 2019HAL is a multi-disciplinary open access archive for the deposit and dissemination of sci-entific research documents, whether they are pub-lished or not. The documents may come from teaching and research institutions in France or abroad, or from public or private research centers.
L’archive ouverte pluridisciplinaire HAL, est destinée au dépôt et à la diffusion de documents scientifiques de niveau recherche, publiés ou non, émanant des établissements d’enseignement et de recherche français ou étrangers, des laboratoires publics ou privés.
Dissociation of the Dimer of the Intrinsically Disordered
Domain of RNase Y upon Antibody Binding
Pierre Hardouin, Christophe Velours, Charles Bou-Nader, Nadine Assrir,
Soumaya Laalami, Harald Putzer, Dominique Durand, Beatrice
Golinelli-Pimpaneau
To cite this version:
Pierre Hardouin, Christophe Velours, Charles Bou-Nader, Nadine Assrir, Soumaya Laalami, et al.. Dissociation of the Dimer of the Intrinsically Disordered Domain of RNase Y upon Antibody Binding. Biophysical Journal, Biophysical Society, 2018, 115 (11), pp.2102-2113. �10.1016/j.bpj.2018.10.016�. �hal-02051013�
Dissociation of the dimer of the intrinsically disordered domain of RNase Y upon antibody binding
Pierre Hardouin1, Christophe Velours2, Charles Bou-Nader1, Nadine Assrir3, Soumaya Laalami4, Harald Putzer4, Dominique Durand2, Béatrice Golinelli-Pimpaneau1*
1 Laboratoire de Chimie des Processus Biologiques, UMR 8229 CNRS, Collège de France, Université
Pierre et Marie Curie, 11 Place Marcelin Berthelot, 75231 Paris cedex 05, France
2 Institute for Integrative Biology of the Cell (I2BC), CEA, CNRS, Université Paris-Sud, Université
Paris-Saclay, Avenue de la Terrasse, 91198 Gif-sur-Yvette cedex, France
3 Structural Chemistry and Biology Team, Institut de Chimie des Substances Naturelles, CNRS UPR
2301, Université Paris-Sud, Université Paris-Saclay, Gif-sur-Yvette, France
4 CNRS UMR8261 - Université Paris Diderot, Sorbonne Paris Cité, Institut de Biologie
Physico-Chimique, 13 rue Pierre et Marie Curie, 75005 Paris, France
Keywords : Intrinsically Disordered Proteins (IDP) & Aggregates, Protein Structure & Conformation, X-Ray Crystallography, X-Ray & Neutron Scattering & Diffraction, Optical Spectroscopy (CD & UV-VIS)
Abstract
Although RNase Y acts as the key enzyme initiating mRNA decay in Bacillus subtilis and likely in many other Gram positive bacteria, its three-dimensional structure remains unknown. An antibody, belonging to the rare IgG2b, lx isotype, was raised against a 12-residue conserved peptide from the N-terminal non-catalytic domain of Bacillus subtilis RNase Y (BsRNaseY) that is predicted to be intrinsically disordered. Here we show that this domain can be produced as a stand-alone protein called Nter-BsRNaseY that undergoes conformational changes between monomeric and dimeric forms. Circular dichroism and Size Exclusion Chromatography coupled with Multi-Angle Light Scattering or with Small Angle X-ray Scattering (SEC-MALS and SEC-SAXS) indicate that the Nter-BsRNaseY dimer displays an elongated form and a high content of a-helices, in agreement with the existence of a central coiled-coil structure appended with flexible ends, and that the monomeric state of Nter-BsRNaseY is favored upon binding the Fab (fragment antigen binding) of the antibody. The dissociation constants of the IgG/BsRNaseY, IgG/Nter-BsRNaseY and IgG/peptide complexes indicate that the affinity of the IgG for Nter-BsRNaseY is in the nM range and suggest that the peptide is less accessible in BsRNaseY than in Nter-BsRNaseY. The crystal structure of the Fab in complex with the peptide antigen shows that the peptide adopts an elongated U-shaped conformation, in which the unique hydrophobic residue of the peptide, Leu6, is completely buried. The peptide/Fab complex may mimic the interaction of a microdomain of the N-terminal domain of BsRNaseY with one of its cellular partners within the degradosome complex. Altogether, our results suggest that BsRNaseY may become accessible for protein interaction upon dissociation of its N-terminal domain into the monomeric form.
The processing and degradation of mRNA is a key element in the control of prokaryotic gene expression (1-3). In E. coli, RNase E has a pivotal role in these processes (4) but Bacillus
subtilis and many other Gram positive bacteria have a very different set of enzymes directing
mRNA metabolism (5-7). Indeed, in B. subtilis, a novel endoribonuclease called RNase Y (BsRNaseY) shares extensive functional homologies with RNase E despite the absence of sequence similarity (8). Although not essential for cell viability, the crucial role of RNase Y in initiating mRNA cleavage is highlighted by deletion experiments of the rny gene, which led to defects in cell growth, cell morphology and hypersensitivity to antibiotics (9). The abundance of a large number of transcripts is affected by decreasing RNase Y expression (8, 10-14). Consequently, the half-life of mRNA is increased two-fold when RNase Y is depleted (8). The three-dimensional structure of BsRNaseY is unknown but a structure prediction analysis revealed its probable architecture (12)(Figure S1 in the Supporting Material): a transmembrane (TM) region, anchoring the protein to the membrane and predicted to span residues 6-24 according to the TMpred server, is followed by an intrinsically disordered domain (IDD) (Figure 1), a catalytic domain with KH (residues 210-280) (15) and HD motifs (residues 330-430) (16) and a C-terminal region of unknown function. Although the IDD region is predicted to be highly disordered, as detected by disorder predictor programs such as IUPRED (17) (Figure S1A), it is also predicted to be organized mainly as a-helices by secondary structure prediction programs and to adopt a flexible coiled-coil-like structure (12). The IDD is hypothesized to adopt various conformations to enable the protein to interact with several cellular partners (RNA or proteins), a typical behavior for intrinsically disordered proteins (18-22).
Only a few in vitro studies of BsRNaseY have been reported, including activity tests (8) and ultracentrifugation experiments that showed that the main oligomeric form is a dimer (12). To get more information about the three-dimensional structure of RNase Y, we raised an antibody
against a small region of the IDD. Not only could this antibody stabilize the conformation of RNase Y, which would favor crystallization of the complex, but it could also serve to get insights into the structure/function of the IDD.
We report here the characterization of the interaction between BsRNaseY and an antibody named RY79-90 raised against a 12-residue peptide from the IDD (Figure 1) using ELISA (Enzyme Linked ImmunoSorbent Assay) and Size Exclusion Chromatography coupled with Multi-angle light scattering (SEC-MALS). Our results show that the antibody binds BsRNaseY with high affinity but is more specific for its N-terminal domain. We produced this domain as a stand-alone protein called Nter-BsRNaseY and characterized its structure by circular dichroism (CD) spectroscopy and Size Exclusion Chromatography coupled with Small Angle X-ray Scattering (SEC-SAXS). Nter-BsRNaseY, which displays a fast equilibrium between monomeric and dimeric forms, is bound as a monomer when complexed with the fragment antigen binding (Fab) of RY79-90. We also solved the crystal structure of Fab RY79-90 in complex with the peptide used to raise the antibody. We show that the peptide undergoes an induced folding upon binding antibody RY79-90 and discuss how the detailed interactions of the peptide/Fab complex observed in the crystal structure could mimic the binding of a microdomain of the N-terminal domain of BsRNaseY and a cellular partner.
MATERIALS & METHODS Antibody selection
The sequence of B. subtilis RNase Y was analyzed by the Abmart Company (Shanghai, China) using the SEALTM algorithm designed for identifying protein fragments most susceptible to yield monoclonal antibodies. Sixantigen peptides, five of them contained within the IDD of B.
subtilis RNase Y, were selected for immunization. All antibodies were tested for their
sensitivity and specificity to detect RNase Y in total B. subtilis cell extracts or the purified protein by Western blotting as described (23). Briefly, cell extracts, prepared by ultrasonic disruption as reported (24), or BsRNAseY purified by Ni-NTA chromatography were separated on a 10% SDS-PAGE gel. Monoclonal antibodies were used at a final concentration of 2 µg/ml and the signal was quantified by chemiluminescence (ECL GE Healthcare) using a horseradish peroxidase (HRP) secondary antibody conjugate (GE Healthcare). Finally, peptide 79-90 (ERRNELQKQENR) was chosen for large scale production of monoclonal antibody in mice ascitic fluid.
Production, purification and characterization of the Fab fragment
The IgG (IgG2b, lx) was produced from mice ascitic fluid, purified by Protein A affinity chromatography by Abmart Company and stored in 50 mM Tris, 100 mM Glycine pH 9, 0.5% ProClin 300 (Sigma-Aldrich). The Fab was generated by papain digestion of the antibody at 37°C in 20 mM sodium phosphate, 274 mM NaCl, 5.4 mM KCl pH 7.4, 1.25 mM EDTA, 1.25 mM 2-mercaptoethanol using a 0.5 % papain: antibody ratio (w/w) for 5 hours. Undigested IgG and Fc fragment were removed by HiTrapQ anion exchange chromatography. The Fab was dialyzed against 200 mM NaCl, 5% glycerol and concentrated to 6.5 mg/ml.
Fab sequence determination
Sequencing of the variable heavy chain was performed by ProMab Biotechnologies Inc, Richmond, CA (USA). Total RNA was extracted from 100,000 hybridoma cells. Using PCR methods and a mixture of constant region sequences, the scFv region was amplified for cloning and sequencing. The sequence of the variable light chain could not be determined by this method, probably because of its very rare Vlx isotype, as identified during structure solving by X-ray crystallography (see below). Mass spectrometry analysis of the lower mass protein band
of Fab after migration on a SDS-PAGE gel under reducing conditions confirmed that the amino acid sequences of the Fab RY79-90 light chain and Fab 13F6-1-2 (25) differ only in 3 amino acids.
Expression of Nter-BsRNaseY and BsRNaseY
The coding sequence of the rny gene from K26 to K520 (thus lacking the N-terminal transmembrane domain) was PCR-amplified from chromosomal DNA of strain SSB1002, a wild-type B. subtilis laboratory stock strain derived from strain 168, using oligonucleotides HP1182 (5’TGATTCACTCATATGAAAACCATTGCCGAAGCGAAAATTGCG3’) and HP1116
(5’AGCTAGGATCCTTAGTGATGATGATGATGGTGTTTTGCATACTCTACGGCTCGA GTC3’). The 1.5 kb PCR fragment bearing the sequence coding for the hexahistidine tag at its 3’ end was inserted as an NdeI-BamHI fragment into the T7 expression vector pKYB1 plasmid (New England Biolabs) cleaved with NdeI and BglII. Recombinant plasmids from E. coli JM109 were then transformed into E. coli BL21(DE3) star codon⁺ competent cells. One colony was used to inoculate 200 ml of Luria Broth medium supplemented with kanamycine (25 µg/ml) and chloramphenicol (30 µg/ml).
For the Nter-BsRNaseY construct, the sequence corresponding to amino acids V24 to N192 of BsRNaseY appended with a C-terminal hexahistidine tag was PCR-amplified from chromosomal DNA of strain SSB1002 using the Sequence Ligation Independent Cloning method (26). The PCR fragment was inserted as an NdeI-BamHI fragment into the T7 expression vector pET22b (New England Biolabs). The recombinant plasmid was then transformed into E. coli BL21(DE3) star codon⁺ competent cells. One colony was used to inoculate 200 ml of Luria Broth medium supplemented with ampicillin (50 µg/ml) and chloramphenicol (30 µg/ml).
Precultures (0.5% v/v) grown overnight at 37◦C at 180 rpm were used to inoculate 2 liters of LB medium supplemented with the same antibiotics. Cultures were grown at 37°C to an OD600
of 0.8. Expression was then induced by addition of isopropyl-b-D-thiogalactopyranoside (IPTG) to a final concentration of 0.1 mM and incubation was extended overnight at 23°C. After centrifugation for 10 min at 5000 rpm and 4°C, cells were stored at −80°C or used immediately.
Purification of Nter-BsRNaseY and BsRNaseY
Cells were resuspended in 1.5 ml/g of 20 mM HEPES pH 7.5, 500 mM NaCl, 10% glycerol (buffer A) containing 20 µl/ml cOmplete™ Protease Inhibitor Cocktail (Roche), 10 mM β-mercaptoethanol, 2 µg/ml of RNase A (Thermo Fisher), 1 mg/ml lysozyme, 0.25% Tween 20, and disrupted by sonication. Cells debris were removed by ultracentrifugation at 100,000g for 1h at 4°C. The supernatant was loaded onto a 15 mL Ni-NTA Superflow column (Qiagen) equilibrated in buffer A containing 20 mM imidazole, 0.25% Tween 20. The column was washed with 70 mM imidazole and the proteins were eluted with 200 mM imidazole in buffer A. Fractions containing the proteins were then loaded at 2.5 mg/ml (BsRNaseY) or 4.5 mg/ml (Nter-BsRNaseY) on a Superdex 200 26/60 PG column (GE Healthcare) in buffer A. Protein elution was followed by the optical density at 230 nm because of the rarity or absence of aromatic residues in the BsRNaseY and NterBsRNaseY sequences. After concentration to 5 mg/ml using Amicon concentrators (30 kD cutoff, Milllipore), proteins were aliquoted, frozen in liquid nitrogen and stored at -80°C.
Gel shift assay for monitoring interaction between Fab RY79-90 and BsRNaseY
Interaction between Fab RY79-90 and BsRNaseY was assessed on a 4% native PAGE gel. BsRNaseY at fixed concentration (5 µM) was mixed with Fab at concentrations ranging from
0.1 µM to 5 µM in 20 mM HEPES pH 8.0, 100 mM NaCl, 10% glycerol. After 30 min incubation at 20°C, the mixture was loaded on a native gel (prepared with Tris-glycine pH 8.9 and prerun at 4°C in TBE buffer 0.5x at 100 V for 20 min). The migration was performed at 4°C in TBE 0.5x at 150 V for 150 min.
Determination of the dissociation constants for the IgG/BsRNaseY, IgG/Nter-BsRNaseY, and IgG/peptide complexes
The Kds were estimated by three independent measurements using a competitive ELISA assay,
as described (27) (See Supplementary Methods).
Determination of the absolute molar masses of Fab, Nter-BsRNaseY and the Fab/Nter-BsRNaseY complex by SEC-MALS
SEC-MALS experiments were performed using an HPLC system (Shimadzu) equipped with static light scattering (mini DAWN TREOS, Wyatt Technology), refractive index (Optilab T-rEX, Wyatt Technology) and UV detectors (SPD-M20A, Shimadzu). 100 µl of Nter-BsRNaseY, Fab RY79-90 and the Nter-BsRNaseY/Fab RY79-90 mixture were loaded onto a Superdex 200 10/300 GL increase column (GE Healthcare) equilibrated in 40 mM MES pH 6.8, 150 mM NaCl buffer at a flow rate of 0.5 ml.min-1. A 1:2 ratio of Nter-BsRNaseY/Fab RY79-90 was chosen to ensure that all Nter-BsRNaseY was bound in the complex, given that free Nter-BsRNaseY eluted near the Nter-BsRNaseY/Fab complex, which could affect the molar mass determination of the complex. The absolute molar masses of the proteins were calculated using version 6.1 of the ASTRA software (Wyatt Technology) and a refractive index increment (dn/dc) value of 0.183 ml.g−1. The hydrodynamic radii were determined using the QELS module (Wyatt technology).
Determination of the dissociation constant of the Nter-BsRNaseY dimer/monomer equilibrium using SEC-MALS
The dissociation constant (Kd) of the Nter-BsRNaseY dimer was calculated using SEC-MALS.
Nter-BsRNaseY (100 µl) at a concentration ranging from 30 to 945 µM was loaded onto a Superdex 200 10/300GL increase column equilibrated with 40 mM MES buffer pH 6.8, 200 mM NaCl. Data were fitted by nonlinear regression to the equation:
!" = M%(8 M (+ K+− -+
.+ 8 M (-+
4 M ( )
as described previously (28, 29). Mw is the weight-averaged molar mass measured, MN is the
theoretical molar mass of Nter-BsRNaseY (20,665 Da), [M]T is the molar concentration of the
monomer determined by the refractive index detector. The Kd for the dimer-monomer
equilibrium was calculated using the program CurveExpert Professional 2.6.3 (Hyams Development).
Circular dichroism (CD) spectroscopy
The CD spectrum of Nter-BsRNaseY (485 µM in 40 mM MES pH 6.8, 200 mM NaCl) was recorded at 25°C in a 0.01 mm path-length quartz cuve (121.QS, Hellma) over the 185-260 nm spectral range using a JASCO J-810 CD spectropolarimeter equipped with a PFD 423S/L Peltier temperature controller. The spectrum consisted of an average of five consecutive scans acquired at a speed of 50 nm/min, with a time response of 1s for a 1.0 nm band-width. The spectrum was corrected by subtracting the contribution of the buffer measured under the same conditions. Data recorded in mdeg were converted as Δε (M−1.cm−1). Secondary structure estimates were derived from the normalized spectra using the CDSSTR, SELCON3, CONTIN/LL algorithms of the DICHROWEB server or K2D3 (30 , 31).
Determination of the stoichiometry of the Nter-BsRNaseY/Fab RY79-90 complex by SEC-MALS
Protein stoichiometry analysis of the Nter-BsRNaseY/Fab RY79-90 complex (at 1:2 ratio) was performed by SEC-MALS using the ‘UV extinction from RI peak’ method (28) and the protein conjugate method (29) (See Supplementary Methods). In the first method, the UV280 extinction
coefficients of the peaks are extracted from the SEC-MALS data and compared to the predicted extinction coefficients for the complex at different ratios, which are calculated from the amino acid sequence.
SEC-SAXS data collection and analysis
SAXS data on Nter-BsRNaseY were collected on beam line SWING of the SOLEIL synchrotron on a sample eluting from an analytical SEC-column being directly loaded into the SAXS flow-through capillary cell (32). Nter-BsRNaseY was injected at 20 mg/ml onto a BioSEC3 column (Agilent) equilibrated in 20 mM HEPES pH 7.5, 150 mM NaCl, 5% glycerol. The flow rate was 200 µl/min, the frame duration 0.75 s and the dead time between frames 0.01 s. The scattering of the elution buffer before void volume was recorded and subtracted from all protein scattering curves. The scattered intensities were displayed on an absolute scale using the scattering by water. The analysis of the full set of SAXS curves measured during the elution was first performed using FOXTROT (32), the SWING in-house software, and then the US-SOMO HPLC module (33). This program provides for each frame the values of the scattering intensity I(0) and of the radius of gyration Rg by applying the Guinier analysis together with a
calculation of the approximate molar mass using the Rambo & Tainer approach (34). Identical frames under the elution peak were finally selected using the CorMap program (35) and averaged for further analysis. The distance distribution function P(r) was calculated from the averaged scattering curve using the GNOM program from the ATSAS suite (36).
SAXS modelling
In order to obtain an atomic representation of the protein, we submitted the sequence of Nter-BsRNaseY to the fully automated protein structure homology-modelling server SWISS-MODEL (https://swissmodel.expasy.org/). Interestingly, the program provided a dimer model with a long coiled-coil between residues 61 and 134. The missing N- and C-terminal parts of each monomer were subsequently modeled using DADIMODO (37) (38), which kept rigid the coiled-coil dimer and refined the position of the terminal parts against SAXS data. This modelling, which was repeated ten times, showed that the N- and C-terminal parts of each monomer are very flexible and that the dimer of Nter-BsRNaseY is able to adopt a great variety of conformations. In these conditions, an approach in terms of conformation ensembles using for example the EOM program (39) would give little additional information and was not explored.
Crystallization of the Fab79-90/peptide complex
Fab79-90 (5 mg/ml) was mixed with a slight excess of the peptide ligand (1 Fab:1.2 peptide ratio) to ensure full occupancy of the Fab combining site. Crystals were grown in 16 % PEG 4000, 0.2 M MgCl2, 0.1 M Tris-HCl pH 8.5, then flash cooled in a nitrogen stream at 100K in
the same solution containing 20% glycerol.
X-Ray Data Collection and Structure Determination
Diffraction data were recorded on PX1 beamline at the SOLEIL synchrotron. Data were processed with XDS (40) (Table S1). Molecular replacement with PHASER (41) using various antibodies of known structure identified antibody Fab13F6-1-2 (PDB code 2QHR) (25), which belongs to the IgG2a, lx class, as the best model for both the Fv and the CL-CH1 dimer. The
atomic model was refined by alternating cycles of model reconstruction with COOT (42) and refinement with BUSTER (43). The final refinement statistics are given in Table S1. Figures were drawn with PYMOL. ThrL51 in CDRL2, which lies in the disallowed region of the Ramachandran plot, belongs to a g turn, as commonly observed in all antibody structures.
RESULTS AND DISCUSSION
RY79-90 is an IgG2b, lx antibody induced against a 12-residue conserved peptide of the
RNase Y IDD
After having identified peptides from BsRNaseY most susceptible to be immunogen, six mouse monoclonal antibodies were produced. Among them, one antibody induced against the 12-residue peptide (ERRNELQKQENR) covering 12-residues 79 to 90 was selected for its high affinity for BsRNaseY, as judged by Western-blot analysis (Fig. 1B), and the fact that it belongs to a conserved region of the IDD of BsRNaseY (Fig. 1A). The antibody, named RY79-90, has a heavy chain belonging to the IgG2b isotype and utilizes a rare Vlx light chain that is observed in only 0.5% of antibody sequences (44) (Figure S2). The amino acid sequences of Vlx chains are only 30-33% identical to that of other Vl or Vk light chains. They generally display very few somatic mutations (25, 45, 46) and no junctional diversity caused by the rearrangement of the Vlx and Jl2 segments (44). A characteristic of the Vlx class is that the complementary determining region (CDR) L3, which is entirely encoded by the Vlx gene fragment, is four amino acids longer than in all other antibody light chains (Figure S2). It has been suggested that this unusual light chain confers specificity to the antibodies that contain it (47). As shown below, CDRL3 is a major determinant of antigen recognition. To our knowledge, there are only two known crystal structures of Fab or Fv (variable fragment) bearing a lx light chain:
Fab 13F6-1-2 (PDB code 2QHR) (25) and Fv MW1 (PDB code 2OTU and 2OTW)(46), both solved in complex with their peptide antigen.
Sequence comparison of the light chains of Fab RY79-90, Fab 13F6-1-2 and the Vlx germline gene indicates that Fab RY79-90 underwent almost no maturation affinity, as the only mutated amino acid was Glu at position L80 instead of Pro in the germline sequence (Figure S2). Interestingly, the heavy chain isotype distribution of Vlx-bearing antibodies in normal mouse serum, upon immunization with myelin basic protein, showed a bias towards g2a and 2b isotypes (47). The heavy chain of Fab RY79-90 belongs also to the IgG2b isotype. VH comes from a combination of the V segment of the Igh-VGAM3.8 VH9 family, a D segment that could not be identified because it is too short and the JH3 segment (Figure S2). There are 10 amino acid mutations compared to the germline gene in the V segment, including one in CDRH1 and two in CDRH2. CDRH3 is exceptionally short, with only three amino acids.
IgG RY79-90 has a higher affinity for the inducing peptide and Nter-BsRNaseY than for BsRNaseY
In order to find out if the conformation of the peptide in interaction with the antibody is representative of its conformation within BsRNaseY in solution, the affinity of IgG RY79-90 for the inducing peptide, Nter-BsRNaseY and BsRNaseY, both lacking the N-terminal transmembrane a helix, was determined by a competitive ELISA test (27). The dissociation constants for the complexes of the IgG with BsRNaseY, Nter-BsRNaseY and the inducing peptide were 122.6 ± 6.6 nM, 8.9 ± 0.75 nM and 0.36 ± 0.04 nM, respectively (Figure S3). Thus, the affinity of IgG RY79-90 for the peptide is 14 times stronger than for Nter-BsRNase Y and 350 times stronger than for BsRNaseY. The peptide, which seems less accessible in BsRNaseY than in Nter-BsRNaseY, appears as a main determinant of the interaction of BsRNaseY with the antibody. To further study structural aspects of the
antibody/Nter-BsRNaseY interaction, a Fab fragment of IgG RY79-90 was generated by papain digestion and purified. The interaction of Fab RY79-90 and BsRNase Y was assessed on a native PAGE gel (Figure 1C).
Nter-BsRNaseY displays a fast equilibrium between monomeric and dimeric forms
The retention volume of a macromolecule on a SEC column depends on its hydrodynamic radius. Thus, SEC alone allows an estimation of its molar mass only if it is globular. Yet, combining SEC with multi-angle light scattering, UV detector and refractometer (SEC-MALS) provides a useful tool for accurate determination of absolute molar mass and oligomeric state of all proteins in native conditions (48, 49). Moreover, the QELS detector allows the calculation of the hydrodynamic radius independently of the retention volume determined by SEC. In this technique, which does not rely on the calibration of standards and assumptions of the globular state of the protein, the on-line measurement of the intensity of the Rayleigh scattering as a function of the angle as well as the differential refractive index of the eluting peak in SEC allow molar mass calculation at any point in the elution chromatogram and characterization of each population in a mixed sample (50). Therefore, SEC-MALS was used to analyze Nter-BsRNaseY at different concentrations in solution and determine its absolute molar mass (Figure 2A). The chromatogram shows a single specie eluting around 12.5 ml on a Superdex 200 gel filtration column (Figure 2A &2B, blue curve) whose absolute molar mass depends on protein concentration and is intermediate between the expected value for a monomer (theoretical mass of 20.7 kDa) and a dimer (theoretical mass of 41.3 kDa). This feature indicates that the monomer and another oligomeric form of Nter-BsRNaseY are in a fast equilibrium, as shown in the case of other proteins (51 , 52). MALDI-MS analysis confirmed that the peak around 12.5 ml corresponds to Nter-BsRNaseY and not to a protein contaminant (data not shown). At high concentrations, the molar mass of Nter-BsRNaseY is 40.0 kDa, very close to the
theoretical molar mass of the dimer (Table S2). The dissociation constant for the homodimer of Nter-BsRNaseY was then determined by SEC-MALS to be 1.3 µM by monitoring the weight-averaged molar mass as a function of protein concentration (Figure 2A, insert). The existence of a dimeric form of Nter-BsRNaseY is in agreement with bacterial-2-hybrid experiments with the isolated domains, which suggested that the N-terminal domain of BsRNaseY is a main contributor to the dimerization of BsRNaseY (12).
The Nter-BsRNaseY dimer is probably organized as a central coiled coil appended with disordered regions
The secondary structure of Nter-BsRNaseY was analyzed by far-UV circular dichroism (CD) spectroscopy (Figure 3A). The CD spectrum clearly shows that the dimer at 485 µM is not completely disordered but contains a high content of a-helices. A qualitative analysis using the CDSSTR, CONTIN/LL and K2D3 algorithms indicates a content of 50-60% of a-helices and 30-40% disordered regions. Similar CD spectra and a-helices content were obtained for a concentration of Nter-BsRNaseY between 3 and 485 µM (data not shown), in agreement with the Kd value of 1.3 µM for the dimer-monomer equilibrium determined by SEC-MALS, which
indicates that the secondary structure of Nter-BsRNaseY is unchanged at all these concentrations. Thus, the CD analysis indicates that a large region of the Nter-BsRNaseY dimer is probably organized as a coiled-coil structure, as predicted (12).
In-line SEC-SAXS (53, 54)was used to further analyze the structure of Nter-BsRNaseY in solution.In a SEC-SAXS experiment, SAXS measurements are continuously performed and analyzed immediately after SEC separation while the solution is eluted (see Materials and Methods). Figure 3B shows the evolution during elution of the gyration radius Rg and of the
The molar mass keeps constant at a value of about 40 kDa before decreasing at the end of the elution. This is in perfect agreement with the presence of dimers that dissociate at low concentration.
The resulting SAXS curve averaged on the plateau gives values for Rg and the maximal
extension Dmax of 61.3 and 215 Å, respectively, much higher than those expected for a compact
protein of n = 2 x 176 residues (Rg ~ 3n1/3 = 21 Å and Dmax ~2.6Rg = 55Å). Therefore, the Dmax
and Rg values indicate a highly elongated shape for Nter-BsRNaseY. Moreover, the distance
distribution function P(r) and the scattering curve, shown in dimensionless Kratky representation, are strongly different from the dimensionless curves characteristic of a fully unstructured protein (such as protein II-1ng about the same size (55)) (Figure S4). Coupling this qualitative information with the strong propensity of Nter-BsRNaseY to form coiled-coil and with the high a-helices content detected by circular dichroism spectrsocopy, we constructed atomic models (see Materials and Methods) that integrate all experimental results and that provide in particular a very good fit to the experimental SAXS curve (Figure 3C). These models, which display a central coiled-coil appended with flexible ends, are only representative but suggest the possible conformation of free Nter-BsRNaseY in solution.
One Fab binds to one Nter-BsRNaseY monomer
The SEC-MALS profile of Fab RY-79-90 displays two main peaks (Table S2 & Figure 2B, black curve). The major species, eluting at 14.7 ml, exhibits a molar mass of 46.0 kDa corresponding to the theoretical mass of the Fab (46.1 kDa). The Nter-BsRNaseY/Fab mixture leads to the appearance of a new peak eluting at 12.1 ml with a molar mass of 69.7 kDa (Table S2 & Figure 2B, red curve). SEC-MALS data analysis using the “UV extinction from RI peak” method in the ASTRA software (28) indicated an experimental extinction coefficient for the Nter-BsRNaseY/Fab RY79-90 complex of 1.09 ml.mg-1cm-1, close to the theoretical extinction coefficient for a complex with a stoichiometry of 1 Fab per one Nter-BsRNaseY monomer
(1.103 ml.mg-1cm-1). Moreover, given that the extinction coefficients for Nter-BsRNaseY and Fab RY79-90 are significantly different, the protein conjugate method could also be used to determine the diffusion signal corresponding to each protein (29). The deduced molecular weights of Fab and Nter-BsRNaseY in the complex were 48.2 kDa and 22.0 kDa, respectively, confirming the 1:1 stoichiometry (total mass of 70.2 kDa). Thus, the two calculations are in agreement and indicate that the Fab stabilizes the monomeric state of Nter-BsRNaseY, as a result of steric hindrance or because it competes with the dimerization interface of Nter-BsRNaseY. In fact, the dissociation of the Nter-BsRNaseY dimer upon Fab binding results from the higher affinity of the Nter-BsRNaseY monomer for IgG RY79-90 (nM) than for himself (µM).
Overview of the Fab RY79-90 structure
Co-crystallization trials of Fab RY79-90 with Nter-BsRNaseY remained unsuccessful. Yet, the crystal structure of Fab RY79-90 in complex with the inducing peptide was solved at 2.6 Å resolution by molecular replacement using Fab 13F6-1-2 as model (Table S1). It contains two molecules in the asymmetric unit (Figure S5A). The Fab displays a large elbow angle of 138.5° and 133.1° between the Fv fragment and the CL/CH dimer, for molecules LH and AB, respectively, in agreement with the light chain belonging to the l-class (56). The peptide-binding pocket of Fab RY79-90 is a shallow cleft, roughly 50 Å by 44 Å wide and 16 Å deep, at the upper part of the VL/VH interface (Figure S5B and Figure 4A). The peptide exhibits a standard type 1 b-turn implicating an intramolecular hydrogen bond between the Asn4 O and Gln7 N atoms (Figure 4B), and thus adopts a U-shape extended conformation. The Fab surface area buried upon peptide binding is 50.1 and 69.3 Å2 for molecules LH and AB, respectively. All CDRs except L2 contribute to the combining site (Figure 4A).
Antibody-peptide interactions
9 out of the 12 residues of the peptide are in contact with the antibody and display clear electron density, whereas electron density was ill-defined for Arg3, Gln9 and Arg12 that were oriented towards the solvent (Figure 4C). The high specificity and binding affinity of the antibody/peptide interaction is achieved through numerous side-chain interactions. Interestingly, despite its very short length, CDRH3 is involved in several main interactions with the peptide, including a bidentate ionic interaction between ArgH94 (CDRH3) and Glu5. Two additional ionic interactions occur between the side chains of AspH52 (CDRH2) and Arg2, and GluL34 (CDRL1) and Lys8. Hydrogen bonds are formed between the side chains of ThrH96 (CDRH3) and Glu5, AsnH35 (CDRH1) and Asn4, ThrL93 (CDRL3) and Gln7, ThrL32 (CDRL1) and Glu10. There are additional hydrogen bonds between the side chain of Asn11 and the main chains oxygen atoms of GlyL91 (CDRL3) and oxygen and nitrogen atoms of ThrL32 (CDRL1). Interestingly, the only hydrophobic residue of the peptide, Leu6, is completely buried at the bottom of the combining site. Its side chain is stacked between GlyH95 (CDRH3) and TyrL96 (CDRL3). Other peptide side chains are involved in stacking interactions: Arg2 with TyrH53 of CDRH2, Glu5 with TyrH32 (CDRH1) and Asn11 with TyrL31 (CDRL1). A contact between the two molecules in the asymmetric unit is formed by an ionic interaction involving the side chains of GluC1 and ArgD3 from the two different peptides.
Comparison of Fab RY79-90 to Fab 13F6-1-2 and Fv MW1
Considering the rarity of Vlx usage, it is interesting to know whether the other monoclonal antibodies having Vlx light chains share similar antigen specificity. In addition to the structure of Fab reported in this study, two other crystal structures of antibodies Fab or Fv fragments bearing a Vlx light chain have been determined, also in complex with a peptide. The structure
of Fab 13F6-1-2, an antibody specific for Ebola viral surface glycoprotein GP was solved in complex with the 11-residue peptide VEQHHRRTDND (25). Its CDRH3 loop is very long compared to Fab RY79-90, which explains that its peptide binds more on the surface of the combining site compared to the peptide of Fab RY79-90, which is much more buried (Figure 5A). Antibody MW1 was directed against a poly-glutamine sequence relevant for Huntington’s disease. The structure of Fv MW1 solved in complex with the GQ10G peptide, shows that the
latter adopts an extended coil-like structure and is also less buried in the antibody combining site than the BsRNaseY peptide (46) (Figure 5B).
CONCLUSION
Areas of residual structure in unfolded proteins can be critical to forming the initial site of interaction with a binding partner (57), and delineation of those sites is required for the design of drugs and antibodies that interfere with binding. Moreover, several monoclonal antibodies combining sites have been shown to act as stable molds of in vivo conformation of important segments of intrinsically disordered proteins (58). Here, we used an antibody directed against a peptide of the IDD of BsRNaseY as a tool to question whether this region could become ordered upon binding a cellular partner. The peptide used to generate RY79-90 lies in a conserved, mostly positively charged region of Nter-BsRNaseY that could be a binding site for RNA or protein partners contributing to the degradosome complex (Figure 1). Similar to E. coli RNase E (59, 60), only microdomains of the intrinsically unstructured region of RNase Y are thought to interact with protein partners to form the B. subtilis degradosome complex (61, 62). If the conserved peptide used to induce RY79-90 belongs to such microdomain, the peptide/Fab RY79-90 interaction could mimic the interaction between the microdomain and a cellular protein partner.
Our studies revealed that the fold adopted by the epitope of the intrinsically disordered region upon binding RY79-90 is a U-shaped extended conformation. Leu6, the unique hydrophobic residue of the peptide, is sandwiched between CDRL3 and CDRH3 at the bottom of the combining site, along with the formation of a b-turn due to hydrogen bonds between Asn4 and Gln7. Interestingly, such a b-turn structure has previously been observed in the complex of a peptide from the intrinsically disordered Tat protein with an Fab fragment, with the burying of a tryptophan residue central to the epitope (63). In fact, intrinsically disordered proteins have generally the propensity to expose their few hydrophobic residues, probably to favor interactions with their biological partner.
The concept of conformation specific antibodies that recognize a compact fold of the antigen requires rigidity of the antibody-combining site. We did not solve the structure of Fab RY-79-90 alone but, as its CDRH3 loop is extremely short, it is probable that no large conformational changes of the antibody would occur upon peptide binding as these are usually caused by the inherent high flexibility of CDRH3 (64). In addition, the fact that Fab RY79-90 favors dissociation of the Nter-BsRNaseY dimer suggests that Fab interacts with the same binding region in the N-terminal domain of the BsRNaseY monomer that would also interact in vivo with cellular partners. This is also likely because a large region of Nter-BsRNaseY appears to be organized as a coiled-coil, a structural element often involved in oligomerization and protein interaction (65). The dissociation of the BsRNaseY dimer upon binding the degradosome partners would likely expose the inducing peptide for interaction. Therefore, Fab RY79-90 likely acts as a molecular imprint of a specific structural state of Nter-BsRNaseY and the Fab RY79-90/peptide complex might mimic the interaction of a microdomain of the N-terminal domain of BsRNaseY with one of its cellular partners within the degradosome complex. In future studies, Fab RY79-90 could be used as a tool to induce a specific fold to disordered Nter-BsRNaseY.
Author contributions
BGP conceived and coordinated the study and wrote the major part of the paper. PH performed all biochemical and crystallization assays. SL performed the gene cloning for BsRNaseY production. SL and HP selected the antibody. BGP solved and refined the X-ray structure. CV performed and analyzed the SEC-MALS experiments, CV and NA performed and analyzed the CD experiments, CBN collected the SAXS curves and CBN and DD analyzed the data. All authors designed the experiments, reviewed the results and participated to the final version of the manuscript.
Acknowledgements.
This work was supported by ANR (ANR-11-BSV8-026) and the French State Program ‘Investissements d’Avenir’ (Grants “LABEX DYNAMO”, ANR-11-LABX-0011), and has benefited from the facilities and expertise of the Macromolecular Interaction Platform of I2BC. We thank SOLEIL for provision of synchrotron radiation facilities, Luc Pardanaud for help in hybridoma cell culture, Pierre Legrand for assistance in using beamline PROXIMA 1 (proposal 20150780 for Proxima beamlines), Agnès Thomas-Collignon for the cloning of the Nter-BsRNaseY construct.
PDB accession numbers
Coordinates and structure factors have been deposited in the Protein Data Bank under accession code 6F7T.
Supporting Citation
REFERENCES
1. Laalami, S., L. Zig, and H. Putzer. 2014. Initiation of mRNA decay in bacteria. Cell Mol Life Sci 71:1799-1828.
2. Hui, M. P., P. L. Foley, and J. G. Belasco. 2014. Messenger RNA degradation in bacterial cells. Annu Rev Genet 48:537-559. 3. Mohanty, B. K., and S. R. Kushner. 2016. Regulation of mRNA Decay in Bacteria. Annu Rev Microbiol 70:25-44. 4. Mackie, G. A. 2013. RNase E: at the interface of bacterial RNA processing and decay. Nat Rev Microbiol 11:45-57. 5. Bechhofer, D. H. 2011. Bacillus subtilis mRNA decay: new parts in the toolkit. Wiley Interdiscip Rev RNA 2:387-394. 6. Lehnik-Habrink, M., R. J. Lewis, U. Mader, and J. Stulke. 2012. RNA degradation in
Bacillus subtilis: an interplay of essential endo- and exoribonucleases. Mol
Microbiol 84:1005-1017.
7. Durand, S., A. Tomasini, F. Braun, C. Condon, and P. Romby. 2015. sRNA and mRNA turnover in Gram-positive bacteria. FEMS Microbiol Rev 39:316-330.
8. Shahbabian, K., A. Jamalli, L. Zig, and H. Putzer. 2009. RNase Y, a novel endoribonuclease, initiates riboswitch turnover in Bacillus subtilis. EMBO J 28:3523-3533.
9. Figaro, S., S. Durand, L. Gilet, N. Cayet, M. Sachse, and C. Condon. 2013. Bacillus
subtilis mutants with knockouts of the genes encoding ribonucleases RNase Y and
RNase J1 are viable, with major defects in cell morphology, sporulation, and competence. J Bacteriol 195:2340-2348. 10. Yao, S., and D. H. Bechhofer. 2010. Initiation of decay of Bacillus subtilis rpsO mRNA by endoribonuclease RNase Y. J Bacteriol 192:3279-3286. 11. Bruscella, P., K. Shahbabian, S. Laalami, and H. Putzer. 2011. RNase Y is responsible for uncoupling the expression of translation factor IF3 from that of the ribosomal proteins L35 and L20 in Bacillus subtilis. Mol Microbiol 81:1526-1541.
12. Lehnik-Habrink, M., J. Newman, F. M. Rothe, A. S. Solovyova, C. Rodrigues, C. Herzberg, F. M. Commichau, R. J. Lewis, and J. Stulke. 2011. RNase Y in Bacillus subtilis: a Natively disordered protein that is the functional equivalent of RNase E from Escherichia coli. J Bacteriol 193:5431-5441. 13. Durand, S., L. Gilet, P. Bessieres, P. Nicolas, and C. Condon. 2012. Three essential ribonucleases-RNase Y, J1, and III-control the abundance of a majority of Bacillus subtilis mRNAs. PLoS Genet 8:e1002520. 14. Laalami, S., P. Bessieres, A. Rocca, L. Zig, P. Nicolas, and H. Putzer. 2013. Bacillus subtilis RNase Y activity in vivo analysed by tiling microarrays. PLoS One 8:e54062. 15. Grishin, N. V. 2001. KH domain: one motif, two folds. Nucleic Acids Res 29:638-643. 16. Aravind, L., and E. V. Koonin. 1998. The HD domain defines a new superfamily of metal-dependent phosphohydrolases. Trends Biochem Sci 23:469-472. 17. Dosztanyi, Z., V. Csizmok, P. Tompa, and I. Simon. 2005. IUPred: web server for the prediction of intrinsically unstructured regions of proteins based on estimated energy content. Bioinformatics 21:3433-3434.
18. Tompa, P. 2012. On the supertertiary structure of proteins. Nat Chem Biol 8:597-600.
19. Liu, Z., and Y. Huang. 2014. Advantages of proteins being disordered. Protein Sci 23:539-550.
20. Varadi, M., W. Vranken, M. Guharoy, and P. Tompa. 2015. Computational approaches for inferring the functions of intrinsically disordered proteins. Front Mol Biosci 2. 21. Basu, S., and R. P. Bahadur. 2016. A structural perspective of RNA recognition by intrinsically disordered proteins. Cell Mol Life Sci 73:4075-4084. 22. van der Lee, R., M. Buljan, B. Lang, R. J. Weatheritt, G. W. Daughdrill, A. K. Dunker, M. Fuxreiter, J. Gough, J. Gsponer, D. T. Jones, P. M. Kim, R. W. Kriwacki, C. J. Oldfield, R. V. Pappu, P. Tompa, V. N. Uversky, P. E. Wright, and M. M. Babu. 2014. Classification of intrinsically disordered regions and proteins. Chem Rev 114:6589-6631.
23. Jamalli, A., A. Hebert, L. Zig, and H. Putzer. 2014. Control of expression of the RNases J1 and J2 in Bacillus subtilis. J Bacteriol 196:318-324. 24. Putzer, H., A. A. Brackhage, and M. Grunberg-Manago. 1990. Independent genes for two threonyl-tRNA synthetases in Bacillus subtilis. J. Bacteriol. 172:4593-4602. 25. Lee, J. E., A. Kuehne, D. M. Abelson, M. L. Fusco, M. K. Hart, and E. O. Saphire. 2008. Complex of a protective antibody with its Ebola virus GP peptide epitope: unusual features of a V lambda x light chain. J Mol Biol 375:202-216.
26. Li, M. Z., and S. J. Elledge. 2012. SLIC: a method for sequence- and ligation-independent cloning. Methods Mol Biol 852:51-59.
27. Friguet, B., A. F. Chaffotte, L. Djavadi-Ohaniance, and M. E. Goldberg. 1985. Measurements of the true affinity constant in solution of antigen-antibody complexes by enzyme-linked immunosorbent assay. J Immunol Methods 77:305-319.
28. Proença, D., C. Velours, C. Leandro, M. Garcia, M. Pimentel, and C. Sao-Jose. 2015. A two-component, multimeric endolysin encoded by a single gene. Mol Microbiol 95:739-753.
29. Loiseau, L., C. Fyfe, L. Aussel, M. Hajj Chehade, S. B. Hernandez, B. Faivre, D. Hamdane, C. Mellot-Draznieks, B. Rascalou, L. Pelosi, C. Velours, D. Cornu, M. Lombard, J. Casadesus, F. Pierrel, M. Fontecave, and F. Barras. 2017. The UbiK protein is an accessory factor necessary for bacterial ubiquinone (UQ) biosynthesis and forms a complex with the UQ biogenesis factor UbiJ. J Biol Chem 292:11937-11950.
30. Sreerama, N., and R. W. Woody. 2000. Estimation of protein secondary structure from circular dichroism spectra: comparison of CONTIN, SELCON, and CDSSTR methods with an expanded reference set. Anal Biochem 287:252-260.
31. Whitmore, L., and B. A. Wallace. 2004. DICHROWEB, an online server for protein secondary structure analyses from circular dichroism spectroscopic data. Nucleic Acids Res 32:W668-673.
32. David, G., and J. Pérez. 2009. Combined sampler robot and high-performance liquid chromatography: a fully automated system for biological small-angle X-ray scattering experiments at the Synchrotron SOLEIL SWING beamline. J Appl Cryst 42:892-900.
33. Brookes, E., P. Vachette, M. Rocco, and J. Perez. 2016. US-SOMO HPLC-SAXS module: dealing with capillary fouling and extraction of pure component patterns from poorly resolved SEC-SAXS data. J Appl Crystallogr 49:1827-1841.
34. Rambo, R. P., and J. A. Tainer. 2013. Accurate assessment of mass, models and resolution by small-angle scattering. Nature 496:477-481.
35. Franke, D., C. M. Jeffries, and D. I. Svergun. 2015. Correlation Map, a goodness-of-fit test for one-dimensional X-ray scattering spectra. Nat Methods 12:419-422. 36. Svergun, D. I. 1992. Determination of the regularization parameter in
indirect-transform methods using perceptual criteria J Appl Cryst 25:495-503.
37. Evrard, G., F. Mareuil, F. Bontems, C. Sizun, and J. Perez. 2011. DADIMODO: a program for refining the structure of multidomain proteins and complexes against small-angle scattering data and NMR-derived restraints. J. Appl. Cryst. 44:1264-1271. 38. Mareuil, F., C. Sizun, J. Perez, M. Schoenauer, J. Y. Lallemand, and F. Bontems. 2007. A simple genetic algorithm for the optimization of multidomain protein homology models driven by NMR residual dipolar coupling and small angle X-ray scattering data. Eur Biophys J 37:95-104. 39. Tria, G., H. D. Mertens, M. Kachala, and D. I. Svergun. 2015. Advanced ensemble modelling of flexible macromolecules using X-ray solution scattering. IUCrJ 2:207-217. 40. Kabsch, W. 2010. Xds. Acta Crystallogr D Biol Crystallogr 66:125-132. 41. Mccoy, A. J., R. W. Grosse-Kunstleve, P. D. Adams, M. D. Winn, L. C. Storoni, and R. J. Read. 2007. Phaser crystallographic software. Journal of Applied Crystallography 40:658-674.
42. Emsley, P., B. Lohkamp, W. G. Scott, and K. Cowtan. 2010. Features and development of Coot. Acta Crystallogr D Biol Crystallogr 66:486-501. 43. Bricogne, G., E. Blanc, M. Brandl, C. Flensburg, P. Keller, W. Paciorek, P. Roversi, A. Sharff, O. S. Smart, C. Vonrhein, and T. O. Womack. 2016. BUSTER version 2.10.2. Cambridge, United Kingdom: Global Phasing Ltd. 44. Sanchez, P., P. N. Marche, D. Rueff-Juy, and P. A. Cazenave. 1990. Mouse V lambda x gene sequence generates no junctional diversity and is conserved in mammalian species. J Immunol 144:2816-2820. 45. Maier, C. C., F. S. Galin, M. A. Jarpe, P. Jackson, N. R. Krishna, A. M. Gautam, S. R. Zhou, J. N. Whitaker, and J. E. Blalock. 1994. A V lambda x-bearing monoclonal antibody with similar specificity and sequence to encephalitogenic T cell receptors. J Immunol 153:1132-1140.
46. Li, P., K. E. Huey-Tubman, T. Gao, X. Li, A. P. West, Jr., M. J. Bennett, and P. J. Bjorkman. 2007. The structure of a polyQ-anti-polyQ complex reveals binding according to a linear lattice model. Nat Struct Mol Biol 14:381-387.
47. Galin, F. S., C. C. Maier, S. R. Zhou, J. N. Whitaker, and J. E. Blalock. 1996. Murine V lambda x and V lambda x-containing antibodies bind human myelin basic protein. J Clin Invest 97:486-492.
48. Folta-Stogniew, E. 2006. Oligomeric states of proteins determined by size-exclusion chromatography coupled with light scattering, absorbance, and refractive index detectors. Methods Mol Biol 328:97-112. 49. Sahin, E., and C. J. Roberts. 2012. Size-exclusion chromatography with multi-angle light scattering for elucidating protein aggregation mechanisms. Methods Mol Biol 899:403-423. 50. Trathnigg, B. 1995. Determination of MWD and chemical composition of polymers by chromatographic techniques. . Prog. Polym. Sci 20:615–650. 51. Benfield, C. T., D. S. Mansur, L. E. McCoy, B. J. Ferguson, M. W. Bahar, A. P. Oldring, J. M. Grimes, D. I. Stuart, S. C. Graham, and G. L. Smith. 2011. Mapping the IkappaB kinase beta (IKKbeta)-binding interface of the B14 protein, a vaccinia virus
inhibitor of IKKbeta-mediated activation of nuclear factor kappaB. J Biol Chem 286:20727-20735.
52. Mouilleron, S., M. A. Badet-Denisot, L. Pecqueur, K. Madiona, N. Assrir, B. Badet, and B. Golinelli-Pimpaneau. 2012. Structural basis for morpheein-type allosteric regulation of Escherichia coli glucosamine-6-phosphate synthase: equilibrium between inactive hexamer and active dimer. J Biol Chem 287:34533-34546. 53. Carter, L., S. J. Kim, D. Schneidman-Duhovny, J. Stohr, G. Poncet-Montange, T. M.
Weiss, H. Tsuruta, S. B. Prusiner, and A. Sali. 2015. Prion Protein-Antibody Complexes Characterized by Chromatography-Coupled Small-Angle X-Ray Scattering. Biophys J 109:793-805.
54. Jeffries, C. M., M. A. Graewert, C. E. Blanchet, D. B. Langley, A. E. Whitten, and D. I. Svergun. 2016. Preparing monodisperse macromolecular samples for successful biological small-angle X-ray and neutron-scattering experiments. Nat Protoc 11:2122-2153.
55. Boze, H., T. Marlin, D. Durand, J. Perez, A. Vernhet, F. Canon, P. Sarni-Manchado, V. Cheynier, and B. Cabane. 2010. Proline-rich salivary proteins have extended conformations. Biophys J 99:656-665.
56. Stanfield, R. L., A. Zemla, I. A. Wilson, and B. Rupp. 2006. Antibody elbow angles are influenced by their light chain class. J Mol Biol 357:1566-1574.
57. Uversky, V. N. 2002. Natively unfolded proteins: a point where biology waits for physics. Protein Sci 11:739-756.
58. Skrabana, R., R. Dvorsky, J. Sevcik, and M. Novak. 2010. Monoclonal antibody MN423 as a stable mold facilitates structure determination of disordered tau protein. J Struct Biol 171:74-81.
59. Callaghan, A. J., J. P. Aurikko, L. L. Ilag, J. Gunter Grossmann, V. Chandran, K. Kuhnel, L. Poljak, A. J. Carpousis, C. V. Robinson, M. F. Symmons, and B. F. Luisi. 2004. Studies of the RNA degradosome-organizing domain of the Escherichia coli ribonuclease RNase E. J Mol Biol 340:965-979. 60. Marcaida, M. J., M. A. DePristo, V. Chandran, A. J. Carpousis, and B. F. Luisi. 2006. The RNA degradosome: life in the fast lane of adaptive molecular evolution. Trends Biochem Sci 31:359-365. 61. Cascante-Estepa, N., K. Gunka, and J. Stulke. 2016. Localization of Components of the RNA-Degrading Machine in Bacillus subtilis. Front Microbiol 7:1492. 62. Cho, K. H. 2017. The Structure and Function of the Gram-Positive Bacterial RNA Degradosome. Front Microbiol 8:154. 63. Serrière, J., J. M. Dugua, M. Bossus, B. Verrier, R. Haser, P. Gouet, and C. Guillon. 2011. Fab'-induced folding of antigenic N-terminal peptides from intrinsically disordered HIV-1 Tat revealed by X-ray crystallography. J Mol Biol 405:33-42. 64. Sela-Culang, I., S. Alon, and Y. Ofran. 2012. A systematic comparison of free and
bound antibodies reveals binding-related conformational changes. J Immunol 189:4890-4899.
65. Woolfson, D. N. 2017. Coiled-Coil Design: Updated and Upgraded. Subcell Biochem 82:35-61.
66. Sievers, F., A. Wilm, D. Dineen, T. J. Gibson, K. Karplus, W. Li, R. Lopez, H. McWilliam, M. Remmert, J. Soding, J. D. Thompson, and D. G. Higgins. 2011. Fast, scalable generation of high-quality protein multiple sequence alignments using Clustal Omega. Mol Syst Biol 7:539.
67. Gouet, P., E. Courcelle, D. I. Stuart, and F. Metoz. 1999. ESPript: analysis of multiple sequence alignments in PostScript. Bioinformatics 15:305-308.
68. Svergun, D. I., C. Barberato, and M. H. J. Koch. 1995. CRYSOL - a Program to Evaluate X-ray Solution Scattering of Biological Macromolecules from Atomic Coordinates. J. Appl. Cryst. 28:768-773.
69. Gaboriaud, C., V. Bissery, T. Benchetrit, and J. P. Mornon. 1987. Hydrophobic Cluster Analysis: an efficient new way to compare and analyse amino acid sequences. FEBS Lett. 224:149-155.
Figure legends
Figure 1: Characterization of a monoclonal antibody induced against a 12-residue peptide of Nter-BsRNaseY. A Sequence alignment of the N-terminal domains of RNases Y from B.
subtilis, Staphylococcus aureus, Streptococcus pyogenes, Listeria monocytogenes, Clostridium perfringens, Lactoccus lactis, Borrelia burgdorferi, Leadbetterella byssophila was performed
with Clustal Omega (66) and rendered with ESPript (67). The predicted N-terminal transmembrane helix (TM, residues 6-24) and the inducing peptide (residues 79-90) are indicated. B Recognition of BsRNaseY by IgG RY79-90 as detected by immunoblotting of proteins separated on a 10% SDS-PAGE gel using 2 µg/ml IgG RY79-90 1 : 10 µg crude extract of B. subtilis wild-type cells; 2-4 : BsRNaseY purified by Ni-NTA chromatography :10 ng (2), 100 ng (3) and 1µg (4). C In vitro formation of the BsRNaseY/Fab RY79-90 complex. BsRNaseY was incubated with Fab RY79-90 at different ratios and loaded on a 4% native gel for gel shift assay. 1 : Fab alone (2 µg); 2 : BsRNaseY alone (2 µg) 3 : BsRNaseY (5 µM) was mixed with 0.1 (3), 0.5 (4), 1 (5), 1.5 (6), 2 (7), 2.5 (8), 3 (9), 3.5 (10), 4 (11), 4.5 (12) and 5 µM (13) Fab RY79-90.
Figure 2: SEC-MALS analysis of Nter-BsRNaseY and the Nter-BsRNaseY/Fab RY79-90 complex. A Determination of the dissociation constant of the Nter-BsRNaseY homodimer.
Nter-BsRNaseY was loaded at various concentrations (30 to 945 µM) onto a Superdex 200 10/300GL increase column equilibrated with 40 mM MES buffer pH 6.8, 200 mM NaCl. Plot of the relative refraction index (full lines) and weighted-average molar mass (dotted lines) as function of elution volume. Insert: Weighted-average molar mass plotted as a function of the concentration of the protein eluted from the column, as determined by the refractometer in real time. B Determination of the stoichiometry of the Nter-BsRNaseY/Fab RY79-90 complex. The SEC-MALS elution profiles of Fab RY79-90, Nter-BsRNaseY, and their mixture on a Superdex
200 10/300 GL increase column, loaded at 1.4 mg/ml, 1 mg/ml and 1.6 mg/ml, respectively, are shown as black, blue and red full lines, respectively. The Fab sample shows additional contaminants of mass of 53.3± 0.3 kDa corresponding to the Fc fragment and 148.1± 0.3 kDa corresponding to the IgG. Dotted lines indicate the molar mass.
Figure 3: Nter-BsRNaseY structure. A Circular Dichroism Spectrum of Nter-BsRNaseY.
The CD Spectrum of Nter-BsRNaseY (485 µM) was recorded in 40 mM MES pH 6.2, 200 mM NaCl, 10% D2O as function of wavelength. Experimental data (black line) display two minima
at 208 and 222 nm characteristic of a secondary structure with a high a-helical content. Data fitting with the CDSSTR method using reference data set 3 (shown as crosses) indicates a content of 64% helices and 22% disordered regions. The difference between the experimental and theoretical curves is indicated by the red histogram. B SEC-SAXS curves of Nter-BsRNaseY. Evolution of the gyration radius Rg during SEC-SAXS elution (blue line), together with the molar mass (red dots) and the forward scattered intensity I(0) (black line). The horizontal red dashed line corresponds to the theoretical molar mass of the Nter-BsRNaseY monomer. C Structural models of BsRNaseY. Top: Two atomic models of Nter-BsRNaseY (pink and green) were obtained using SWISS-MODEL and DADIMODO, as described in the Materials and Methods section. Bottom: The SEC-SAXS curves of the models (pink and green) were adjusted to the experimental SEC-SAXS data (black dots) using CRYSOL (68).
Figure 4: Recognition of the inducing peptide by Fab RY79-90.
A Location of the peptide at the VL/VH interface in the active site of Fab RY79-90. The ligand
is in yellow and CDRL1, CDRL2, CDRL3, CDRH1, CDRH2, and CDRH3 are colored violet-purple, pink, magenta, orange, red and brown, respectively. B Details of the interactions
between Fab RY79-90 and the inducing peptide. The residues that directly interact with the peptide are represented as sticks and colored according to the CDR. H-bonding interactions are indicated as dashes. C Stereoview of Fo-Fc electron density map, calculated by omitting the peptides and a 1.8-Å spherical region around them, is contoured at the level of 2.0 s and superimposed on the active-site structure.
Figure 5: Comparison of structures of antibodies with vlx light chain in complex with
peptide. A Superposition of the complexes of Fab RY79-90 and Fab 13F6-1-2 with their
respective peptides. The colors for Fab RY79-90 are as in Figure 4 and the CDR loops of Fab 13F6-1-2 are in grey, with the peptide shown as an orange cartoon. B Superposition of the complexes of Fab RY79-90 and Fv MW1 (PDB code 2OTU) with their respective peptides. The colors for Fab RY79-90 are as in Figure 4 and the CDR loops of Fv MW1 are in grey, with the peptide shown as an orange cartoon.
Figure 5
A
Supplementary Methods
Determination of the dissociation constants for the IgG/BsRNaseY, IgG/Nter-BsRNaseY, and IgG/peptide complexes
The antibody at constant concentration is first incubated in solution with the antigen at various concentrations until the equilibrium is reached. Then, the amount of unbound antibody is measured by a classical indirect ELISA test (1).
The following protocol was used to establish calibration curves and ensure that the antibody concentration used is in the linear range of the ELISA response and that only a small fraction (≤ 10%) of the total free antibody in solution is retained on the plate. Two 96-well plates were coated in triplicate with 0.5-4 nM BsRNaseY, 5-40 nM Nter-BsRNaseY or 2-16 nM peptide in PBS buffer pH 7.4 and incubated overnight at 4°C. Then, the plates were saturated with 250 µL of 3% BSA, 3% Milk in PBS pH 7.4, 0.05% Tween 20 at 37°C for three hours. After three washes with 20 mM HEPES pH 7.5, 150 mM NaCl, 10% glycerol, 0.05% Tween 20, antibody at various concentrations (0.5 to 64 nM) was dispensed into the wells of the first plate. After 10 min (Nter-BsRNaseY and peptide) or 30 min (BsRNaseY) incubation at 25°C, each well content was transferred to the second plate and incubated in the same conditions. The wells were then washed three times and 100 µL of peroxidase-labeled anti-mouse IgG antibody (Sigma Aldrich®) at a dilution of 1:4000 in 20 mM Hepes pH 7.5, 150 mM NaCl, 10% glycerol and 10 mg/mL BSA was added to each well. After 1 hour incubation at 25°C, plates were washed five times and 100 µL of tetramethylbenzidine (Sigma Aldrich®) was added to each well. After incubation for 10 min in the dark, the reaction was stopped by addition of 1 M sulfuric acid. Absorbance at 450 nm, which should be proportional to the concentration of free antibody, was measured.
Second, the concentration of free antibody in a series of solutions preincubated with various concentrations of the different antigens was determined in triplicate. The binding equilibria
were carried out in 20 mM Hepes 7.5, 150 mM NaCl, 10% glycerol, 10 mg/mL BSA overnight at 25°C with the antibody at a fixed concentration (7.6 nM, 1.5 nM and 3.8 nM for the complexes with BsRNaseY, Nter-BsRNaseY or the peptide, respectively), and 31.25, 62.5, 125, 250, 500, 1000 nM BsRNaseY, 3.125, 6.25, 12.5, 25, 50 et 100 nM Nter-BsRNaseY or 0.031, 0.063, 0.125, 0.250, 0.5, 1 nM peptide. Antibody–antigen mixtures were transferred into a 96-well plate previously coated overnight with 2 nM BsRNase Y, 40 nM Nter-BsRNaseY or 16 nM peptide in PBS buffer pH 7.4, saturated and washed as described above. After incubation at 25°C for 30 min for the antibody–BsRNaseY complex or 10 min for the antibody–Nter-BsRNaseY complex and antibody–peptide complexes, the concentration of free antibody was determined by the indirect ELISA test described above. The results were plotted using a Scatchard plot as described (1), the slope being equal to -1/Kd and the y-axis intercept point to
1/Kd.
Determination of the stoichiometry of the Nter-BsRNaseY/Fab RY79-90 complex by SEC-MALS
Protein stoichiometry analysis of the Nter-BsRNaseY/Fab RY79-90 complex was performed using two methods. The first method, based on the multi-signal detection system of SEC-MALS, uses the ‘UV extinction from RI peak’ method included in the ASTRA software and the dn/dc value to determine the experimental UV extinction coefficients (2). These values are then compared with the theoretical values predicted from the protein amino acid sequences. The extinction coefficient of Nter-BsRNaseY is negligible due to the rarity of aromatic amino acids in the sequence and that of Fab RY79-90 was predicted from the protein amino acid sequences using the ProtParam tool [http://web.expasy.org/protparam/] to be 1.601 ml.mg-1cm-1. The theoretical extinction coefficients for the Nter-BsRNaseY/Fab RY79-90 complex (12) at 3
different ratios (1:1, 2:1 and 1:1) were obtained using the following equation:
13 =
56× !%×1%+ 58×!8×18 5%×!%+ 58×!8
where nN and nF are the fractions of the two partners (Nter-BsRNaseY and Fab RY79-90,
respectively) in the complex and MN and MF their molar masses. As eN and eF are significantly
different, the protein conjugate method was also used to determine the molecular weights of Nter-BsRNaseY and Fab RY79-90 in the complex and confirm the stoichiometry (3).
Supplementary Figures
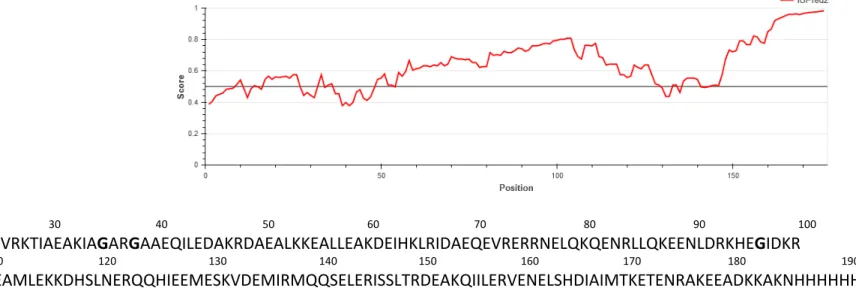
Figure S1: Secondary structure prediction of BsRNaseY. A Bioinformatics analysis of Nter-BsRNAseY. The amino acid sequence of Nter-BsRNAseY
(buttom) is shown with the disorder propensity, as calculated by IUPRED (top). B Hydrophobic Cluster Analysis plot of BsRNaseY. This method is based on the use of a bidimensional HCA plot, in which the protein sequence is written as an a-helix displayed on a cylinder with 3.6 residue per turn. The cylinder is cut along the horizontal axis, unrolled and repeated to recreate the full environment of each amino acid (4). Hydrophobic amino acids (colored green) gather into clusters (encircled), whose form is generally indicative of the type of secondary structure: vertical clusters are often associated to b-strands and horizontal ones to a-helices. Special symbols are used for proline (red star), threonine and serine (square and dotted square) and glycine (black diamond).
A 24 30 40 50 60 70 80 90 100 MVRKTIAEAKIAGARGAAEQILEDAKRDAEALKKEALLEAKDEIHKLRIDAEQEVRERRNELQKQENRLLQKEENLDRKHEGIDKR 110 120 130 140 150 160 170 180 190 EAMLEKKDHSLNERQQHIEEMESKVDEMIRMQQSELERISSLTRDEAKQIILERVENELSHDIAIMTKETENRAKEEADKKAKNHHHHHH B
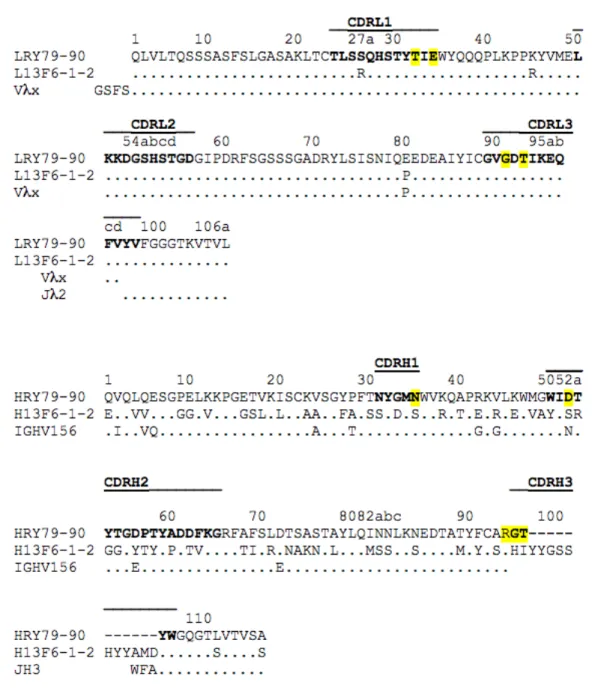
Figure S2: Amino acid sequences of the VL and VH domains of Fab79-90 and Fab13F6-1-2 and their likely corresponding germline genes. Dots denote sequence identity to Fab79-90. H denotes the heavy chain and L the light chain. Sequence numbering and CDR definitions (indicated in bold) follow Kabat nomenclature. The likely germline sequences are indicated below the sequence of the antibodies. Amino acids that are in close contact with the peptide are underlined in yellow. The nucleotide sequence of the Fab79-90 variable heavy chain has been deposited in the Genbank database (Genbank accession number MG571287).
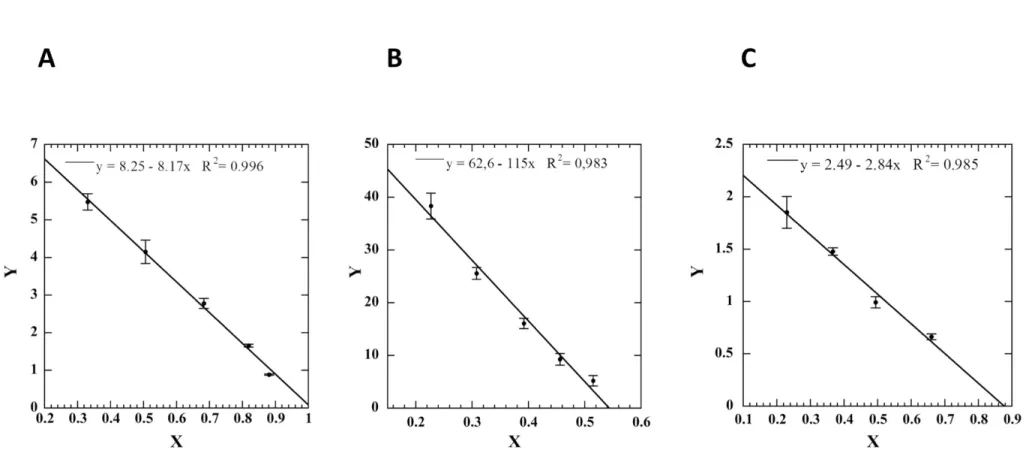
Figure S3: Determination of the dissociation constants (Kd) for the complexes of IgG RY79-90 with BsRNaseY (A), Nter-BsRNaseY (B) or the inducing peptide (C). The Scatchard plot representation (Y= 1/Kd (1 - X) was used to fit the data and determine the dissociation constant for each complex, with X = (A0
– A)/A0 and Y = ((A0-A)/A0)/[C – CAc*((A0-A)/A0)]. A0 is the measured absorbance for antibody alone, A is the absorbance measured for each mixture, C is the
Figure S4
A Dimensionless Kratky representations of Nter-BsRNAseY (red line), together with the SAXS curve (dashed grey line) of the deglycosylated salivary protein II-1ng, which is a fully unstructured protein about the same size (140 residues)(5).
B Distance distribution function P(r)/Pmax where Pmax is the maximum value of P(r), as a function of the
reduced coordinates r/Dmax where Dmax is the largest distance within each protein. Such a representation
makes the distance scale independent of protein size.
A
42 Figure S5: Overall view of the Fab RY79-90/peptide complex. A Overall view of the two Fab molecules in the asymmetric unit (colored pink and magenta) with the peptides drawn as green coils. B Overall view of the peptide in the combining site of Fab RY79-90. The molecular surfaces of the VL and VH chains are shown in cyan and green, respectively.
A
B
FabLH FabAB RNaseY peptide RNaseY peptide43
Supplementary Tables
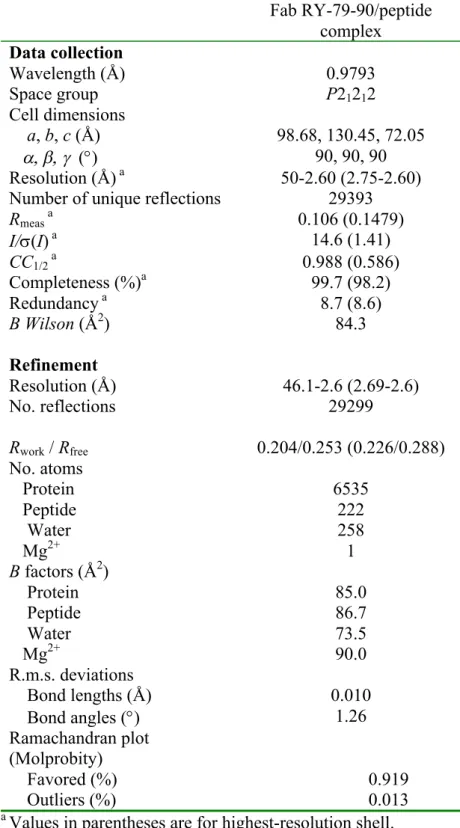
Table S1: Data collection and refinement statisticsa
Fab RY-79-90/peptide complex Data collection Wavelength (Å) 0.9793 Space group P21212 Cell dimensions a, b, c (Å) 98.68, 130.45, 72.05 a, b, g (°) 90, 90, 90 Resolution (Å) a 50-2.60 (2.75-2.60) Number of unique reflections 29393
Rmeas a 0.106 (0.1479) I/s(I) a 14.6 (1.41) CC1/2 a 0.988 (0.586) Completeness (%)a 99.7 (98.2) Redundancy a 8.7 (8.6) B Wilson (Å2) 84.3 Refinement Resolution (Å) 46.1-2.6 (2.69-2.6) No. reflections 29299 Rwork / Rfree 0.204/0.253 (0.226/0.288) No. atoms Protein 6535 Peptide 222 Water 258 Mg2+ 1 B factors (Å2) Protein 85.0 Peptide 86.7 Water 73.5 Mg2+ 90.0 R.m.s. deviations Bond lengths (Å) 0.010 Bond angles (°) 1.26 Ramachandran plot (Molprobity) Favored (%) 0.919 Outliers (%) 0.013
44
Table S2: Biophysical parameters of BsRNaseY, Fab RY79-90 and the Nter-BsRNaseY/Fab RY79-90 complex determined by SEC-MALS
Parameter Fab RY79-90 Nter-BsRNaseY* Nter-BsRNaseY/ Fab RY79-90 Molar mass (kDa) 46.0 ± 0.3 40.0 ± 1.1 69.7 ± 0.4
Rh (nm) 2.6 ± 0.3 4.7 ± 0.3
45
Supporting References
1. Friguet, B., A. F. Chaffotte, L. Djavadi-Ohaniance, and M. E. Goldberg. 1985. Measurements of the true affinity constant in solution of antigen-antibody complexes by enzyme-linked immunosorbent assay. J Immunol Methods 77:305-319.
2. Proença, D., C. Velours, C. Leandro, M. Garcia, M. Pimentel, and C. Sao-Jose. 2015. A two-component, multimeric endolysin encoded by a single gene. Mol Microbiol 95:739-753.
3. Loiseau, L., C. Fyfe, L. Aussel, M. Hajj Chehade, S. B. Hernandez, B. Faivre, D. Hamdane, C. Mellot-Draznieks, B. Rascalou, L. Pelosi, C. Velours, D. Cornu, M. Lombard, J. Casadesus, F. Pierrel, M. Fontecave, and F. Barras. 2017. The UbiK protein is an accessory factor necessary for bacterial ubiquinone (UQ) biosynthesis and forms a complex with the UQ biogenesis factor UbiJ. J Biol Chem 292:11937-11950.
4. Gaboriaud, C., V. Bissery, T. Benchetrit, and J. P. Mornon. 1987. Hydrophobic Cluster Analysis: an efficient new way to compare and analyse amino acid sequences. FEBS Lett. 224:149-155.
5. Boze, H., T. Marlin, D. Durand, J. Perez, A. Vernhet, F. Canon, P. Sarni-Manchado, V. Cheynier, and B. Cabane. 2010. Proline-rich salivary proteins have extended conformations. Biophys J 99:656-665.