HAL Id: hal-02155849
https://hal.inria.fr/hal-02155849
Submitted on 14 Jun 2019
HAL is a multi-disciplinary open access
archive for the deposit and dissemination of
sci-entific research documents, whether they are
pub-lished or not. The documents may come from
teaching and research institutions in France or
abroad, or from public or private research centers.
L’archive ouverte pluridisciplinaire HAL, est
destinée au dépôt et à la diffusion de documents
scientifiques de niveau recherche, publiés ou non,
émanant des établissements d’enseignement et de
recherche français ou étrangers, des laboratoires
publics ou privés.
Topological Data Analysis for Arrhythmia Detection
through Modular Neural Networks
Meryll Dindin, Yuhei Umeda, Frédéric Chazal
To cite this version:
Meryll Dindin, Yuhei Umeda, Frédéric Chazal. Topological Data Analysis for Arrhythmia
Detec-tion through Modular Neural Networks. CanadianAI 2020 - 33rd Canadian Conference on Artificial
Intelligence, May 2020, Ottawa, Canada. �hal-02155849�
Topological Data Analysis for Arrhythmia Detection
through Modular Neural Networks
Meryll Dindin
[1], Yuhei Umeda
[2], Frederic Chazal
[3][1][email protected][2][email protected][3][email protected]
Abstract
This paper presents an innovative and generic deep learning approach to monitor heart conditions from ECG signals.We focus our attention on both the de-tection and classification of abnormal heartbeats, known as arrhythmia. We strongly insist on gen-eralization throughout the construction of a deep-learning model that turns out to be effective for new unseen patient. The novelty of our approach relies on the use of topological data analysis as basis of our multichannel architecture, to diminish the bias due to individual differences. We show that our structure reaches the performances of the state-of-the-art methods regarding arrhythmia detection and classification.
1
Introduction
Countless artificial intelligence breakthroughs are observed in healthcare on a daily basis. They currently target improved monitoring of vital signs, better diagnostics and more reliable clinical decisions. Among the many on-going developments, heart monitoring is of particular importance as heart attack and strokes are among the five first causes of death in the US. Developing wearable medical devices would help to deal with a larger proportion of the population, and reduce the time used by cardiologists to make their diagnosis. This paper fo-cuses on both the detection and classification of arrhythmia, which is an umbrella term for group of conditions describing irregular heartbeats. Detection deals with spotting any abnor-mal heartbeat, while classification deals with giving the right label to the spotted abnormal heartbeats.
Among the several existing studies, some developed de-scriptive temporal features to feed SVM [Houssein et al., 2017] or neural networks [Shirin and Behbood, 2016], some-times mixed with optimization methods [Houssein et al., 2017; S.M. and E.S., 2013]. Others [Yochum et al., 2016] dealt with wavelet transforms and Daubechies wavelets. The general approach of those papers enables arrhythmia classi-fication through machine learning. However, most papers [Padmavathi and K.Sri, 2016; Jun et al., 2017; Jianning, 2018; Hassanien et al., 2018] reduce the classification to spe-cific arrhythmia, or limit it to a few classes only. On the other hand, [Rajpurkar et al., 2017] sought to improve multi-class
classification. But the more the classes, the faster the perfor-mances did vanish. To overcome this issue, [Jianning, 2018; Clifford et al., 2017] have introduced deep learning methods based on convolutional networks. Other teams focused on un-supervised learning, such as auto-encoders [Lu et al., 2018], with promising results. Nonetheless, the methods presented so far have low performance for unknown patient, mainly due to individual differences. Generalization, which means inde-pendence on individual differences, is a serious issue for any application in the healthcare sector.
The proposed approach consists in the analysis of ECG through a modular multi-channel neural network whose orig-inality is to include a new channel relying on the theory of topological data analysis, that is able to capture robust topo-logical patterns of the ECG signals. That information de-scribes best the geometry of each heartbeat, independently of the values of the signal or the individual heart rhythms. By combining topological data analysis, handcrafted features and deep-learning, we aimed for better generalization.
Our paper is organized as follows. After presenting Topological Data Analysis, we condensed our approach in the presentation of the datasets, our preprocessing and the general deep-learning architecture. We then develop our test-ing methodology, which is used to quantify generalization. The last sections provide comparisons with benchmarks and state-of-the-art results, and conclude with our experimental results. We introduce a new benchmark for arrhythmia clas-sification, underlining the strengths of topological data anal-ysis and auto-encoders to tackle the issue of individual differ-ences. Finally, remarks and thoughts are provided as conclu-sion at the end of the paper.
2
Topological Data Analysis
Among the main challenges faced for arrhythmia classifi-cation generalization, we find individual differences, and specifically bradycardia and tachycardia. We dealt with it by introducing Topological Data Analysis, and by merging the-ory with our deep-learning approach. Topological Data Anal-ysis (TDA) is a recent and fast growing field that provides mathematically well-founded methods [Chazal and Michel, 2017] to efficiently exhibit topological patterns in data and to encode them into quantitative and qualitative features. In our setting, TDA, and more precisely persistent homology theory [Edelsbrunner and Harer, 2010], powerfully characterizes the
shape of the ECG signals in a compact way, avoiding complex geometric feature engineering. Thanks to fundamental stabil-ity properties of persistent homology [Chazal et al., 2016], the TDA features appear to be very robust to the deformations of the patterns of interest in the ECG signal, especially expan-sion and contraction in the time axis direction. This makes them particularly useful to overcome individual differences and potential issues raised by bradycardia and tachycardia. Persistence Homology. To characterize the heartbeats, we consider the persistent homology of the so called sub-level (resp. upper-level) sets filtration of the considered time se-ries. Seeing the signal as a function f defined on an inter-val I and given a threshold inter-value α, we consider the con-nected components of Fα = {t ∈ I : f (t) ≤ α} (resp.
Fα= {t ∈ I : f (t) ≥ α}). As α increases (resp. decreases)
some components appear and some others get merged to-gether. Persistent homology keeps track of the evolution of these components and encodes it in a persistence barcode, i.e. a set of intervals - see Figure 2 for an example of barcode computation on a simple example. The starting point of each interval corresponds to a value α where a new component is created while the end point corresponds to the value α0where the created component gets merged into another one. In our practical setting, the function f is the piecewise linear inter-polation of the ECG time series and persistence barcodes can be efficiently computed in O(n log n) time, using, e.g., the GUDHI library [Maria et al., 2014], where n is the number of nodes of the time series.
t
y
α1 α2 α3 α4 α5 α6Figure 2: The persistence barcode of a 1D signal To clarify the construction of a persistence barcode, one may observe Figure 2 with the following notations: y = f (t): for α < α1, Fαis empty. A first component appears in Fα
as α reaches α1, resulting in the beginning of an interval.
Similarly when α reaches α2 and then α3, new components
appear in Fα giving birth to the starting point of new
inter-vals. When α reaches α4, the two components born at α1and
α3get merged, resulting in the “death” of the most recently
born component (persistence rule), i.e. the one that appeared at α3and creation of the interval [α3, α4] in the persistence
barcode. Similarly when α reaches α5 the interval [α2, α5]
is added to the barcode. The component appeared at α1
re-mains until the end of the sweeping-up process, resulting in the interval [α1, α6].
Betti Curves. As an unstructured set of intervals, the per-sistence barcodes are not suitable for direct integration in machine-learning models. To tackle this issue, we use a spe-cific representation of the barcode diagrams, the so-called Betti curves [Umeda, 2016]: for each α, the Betti curve value at α is defined as the number of intervals containing the value α. The Betti curves are computed and discretized on the inter-val delimited by the minimum and maximum of the birth and death values of each persistent diagram, both for the time-series and its opposite (in order to study the sub-levels and upper-levels of the signal). One may observe that a funda-mental property of Betti curves of 1D signal that follows from the definition of barcodes is their stability with respect to time re-parametrization and signal value rescaling, as stated in the following theorem. This allows us to build an uniform in-put for classical 1D convolutional deep-learning models, thus tacking the main issue of individual differences.
Theorem: Time Independence of Betti Curves Given a function f : I → R and a real number a > 0 the Betti curves of t → f (t) and t → f (at) are the same.
Moreover, if g(t) = bf (t) for some b > 0, then the Betti curves of f and g are related by BCg(α) = BCf(αb).
This theorem is a particular case of a more general state-ment resulting from classical properties of general persistence theory [Chazal et al., 2016]. Intuitively, the invariance to time rescaling follows from the observation that persistence inter-vals measure the relative height of the peaks of the signal and not their width. The value-rescaling of the signal by a factor b results in a stretching of the persistence intervals by the same factor resulting in the above relation between the Betti curves of the signal and its rescaled version.
3
Deep-Learning Approach
3.1
Datasets
To facilitate comparison to other existing methods, our ap-proach is experimented on a family of open-source data sets that have already been studied among the literature. Those are provided by the Physionet platform, and named after the diseases they describe: MIT-BIH Normal Sinus Rhythm Database [Goldberger et al., 2000], MIT-BIH Arrhythmia Database [Goldberger et al., 2000; Moody and Mark, 2001], MIT-BIH Supraventricular Arrhythmia Database [Gold-berger et al., 2000; Greenwald, 1990], MIT-BIH Malignant Ventricular Arrhythmia Database [Goldberger et al., 2000; Greenwald, 1986] and MIT-BIH Long Term Database [Gold-berger et al., 2000]. Those databases present single-channel ECGs, each sampled at 360 Hz with 11-bit resolution over a 10 mV range. Two or more cardiologists independently anno-tated each record, whose disagreements were resolved to ob-tain the reference annotations for each beat in the databases. Each heartbeat is annotated independently, making peak de-tection thus unnecessary.
Database # Patients # Labels Duration (Hours)
Arrhythmia 48 109494 24
LongTerm 7 668735 147
NormalSinus 18 1729629 437
SupraVentricular 78 182165 38
TWave 90 790565 180
Table 1: Physionet Datasets Description
3.2
Preprocessing
Every machine-learning comes with its data preprocessing. We first focused on the standardization of all the available ECG. Different methods have been applied in order to en-hance the signal, and reduce noise and bias. After resampling at 200 Hz, we removed the baselines [Blanco-Velasco et al., 2008] and applied filters, based on both a FIR filter and a Kalman filter. The signal is then rescaled between 0 and 1 before being translated to get a mean of the signal close to 0, for deep-learning stability.
Baseline Wander. The method dealing with the baseline drift [Blanco-Velasco et al., 2008] is based on the Daubechies wavelets theory. It consists in consecutive processes of de-composition and reconstruction of the signal thanks to con-volution windows. By removing the outlying components, we are able to identify and suppress the influence of the base-line in the signal, which generally corresponds to muscular and respiratory artifacts.
Filtering. The first applied filter to each ECG is a FIR (Fi-nite Impulse Response) filter. It performs particularly well on ECG, and wavelets-based signals in general. It behaves basi-cally as a band-filter. We chose 0.05 Hz and 50 Hz as cut frequencies to minimize the resulting distortion, according to our tests and the literature [Buend´ıa-Fuentes et al., 2012; Upganlawar and Chowhan, 2014; Goras and Fira, 2010]. Heartbeats Slicing. Once preprocessed, each ECG is seg-mented into partially overlapping elementary sequences made of a fix number of consecutive heartbeats. Each sequence is extracted according to the previous and next heartbeat. This extraction being patient-dependent, it reduces the influence of diverging heartbeat rhythms, e.g bradycardia and tachycardia. This extraction can be done for as many consecutive heart-beats as wanted. The labels are attributed by the central peak (whose index is the integer value of half the number of peaks). Once the windows are defined, we use interpolation to stan-dardize the vectors, making them suitable for deep-learning purposes.
Feature Engineering. Once those heartbeats are extracted, we build relative features. Literature [Awais et al., 2017; Pyakillya et al., 2017; Blanco-Velasco et al., 2008; Luz et al., 2016] screening brought us to the discrete Fourier trans-form of each window, the linear relationships between each temporal components (P, Q, R, S, T), and the statistical val-ues given by the extrema, mean, standard deviation, kurtosis, skewness, entropy, crossing-overs and PCA reduction to 10 components.
3.3
Auto-Encoder
Table 1 gives a good overview of other issues we faced, such as an uneven distribution of labels and extreme minority classes. Furthermore, a challenging imbalance between nor-mal and abnornor-mal samples is noticeable, as it would be for any anomaly problem.
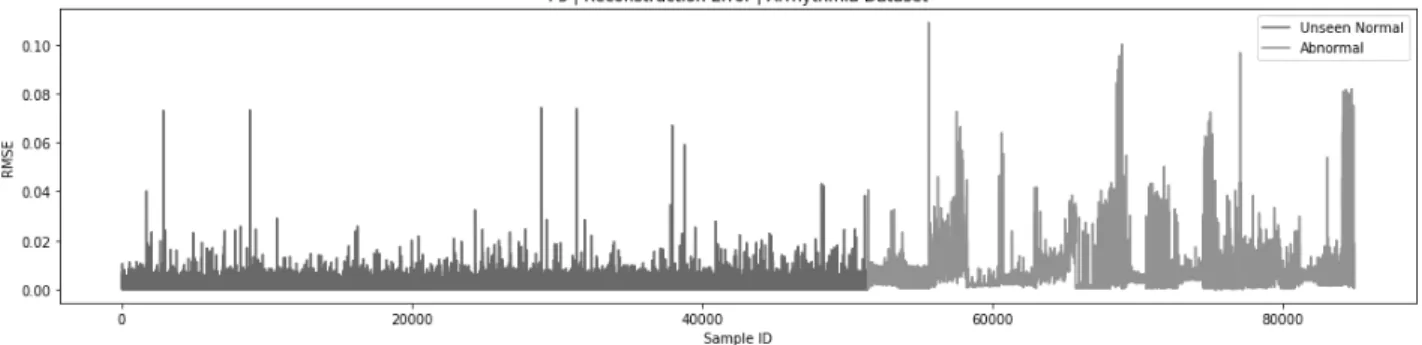
We decided to take advantage of the large amount of normal samples compared to abnormal samples, through un-supervised learning with auto-encoders [Baldi, 2012]. The structure is made of six fully-connected hidden layers, de-veloped in a symmetric fashion, with an input dimension of size 400 and a latent space of size 20. The loss is defined by the mean squared error. The model is then trained on all the normal beats available, minimizing the reconstruction error between the input and the output. Once frozen, this model is integrated into our larger architecture. This reconstruction error, as presented in Figure 3, is already a good indicator for anomaly detection, but not satisfactory for classification.
Such a constructor may be used in two different ways to deal with binary classification: by either using the en-coded inputs as new features, or using the reconstruction er-ror through a subtraction layer between the input signal and the reconstructed signal. Those solutions are respectively re-ferred to by encoder and auto-encoder in our architectures. Another way of using this structure is to directly integrate it into the deep-learning model. The concurrent optimization of two models is thus necessary, building a relational encoding space relative to the task. This is the strategy that has been applied for multi-class classification.
3.4
Architecture
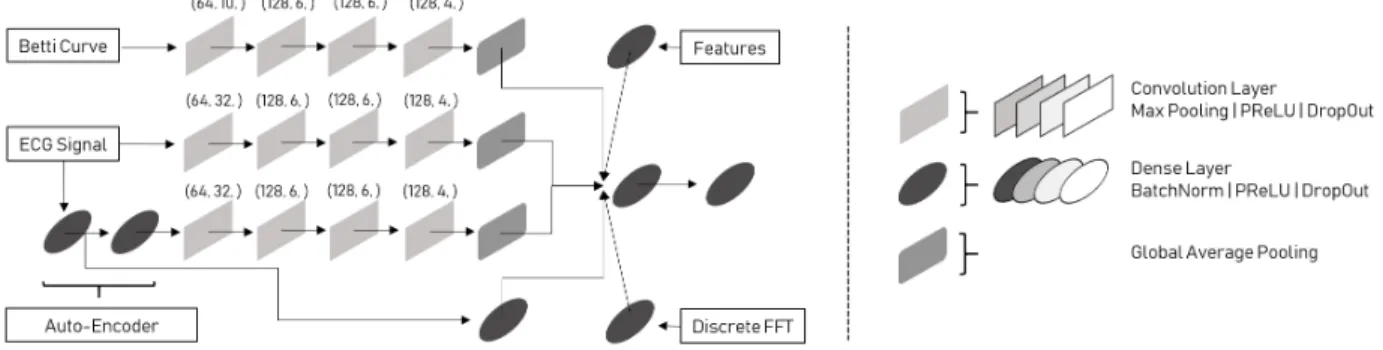
Once the preprocessing done, we undertook the construction of our deep-learning approach to deal with the multi-modality of inputs. Our first objective was to determine whether the heartbeats are normal or abnormal, before determining their classification. The aim of such strategy is to avoid the issue of great imbalance between normal and abnormal samples, while focusing on an easier task before multi-class classifica-tion. An overview of our architecture is given in Figure 4. Channels. For the auto-encoder, we use a convolution channel to deal with the subtracting layer, and a fully-connected layer to deal with the feature map given by the latent space. The input signals and the Betti curves are fed in convolution channels, aiming at extracting the right pat-terns [Kachuee et al., 2018; Xia et al., 2018; Isin and Oz-dalili, 2017; M.M. Al et al., 2016; Clifford et al., 2017; Rajpurkar et al., 2017]. The other inputs (both features and discrete Fast Fourier Transform coefficients) are injected into fully connected networks.
Annealed DropOut. As we launched a first battery of tests, we were confronted to the unexpected strong influence of the DropOut parameter. Its value could dramatically change the results. Since DropOut is of great help for generalization, we sought a way to deal with that issue. A solution came from the annealing dropout technique [Rennie et al., 2014; Jimmy Ba Brendan Frey, 2013], which consists in scheduling the decrease of the dropout rate. It helped us stabilizing the results.
4
Experimental Results
From the problem presentation, we highlighted two issues, relative to any healthcare machine-learning problem: imbal-anced datasets and individual differences. The fewer the pa-tients and the bigger the imbalance, the greater the influence of individual differences. To deal with the issue of imbalance, we introduced our auto-encoder architecture, while dealing with the individual differences by introducing Topological Data Analysis. Once we established our solution to both im-balance and individual differences, we aimed at developing our own approach and validation. As we mentioned earlier, two ways have been explored, both for performance enhance-ment and reduction of the influence of imbalance. The first one has been to detect whether a heartbeat is normal or abnor-mal, in order to get a first classification. The second one has been multi-class classification (13 classes) on the arrhythmic heartbeats only. Our objective is to introduce a new bench-mark to attest that TDA (and auto-encoders) do improve gen-eralization for arrhythmia classification.
Training Parameters. Different methods have been used for the model training and optimization. Firstly, all the chan-nels described previously are concatenated into one fully-connected network, dealing with all the obtained feature maps concurrently. Secondly, all the activation layers used are PReLU, initialized with he normal [He et al., 2015; Srivas-tava et al., 2015]. Thirdly, the dropout has been parametrized according to the strategy of the annealing dropout, from a rate of 0.5 to a rate of 0.0 after 100 epochs. Concerning the losses, we used the categorical crossentropy or binary crossentropy for the classification model, and mean squared error for the auto-encoder structure. Adadelta was used for optimization with an initial learning rate of 1.0.
Testing Methodology. Dealing with a health issue, the test-ing methodology has to be rigorously defined to accurately analyze the performances. A great importance was given to generalization abilities of the developed models. For that pur-pose, our strategy aimed at performing patient-based cross-validation, which means that for each model, train and vali-dation sets were build on a fraction of the available patients, while the remaining patients constituted the test set. This way, the validation score would demonstrate the ability of the model to dissociate arrhythmias on known patients, while the test score would demonstrate the ability of the model to detect arrhythmias on new patients. By using permutations of all the available patients, we were able to train, validate and test each model on all patients. The results presented in the following parts stem from a cross-validation keeping 5 unique patients for testing at each cross-validation permutation.
4.1
Channel Comparison
We first quantified the importance of each introduced chan-nel, by turning them off and on. Such strategy allowed us to specifically quantify the influence of the introduced TDA channel, as improving the general ability of our architecture to both detect and classify arrhythmias. We tested our archi-tecture through a patient-based cross-validation. Our format consisted in 10 experiments, made with the underlying will of generalization: for each experiment, 225 patients are used for both training (70%) and validation (30%), while 15 pa-tients are kept for testing. For the purpose of validation, each subset of 15 patients is not overlapping between experiments.
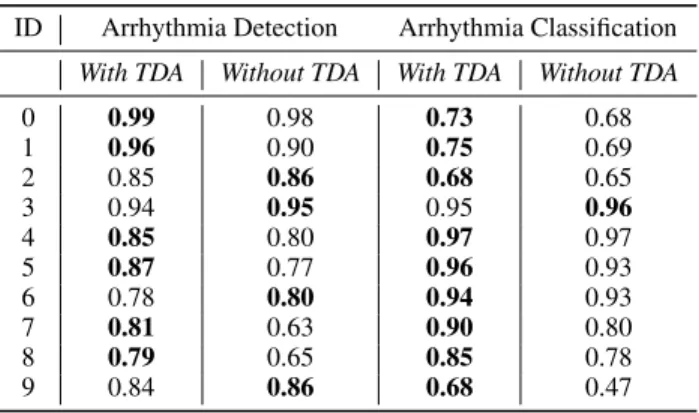
ID Arrhythmia Detection Arrhythmia Classification
With TDA Without TDA With TDA Without TDA
0 0.99 0.98 0.73 0.68 1 0.96 0.90 0.75 0.69 2 0.85 0.86 0.68 0.65 3 0.94 0.95 0.95 0.96 4 0.85 0.80 0.97 0.97 5 0.87 0.77 0.96 0.93 6 0.78 0.80 0.94 0.93 7 0.81 0.63 0.90 0.80 8 0.79 0.65 0.85 0.78 9 0.84 0.86 0.68 0.47
Table 2: Weighted Test Accuracy for Channel Comparisons. TDA improves both detection and classification, with a major improvement in arrhythmia classification, but also
greatly enhances performances reliability.
Finally, a closer look at Table 2 supports the impor-tance of TDA. Its role is emphasized for multi-class classifi-cation, with a general greater improvement of performances. With this right combination of channels, we aimed for test-ing through patient-based cross-validation for both binary and multi-class classification. For the purpose of the demon-stration, the scores are weighted in order to compensate for the general imbalance. Moreover, multi-class classifi-cation is not biased by normal samples since they have been extracted beforehand. This finally supports the generalization
role of TDA, that is expected to bring improvements com-bined with other deep-learning architectures as well.
4.2
Arrhythmia Detection
Our first benchmark dealt with arrhythmia detection (binary classification). It consisted in using our architecture, en-hanced with the (auto-) encoder trained in an unsupervised manner on normal beats. The model determined by chan-nel comparison has thus been used for cross-validation. Each instance of cross-validation has been made by randomly un-dersampling the majority class to obtain balanced datasets. It takes approximately 10 hours to train on a GPU (GeForce GTX). We used the data structure previously presented to test over the 240 patients we have in our datasets. Moreover, to tackle the issue of anomaly detection, and accelerate the pro-cess of validation, each cross-validation round is respectively built out of a set of 5 unknown patients. The mean accu-racy score is 98% for validation and 90% for test. This ap-proach shows great generalization abilities. Unfortunately, no other paper do use those test settings for comparison. With a closer look on the results, the low performances appear on pa-tients for which it was hard to recognize their normal beats. It also means that more patients may improve the general-ization abilities of the model. However, its performances on the validation results prove its abilities to learn about specific patients (suitable for personalized devices issues).
4.3
Arrhythmia Classification
The same strategy has been applied for multi-class classifi-cation. The greatest channel influence is provided by TDA and the encoder. As a consequence, we reduced the origi-nal model to the one composed of four channels in the same fashion than we did for anomaly detection. Moreover, the influence of those channels is greater than observed for bi-nary classification. Since the previous approach was not enough, we went further with 13-class classification. The models proved their ability to learn about heartbeat condi-tion through cross-validacondi-tion, with a mean validacondi-tion score of 97.3%, while being able to generalize this acquired knowl-edge on patients it never saw, with a mean testing accuracy of 80.5%. Once again, literature does not provide comparable settings. The use of cross-validation focused on the gener-alization ability of the model. By also removing the normal beats, we focus on differences between the different arrhyth-mias, and remove the influence of imbalance that is generally found in the scores presented in the literature.
5
Benchmarks Comparison
5.1
Premature Ventricular Heartbeats Detection
Since those open-source datasets have been exploited by oth-ers, we sought to compare our own architecture to existing benchmarks. Our claim is an enhanced generalization thanks to TDA and the auto-encoder architecture we developed. To support it, our first confrontation has been made with [Jian-ning, 2018], which focuses on the detection of premature ventricular contractions (PVC). The detection of a specific arrhythmia is a particular case of anomaly detection (one-vs-all), for which our architecture is suitable. The results weobtained are presented in tables 3 and 4, and support the gen-eralization ability of our model. For the comparison, we ap-plied the settings used in the paper. Out of the 48 initial pa-tients in the MIT-BIH Arrhythmia Database, 4 papa-tients are discarded. The remaining patients are split in two groups: 22 are used for training and validation, 22 are used for testing. The objective of such approach is to use the premature ven-tricular contractions, which are the majority class among the available arrhythmias. The results we obtained with such con-figuration are given in Table 3 for the MIT-BIH Arrhythmia, where PPV stands for Positive Predictive Value.
Paper Accuracy PPV Sensitivity
Proposed 99.2% 95.1% 95.5%
Li et al. (2018) 99.4% 93.9% 98.2%
Table 3: Detection of PVC - MIT-BIH Database However, they went further by considering the five databases. Our model being suited to that larger amount of data, we also compared our performances to their new set-tings. This time they split the group of 240 patients in two, both 120 for training and validation, and 120 for testing. Once again, our performances are given in Table 4. This experi-ment shows a great enhanceexperi-ment due to samples augexperi-menta- augmenta-tion in this case of one-vs-all classificaaugmenta-tion.
Paper Accuracy PPV Sensitivity
Proposed 96.1% 97.0% 96.0%
Li et al. (2018) 95.6% 94.1% 92.7%
Table 4: Detection of PVC - Augmented Databases. With more patients, those settings imply a greater need for generalization, which emphasizes our model ability to learn
the concept of PVC and apply it to unknown patients.
5.2
8-Classes Classification
The previous experiment is a specific use-case for our archi-tecture. In this second comparison, we focus on 8-classes classification [Jun et al., 2017]. Once again, our claim is better generalization, which is done thanks to patient-based cross-validation. Nonetheless, their settings imply a limita-tion to the MIT-BIH Arrhythmia Database, from which they select 8 classes, comprising normal beats. Unexpectedly, this selection does not correspond to the majority classes. Our performances are compared in Table 5, extending the results they present in their paper. We pinpoint, thanks to those re-sults, the generalization ability of our model, which has better positive predictive value (here precision) and sensitivity. It fi-nally underlines a more efficient classification.
6
Conclusion
We developed a new approach to deal with the issue of gen-eralization in arrhythmia detection and classification. Our innovative architecture uses common source of information, Topological Data Analysis and auto-encoders. We supported
Paper Classes Acc PPV Sen
Proposed 8 99.0% 99.0% 98.5%
Jun et al. (2017) 8 99.0% 98.5% 97.8%
Kiranyaz et al. (2017) 5 96.4% 79.2% 68.8%
Gler et al. (2018) 4 96.9% - 96.3%
Melgani et al. (2008) 6 91.7% - 93.8%
Table 5: 8-Classes Classification - MIT-BIH Database our claim of improved generalization with scores reaching the performances of state of the art methods, and above. Our ex-periments pinpoint the strengths of TDA and auto-encoders to improve generalization results. Moreover, the modularity of such model allows us to build and add new channels, such as a possible channel based on the Wavelet transform [Xia et al., 2018], which also gives a good description of the ECG time-series. Finally, we give a new benchmark on five open-source datasets, and as it is often the case in deep-learning, we still envision greater performances with larger datasets such as [Clifford et al., 2017].
References
[Awais et al., 2017] Muhammad Awais, Nasreen Badruddin, and Micheal Drieberg. A hybrid approach to detect driver drowsiness utilizing physiological signals to improve sys-tem performance and Wearability. Sensors (Switzerland), 2017.
[Baldi, 2012] P Baldi. Autoencoders, unsupervised learning, and deep architectures. 27:37–50, 2012.
[Blanco-Velasco et al., 2008] Manuel Blanco-Velasco, Bin-wei Weng, and Kenneth E. Barner. ECG signal denois-ing and baseline wander correction based on the empir-ical mode decomposition. Computers in Biology and Medicine, 2008.
[Buend´ıa-Fuentes et al., 2012] F. Buend´ıa-Fuentes, M. A. Arnau-Vives, A. Arnau-Vives, Y. Jim´enez-Jim´enez, J. Rueda-Soriano, E. Zorio-Grima, A. Osa-S´aez, L. V. Mart´ınez-Dolz, L. Almenar-Bonet, and M. A. Palencia-P´erez. High-Bandpass Filters in Electrocardiography: Source of Error in the Interpretation of the ST Segment. ISRN Cardiology, 2012.
[Chazal and Michel, 2017] Frederic Chazal and Bertrand Michel. An introduction to topological data analysis: fun-damental and practical aspects for data scientists. Submit-ted to the Journal de la Societe Francaise de Statistiques, 2017.
[Chazal et al., 2016] Fr´ed´eric Chazal, Vin de Silva, Marc Glisse, and Steve Oudot. The structure and stability of persistence modules. SpringerBriefs in Mathematics. Springer, 2016.
[Clifford et al., 2017] Gari D Clifford, Chengyu Liu, Ben-jamin Moody, Li-wei H Lehman, Ikaro Silva, Qiao Li, A E Johnson, and Roger G Mark. AF Classification from a short single lead ECG recording: the Phys-ioNet/Computing in Cardiology Challenge 2017. 2017.
[Edelsbrunner and Harer, 2010] Herbert Edelsbrunner and John Harer. Computational Topology: An Introduction. AMS, 2010.
[Goldberger et al., 2000] AL Goldberger, LAN Amaral, L Glass, JM Hausdorff, PCh Ivanov, RG Mark, JE Mi-etus, GB Moody, C-K Peng, and HE Stanley. PhysioBank, PhysioToolkit, and PhysioNet: Components of a New Re-search Resource for Complex Physiologic Signals. 2000. [Goras and Fira, 2010] Liviu Goras and Monica Fira.
Pre-processing Method For Improving Ecg Signal Classifica-tion And Compression ValidaClassifica-tion. 2010.
[Greenwald, 1986] SD Greenwald. Development and analy-sis of a ventricular fibrillation detector. MIT Dept. of Elec-trical Engineering and Computer Science, 1986.
[Greenwald, 1990] SD Greenwald. Improved detection and classification of arrhythmias in noise-corrupted electrocar-diograms using contextual information. Harvard-MIT Di-vision of Health Sciences and Technology, 1990.
[Hassanien et al., 2018] Aboul Ella Hassanien, Moataz Ki-lany, and Essam H. Houssein. Combining support vector machine and elephant herding optimization for cardiac ar-rhythmias. CoRR, abs/1806.08242, 2018.
[He et al., 2015] Kaiming He, Xiangyu Zhang, Shaoqing Ren, and Jian Sun. Delving Deep into Rectifiers: Sur-passing Human-Level Performance on ImageNet Classifi-cation. 2015.
[Houssein et al., 2017] Essam Houssein, Moataz Kilany, and Aboul Ella Hassanien. Ecg signals classification: a review. 5:376, 01 2017.
[Isin and Ozdalili, 2017] Ali Isin and Selen Ozdalili. Car-diac arrhythmia detection using deep learning. In Procedia Computer Science, 2017.
[Jianning, 2018] Li Jianning. Detection of Premature Ven-tricular Contractions Using Densely Connected Deep Con-volutional Neural Network with Spatial Pyramid Pooling Layer. 2018.
[Jimmy Ba Brendan Frey, 2013] Lei Jimmy Ba Brendan Frey. Adaptive dropout for training deep neural networks. 2013.
[Jun et al., 2017] Tae Joon Jun, Hoang Minh Nguyen, Daey-oun Kang, Dohyeun Kim, YDaey-oung-Hak Kim, and DaeyDaey-oung Kim. Ecg arrhythmia classification using a 2-d convolu-tional neural network (submitted). 04 2017.
[Kachuee et al., 2018] Mohammad Kachuee, Shayan Fazeli, and Majid Sarrafzadeh. ECG Heartbeat Classification: A Deep Transferable Representation. 2018.
[Lu et al., 2018] Weijia Lu, Jie Shuai, Shuyan Gu, and Joel Xue. Method to annotate arrhythmias by deep network. 06 2018.
[Luz et al., 2016] Eduardo Jos´e da S. Luz, William Robson Schwartz, Guillermo C´amara-Ch´avez, and David Menotti. ECG-based heartbeat classification for arrhythmia detec-tion: A survey. Computer Methods and Programs in Biomedicine, 2016.
[Maria et al., 2014] C. Maria, J.-D. Boissonnat, M. Glisse, and M. Yvinec. The gudhi library: Simplicial complexes and persistent homology. In International Congress on Mathematical Software, pages 167–174. Springer, 2014. [M.M. Al et al., 2016] Rahhal M.M. Al, Bazi Yakoub,
Al-Hichri Haikel, Alajlan Naif, Melgani Farid, and Yager R.R. Deep learning approach for active classification of electrocardiogram signals. Information Sciences, 345:340 – 354, 2016.
[Moody and Mark, 2001] GB Moody and RG Mark. The im-pact of the MIT-BIH Arrhythmia Database. IEEE Eng in Med and Biol, 2001.
[Padmavathi and K.Sri, 2016] Kora Padmavathi and Rama Krishna K.Sri. Hybrid firefly and particle swarm optimization algorithm for the detection of bundle branch block. International Journal of the Cardiovascular Academy, 2(1):44 – 48, 2016.
[Pyakillya et al., 2017] B. Pyakillya, N. Kazachenko, and N. Mikhailovsky. Deep Learning for ECG Classification. In Journal of Physics: Conference Series, 2017.
[Rajpurkar et al., 2017] Pranav Rajpurkar, Awni Y Hannun, Masoumeh Haghpanahi, Codie Bourn, and Andrew Y Ng. Cardiologist-level arrhythmia detection with convolutional neural networks. 2017.
[Rennie et al., 2014] Steven J Rennie, Vaibhava Goel, and Samuel Thomas. Annealed Dropout Training Of Deep Networks. 2014.
[Shirin and Behbood, 2016] Shadmand Shirin and Mashoufi Behbood. A new personalized ecg signal classification algorithm using block-based neural network and particle swarm optimization. Biomedical Signal Processing and Control, 25:12 – 23, 2016.
[S.M. and E.S., 2013] Abd-Elazim S.M. and Ali E.S. A hy-brid particle swarm optimization and bacterial foraging for optimal power system stabilizers design. International Journal of Electrical Power and Energy Systems, 46:334 – 341, 2013.
[Srivastava et al., 2015] Rupesh Kumar Srivastava, Klaus Greff, and Urgen Schmidhuber. Training Very Deep Net-works. 2015.
[Umeda, 2016] Yuhei Umeda. Time series classification via topological data analysis. Transactions of the Japanese Society for Artificial Intelligence, Vol. 32, 2016.
[Upganlawar and Chowhan, 2014] Isha V Upganlawar and Harshal Chowhan. Pre-processing of ECG Signals Us-ing Filters. International Journal of Computer Trends and Technology, 11(4), 2014.
[Xia et al., 2018] Yong Xia, Naren Wulan, Kuanquan Wang, and Henggui Zhang. Detecting atrial fibrillation by deep convolutional neural networks. Computers in Biology and Medicine, 2018.
[Yochum et al., 2016] Maxime Yochum, Charlotte Renaud, and Sabir Jacquir. Automatic detection of p, qrs and t pat-terns in 12 leads ecg signal based on cwt. Biomedical Sig-nal Processing and Control, 25:46 – 52, 2016.


![[PDF] Cours général d’initiation à L'ergonomie au bureau - Cours Ergonomie](data:image/gif;base64,R0lGODlhAQABAIAAAP///wAAACH5BAEAAAAALAAAAAABAAEAAAICRAEAOw==)