HAL Id: hal-02134654
https://hal.archives-ouvertes.fr/hal-02134654
Submitted on 20 May 2019
HAL is a multi-disciplinary open access
archive for the deposit and dissemination of
sci-entific research documents, whether they are
pub-lished or not. The documents may come from
teaching and research institutions in France or
abroad, or from public or private research centers.
L’archive ouverte pluridisciplinaire HAL, est
destinée au dépôt et à la diffusion de documents
scientifiques de niveau recherche, publiés ou non,
émanant des établissements d’enseignement et de
recherche français ou étrangers, des laboratoires
publics ou privés.
On the Cost of Acking in Data Stream Processing
Systems
Alessio Pagliari, Fabrice Huet, Guillaume Urvoy-Keller
To cite this version:
Alessio Pagliari, Fabrice Huet, Guillaume Urvoy-Keller. On the Cost of Acking in Data Stream
Processing Systems. 2019 19th IEEE/ACM International Symposium on Cluster, Cloud, and Grid
Computing (CCGRID), May 2019, Larnaca, Cyprus. �10.1109/CCGRID.2019.00047�. �hal-02134654�
On the Cost of Acking in
Data Stream Processing Systems
Alessio Pagliari, Fabrice Huet, Guillaume Urvoy-Keller Universite Cote d’Azur, CNRS, I3S
{alessio.pagliari, fabrice.huet, guillaume.urvoy-keller}@univ-cotedazur.fr
Abstract—The widespread use of social networks and appli-cations such as IoT networks generates a continuous stream of data that companies and researchers want to process, ideally in real-time. Data stream processing systems (DSP) enable such continuous data analysis by implementing the set of operations to be performed on the stream as directed acyclic graph (DAG) of tasks. While these DSP systems embed mechanisms to ensure fault tolerance and message reliability, only few studies focus on the impact of these mechanisms on the performance of applications at runtime.
In this paper, we demonstrate the impact of the message reliability mechanism on the performance of the application. We use an experimental approach, using the Storm middleware, to study an acknowledgment-based framework. We compare the two standard schedulers available in Storm with applications of various degrees of parallelism, over single and multi cluster scenarios. We show that the acking layer may create an unfore-seen bottleneck due to the acking tasks placement; a problem which, to the best of our knowledge, has been overlooked in the scientific and technical literature. We propose two strategies for improving the acking tasks placement and demonstrate their benefit in terms of throughput and latency.
Keywords-Data Stream Processing, Message Reliability, Apache Storm, Acking Framework, Scheduling
I. INTRODUCTION
In the last years, we have observed a growing demand for real-time processing of the continuous stream of data gen-erated by, e.g., social or sensor networks [1]. To address this challenge, several Data Stream Processing (DSP) systems have been developed, such as Storm [1], Heron [2], Spark Streaming [?], Flink [3], Samza [4] and MillWheel [5]. These systems strive to offer low latency and high throughput processing of live streams of data.
Modern DSP engines are designed to apply complex pro-cessing on data as a sequence of task to be executed [6]. Each task can be replicated and distributed over the cluster to scale the application, increasing throughput capacity. The task scheduling algorithm plays an important role to optimize the task placement, trying to balance the computation load and minimize the end-to-end latency. Following the distributed paradigm, every DSP engine implements, in its own man-ner, non-functional components which implements mechanism such as monitoring, logging or message guaranteeing. Regard-ing the latter, there are three message delivery paradigms: at-most-once, at-least-once and exactly-once. Most middlewares propose a way to perform exactly-once processing, while all of them offer at-least-once. Message reliability can sometimes
hurt the application performance [7] as enforcing delivery guarantees on message can come at the price of a reduced throughput or an increased processing latency.
Several works concentrate on the fault tolerant and relia-bility aspect of stream processing applications (Section II). Every DSP engine proposes its own approach to the problem, optimizing the offered delivery paradigm. A large set of efforts focuses on improving fault tolerant checkpointing systems. However, to the best of our knowledge, no work has ever precisely analyzed the impact of message guaranteeing on the performance of DSP applications, especially, acknowledgment based systems.
In this paper we show how an ack-based framework offering message delivery guarantee can have an uncontrolled impact to the performance of a DSP application. We take advantage of Storm’s open-source nature that allows us to fully analyze the framework. Storm deploys the tasks of an application in Java Virtual Machines (JVM) in the nodes of the cluster. We study the strategies used to implement acking by the two popular schedulers of Storm, namely the Even Scheduler and the Resource-Aware Scheduler (RAS) [8]. In both of them, the acking mechanism is materialized as tasks to be deployed on the cluster.
We show that the Resource-Aware Scheduler considers only marginally the acker tasks (a.k.a. ackers) during placement, resulting in degraded performance as compared to the Even scheduler. We next design and implement two task placement strategies for the RAS scheduler that take in account ackers and optimize their placement. The first strategy balances the acking load, collocating the ackers with other application tasks. The second strategy places the ackers in dedicated JVMs, separating them from the application tasks, alleviating the load of the incoming message queues. We evaluate these two solutions in single cluster and multi-cluster environments. The main contributions of our work can be summarized as follows:
• We demonstrate the impact of the middleware message
delivery system on the application performance.
• Focusing on the Storm case, we show that the acking
system generates a large share of the network traffic. Moreover, the placement of ackers can significantly im-pact the overall performance of the application.
• We present two ackers placement strategies that improve the performances of the two standard schedulers. The rest of the paper is organized as follows: related work is
presented in Section II. Then, in Section III we detail the knots and bolts of Storm and its relevant components. In Section IV we precisely define the problem we study. In Section V we explain the two ackers placement strategies we propose, that we evaluate against the legacy Storm schedulers in Section VI. Section VII concludes the paper.
II. RELATEDWORK A. Reliability and Fault Tolerance
Each DSP engine implements message processing guaran-tee in its own way. Storm implements an upstream backup through acknowledgment that keeps track of the messages along the processing path [1]; similarly to Storm, Heron [2] and Moillwheel [5] implement an acknowledgement-based upstream backup, however, in addition, both system use an auxiliary checkpointing system to further improve message reliability. Apache Flink provides a checkpointing mechanism that continuously stores the state of the system [3]; Spark Streaming relies on Spark Resilient Distributed Dataset (RDD) supports and the different guarantees provided by the external data sources [9]; Samza adopts a changelog approach [4].
Fault tolerance of DSP is also a hot research topic [10]. Most works concern checkpointing and snapshot techniques. Zhuang et al. [11] propose a novel Optimal Checkpointing Model for stream processing. This model proposes a dynamic calculation of an optimal checkpointing interval, aiming to obtain an optimal processing efficiency. A more workflow-generic approach is taken by [12], where the authors tackle the problem of corrupted data failures, so called silent errors. They optimize the checkpointing overhead, for fail-stop errors, by proposing different combinations of scheduling algorithms and checkpointing techniques. Carbone et al. [13] propose an asynchronous snapshotting algorithm for stream processing dataflows, where they minimize the space requirement of snapshots.
Another popular solution is to perform replicas of the application. A dynamic replication scheme is presented in [14] that continuously monitors the system deciding the optimal technique to apply for the workflow. Cardellini et al. [15], [16] formulate an optimal DSP replication and placement model, where they compute a number of replica for each task to optimally scale the application. In [17] is presented a DSP engine that implements a checkpointing system combined with a partial replication of tasks, in order to reduce the cost of the system recovery and the necessity of backup nodes.
Recent works are concentrating of upstream backup sys-tems. Li et al. [18], [19] suggest a solution considering tasks-failures. In their work they describe a task allocation strategy that takes into account the impact of tasks recovery over the cluster resources.
All these works propose novel solutions to fault tolerant systems but none actually investigate the cost of their im-plementation on real applications. In this paper we focus on message reliability and on its impact over the application performances at runtime.
B. Application Scheduling and Task placement
When talking about resource limitations, several works pro-pose novel scheduling solutions directed to optimize resource utilization and minimize communication latency, with partic-ular attention over network communication load in relation to task placement [20]. A large set of works has been done in relation to Storm.
Similarly to R-Storm [8], widely discussed in Section III-C, two past works [21] and [22] propose different schedulers pivoting around the concept of network distance. Both works focus their solution on minimizing the network communica-tion, implementing at the same time a monitoring system to optimize at runtime the application’s resource utilization.
Cardellini et al. [23], [24], try to extend the scheduling to a wider Quality of Service (QoS) point of view, focusing on dis-tributed scenarios like Fog Computing [25]. They implement an online scheduler that considers latency, CPU utilization and data traffic, trying to minimize the traffic between components and optimize the system availability.
Eskandari et al. [26], [27] implement two online schedulers based on graph theory. They consider network traffic and resource allocation, with objective of minimizing data commu-nication between tasks and optimize the resources allocation. Both their solutions exploit graph partition methods to improve the tasks ordering and placement of R-Storm.
Even if all the presented works, in diverse fashions, optimize the application’s resource utilization, none of them directly consider the acknowledgment framework of DSPs. This work will show how a task-oriented acking system, such as the one of Storm, can impact the system performances. Specifically, we demonstrate how not only the application tasks have to be optimally placed, but so should the tasks dedicated to acking.
III. BACKGROUND A. Storm Overview
Storm is a distributed data stream processing system that relies on ZooKeeper [28] to manage the coordination between all its components and the cluster resources. It implements a master-slave design. The controller node, called Nimbus, manages the status of the cluster. It is in charge of managing new topologies to be scheduled, fault-tolerance and directly communicates with ZooKeeper. The Supervisors are the slave nodes where the tasks will be scheduled. Each supervisor provides to Nimbus a set of Java Virtual Machines (JVM) called workers. Each worker is assigned a communication port and can contain several threads, known as executors. Runtime examples of the Stom architecture are depicted in Figs. 1b and 1c.
The topology is represented by a Directed Acyclic Graph (DAG), where the components are the vertices and the edges are the connections between components. The application running on the cluster is made of two types of components. Spouts represent data sources and inject streams of tuples into the workflow. Bolts encapsulate simple operations to be performed on input tuples. Each component has its own level
S
B1
B2
B3
Component ParallelizedComponent Flow Connection
(a) Sample topology: one spout; two bolts (split); one final bolt (join). The last compo-nent has a parallelism level of 1, the others of 2 SUPERVISOR A SUPERVISOR B WORKER 1 S B1 WORKER 2 B1 B2 SLOT 3 WORKER 1 B2 SLOT 2 SLOT 3 B3 Executors S
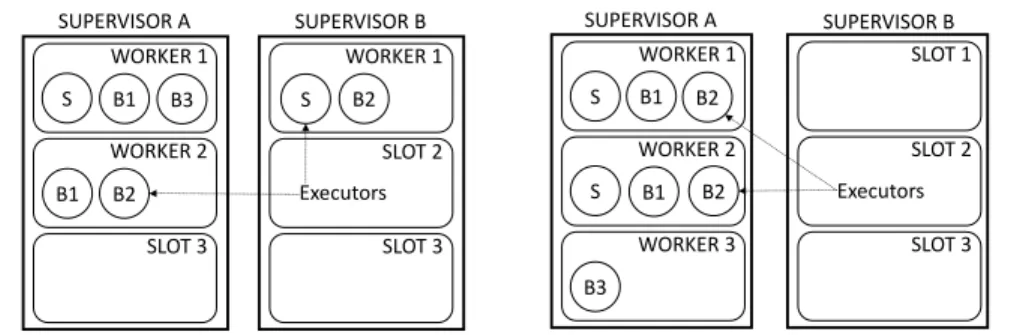
(b) Even Scheduling: placement example with 3 total workers; 2 executors per worker
SUPERVISOR A SUPERVISOR B WORKER 1 S B1 WORKER 2 S B1 WORKER 3 SLOT 1 B3 SLOT 2 SLOT 3 B2 B2 Executors
(c) RAS: placement example with a configu-ration that allows 3 executors per woker; 3 workers used, 3 executors per worker
Fig. 1: Example of Storm application and different ways of scheduling
of parallelism and can span multiple workers and executors to scale and distribute the application. Spouts and Bolts are connected through different ways, called stream groupings [29], as such as hash-based routing or tuple duplication.
A sample topology, composed of one spout and three bolts, is shown in Fig. 1a. All components except bolt B3 have a parallelism level of 2 which means they will take 2 executors at runtime.
B. Acking Framework
The acking framework in Storm serves two functions1: message reliability and backpressure. In the first case [30], to ensure the at-least-once processing property, every tuple in the workflow will be acked by each task. In case of failure, they will be re-transmitted by the previous executor. In the second case, each spout maintains the status of in-flight tuples and if the number of tuples waiting to be acked exceeds a threshold, the backpressure mechanism will be activated, slowing down the spouts.
Storm uses special system tasks, called ackers, to manage the status of the tuples, and designed to be lightweight [30]. The path of tuples in the DAG is depicted as a tree and the ackers are able to update step-by-step the completion status of each tuple running in the system, keeping track of eventual tuple duplication and joins. These tasks are implemented as any other executor [31] and process incoming tuples in a similar manner. They can receive ack tuples from both spouts and bolts. The Spouts use the INIT stream to indicate the creation of a new tuple to the application workflow and the Bolts use the ACK stream to ack the tuple along the tuple tree. For every new tuple, a spout generates a random ID and sends the XORed value to an acker chosen using an hash-based function. Ackers keep a two-entry table which associates a spout ID to the XORed value. Upon processing a tuple, a bolt can anchor resulting tuples to the original one, creating a tree-like relation. The root tuple will be fully acked only when all its children will be. If after 30 seconds a tuple has not been
1as of Storm version 1.2.x
acked, it is considered as failed. It will be retransmitted by the last bolt which has acked it or the spout if it was lost at the beginning.
The acking framework is also used to enforce a backpressure mechanism which can be activated by setting an integer value to the max.spout.pending configuration option. This value is the maximal number of non-acked tuples allowed before slowing down the emission rate. If not set (by default), there is no ack-based backpressure.
C. Scheduling
After submitting a topology, Nimbus will take care of its placement in the cluster applying a scheduling algorithm. The initial versions of Storm were released with an Even scheduler, which is still today the default option. Another scheduler, called the Resource-Aware Scheduler (RAS) and based on [8] is also available.
Algorithm 1: Even Scheduler
1 slots ←sortFreeSlotsBy(slot#, supervisor); 2 n ←min(requestedWorkers, availableSlots); 3 workers ←getFirstN(slots, n);
4 fore in topologyExecutors do
5 worker ← getNext(workers);
6 assign e to worker;
1) Even scheduler: The Even scheduler is based on a simple strategy as shown in Algorithm 1. It distributes the tasks following a round robin manner on a set of workers. The number of workers to use is specified by the user (default is 1). The topology executors are sorted by ID which by default entails to spouts first, then first bolt, ...; traversing the DAG in a breadth-first fashion. With this algorithm the executors are balanced over the workers, and so is the computation, if tasks have homogeneous CPU requirements.
For example, if a user requests 3 workers for the sample topology (Fig. 1a) on a cluster composed of 2 supervisors with 3 slots each, it will be scheduled as follows. First, the slots
will be sorted by worker and supervisor giving the following list: (Worker 1/Sup A, Worker 1/Sup B,Worker 2/Sup A...). The first 3 will be selected and the algorithm will then iterate over the components. The first spout component will be placed on 1/A, the second on 1/B... leading to the scheduling shown in Fig. 1b.
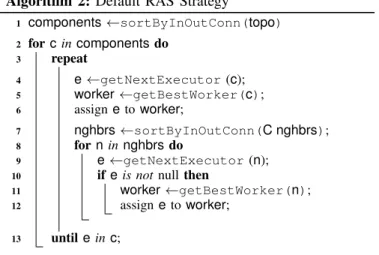
Algorithm 2: Default RAS Strategy
1 components ←sortByInOutConn(topo) 2 forc in components do 3 repeat 4 e ←getNextExecutor (c); 5 worker ←getBestWorker(c); 6 assign e to worker; 7 nghbrs ←sortByInOutConn(C nghbrs); 8 forn in nghbrs do 9 e ←getNextExecutor (n);
10 ife is not null then
11 worker ←getBestWorker(n);
12 assign e to worker;
13 untile in c;
2) Resource Aware Scheduler: The RAS aims at optimizing the resource utilization on the nodes while minimizing the net-work distance between tasks. In [8], the authors have defined the concept of network distance: inter-rack and inter-node connection are the slowest due to the network link, intra-node (i.e. inter-worker, through TCP) connection is faster, intra-worker (using serialization) is the fastest. Placing tasks with a higher connection level closer to each other should reduce the communication load and thus the latency. Moreover, this scheduler introduces the notion of memory and cpu resources provided by the cluster. The first one is specified as the amount of memory in megabytes. The second one, specified as cpu units, represents the computational power of a node and is normalized to 1 core = 100 cpu units. When submitting a topology, a user can thus specify its resource requirements.
The RAS, allows the definition of external
scheduling strategies. The one in use by default is
the DefaultRsourceAwareStrategy, shown in
Algorithm 2. The strategy first starts by sorting components by the sum of their input and outputs connections. Then, it selects the first executor of the first component in the list and assign it to a worker. Then it performs an ordering of its neighbors and places one executor for each of them. The loop is repeated until executors exhaustion. To select the best fitting worker for an executor, the algorithm sorts them by their network distance (racks or nodes) and the available resources, giving priority to the location where some other components of the same topology are already placed. At each executor placement, the scheduler decrements the occupied resources from executors, including ackers, are placed at the end of the process, also considering available and requested resources as specified in the default Storm configuration.
Applying the RAS scheduler to the sample topology of
Fig. 1a will lead to the deployment in Fig. 1c. First it will compute the in-out degree of each components, taking into account the parallelism level. Spout S has 0 in links and 2 out links on the schema. Each out-link of S connects to components with a parallelism level of 2, the same as S. Hence, the total number of out-links is 2 × 2 × 2 = 8. Bolt B1 has 2 in links from S, combined with its parallelism level this gives 2 × 2 = 4 in links, and 2 × 1 = 2 out links. Once sorted, S will be the first to be scheduled, and then it will be its neighbors B1 and B2. Since the algorithm gives priority to the smallest network distance, the components will all be placed in Supervisor A, i.e. the same node.
IV. UNDERSTANDING THEIMPACT OFACKING In this section we show a wildly varying performance observed in our experimentation2 (Fig. 2), given by the two different Storm’s cheduling algorithms.
time
0
1.5 M
tuples/s
throughput
(a) Even Scheduler
time 0 616 K tuples/s throughput (b) RAS
Fig. 2: Storm tuples throughput
Both schedulers expose to the user some configuration parameters which can be used to direct the deployment of an application. The Even scheduler allows to set the number of workers to use. Specifying large values will force the spreading of tasks over multiple nodes of a cluster. With the Resource-Aware scheduler, it is possible to define CPU and memory requirements for every component [8]. These values will directly impact the number of nodes used by a topology. Predicting the optimal values for these parameters is a non-trivial challenge. Hence, both schedulers usually require a tuning-up phase to find the most fitting values in order to optimize the throughput and latency of an application.
Nevertheless, even with a meticulous tuning of these val-ues it is possible to encounter further placement problems caused by components out of user’s control. As mentioned before (Section III-B), Storm implements message guarantee-ing through special system executors, which have to be placed by the scheduler. As shown in Section III-C2, the resource-aware scheduler tries to perform resource optimization with an offline algorithm. It is based on user defined parameters for both the cluster nodes and the topology components. Ackers’ requirements have a default value of 10 CPU units and 128MB of memory. With some particular combination of user provided parameters, the placement of the topology components may precisely fit the used nodes, not leaving enough space for the acker executors. This produces a final placement where
cpu0cpu1cpu2cpu3cpu4cpu5cpu6cpu7 node0 node1 node2 node3 node4 node5 node6 node7 node8 node9 node10 node11 node12 node13 node14 node15 0.9 0.7 0.7 0.6 0.7 0.6 0.7 0.6 0.9 0.7 0.7 0.7 0.7 0.7 0.8 0.7 0.9 0.7 0.7 0.7 0.7 0.7 0.7 0.7 0.9 0.7 0.7 0.7 0.7 0.7 0.7 0.6 0.9 0.7 0.7 0.6 0.7 0.6 0.7 0.6 0.9 0.7 0.7 0.6 0.7 0.6 0.6 0.6 0.9 0.7 0.7 0.7 0.7 0.7 0.6 0.7 0.9 0.7 0.7 0.7 0.7 0.6 0.7 0.7 0.9 0.7 0.7 0.7 0.7 0.7 0.7 0.7 0.9 0.7 0.7 0.6 0.7 0.6 0.7 0.7 0.9 0.7 0.7 0.7 0.7 0.7 0.7 0.7 0.9 0.7 0.7 0.6 0.7 0.7 0.7 0.6 0.9 0.7 0.7 0.7 0.7 0.6 0.7 0.7 0.9 0.7 0.7 0.7 0.7 0.7 0.7 0.7 0.9 0.7 0.7 0.6 0.7 0.6 0.6 0.6 0.9 0.7 0.7 0.7 0.7 0.6 0.7 0.6 0.0 0.2 0.4 0.6 0.8 1.0 cpu usage
(a) Even Scheduler: ackers bal-anced over all nodes
cpu0cpu1cpu2cpu3cpu4cpu5cpu6cpu7 node0 node1 node2 node3 node4 node5 node6 node7 node8 node9 node10 node11 node12 node13 node14 node15 1.0 0.0 0.0 0.0 0.0 0.0 0.0 0.0 1.0 0.7 0.7 0.7 0.7 0.7 0.7 0.7 1.0 0.7 0.7 0.7 0.7 0.7 0.7 0.7 1.0 0.7 0.7 0.7 0.7 0.7 0.7 0.7 1.0 0.8 0.8 0.8 0.8 0.8 0.8 0.7 1.0 0.8 0.8 0.7 0.8 0.8 0.8 0.8 1.0 0.7 0.7 0.7 0.7 0.7 0.7 0.7 1.0 0.9 0.9 0.9 0.9 0.9 0.9 0.9 0.9 0.7 0.7 0.6 0.7 0.6 0.7 0.6 1.0 0.7 0.7 0.7 0.7 0.7 0.7 0.7 1.0 0.7 0.7 0.7 0.7 0.6 0.7 0.7 1.0 0.7 0.7 0.7 0.7 0.7 0.7 0.7 0.9 0.6 0.7 0.6 0.7 0.6 0.6 0.6 1.0 0.8 0.8 0.8 0.8 0.7 0.8 0.7 0.9 0.6 0.6 0.5 0.5 0.5 0.5 0.5 0.9 0.6 0.7 0.6 0.7 0.6 0.6 0.6 0.0 0.2 0.4 0.6 0.8 1.0 cpu usage
(b) RAS: Majority of ackers co-placed in node7
Fig. 3: CPU utilization of a Storm cluster: two different schedulers
node0node1node2node3node4node5node6node7node8node9node10node11node12node13node14node15
0 20 40 60 80 # of processes waiting
(a) Even Scheduler: ackers balanced over all nodes
node0node1node2node3node4node5node6node7node8node9node10node11node12node13node14node15
0 20 40 60 80 # of processes waiting
(b) RAS: Majority of ackers co-placed in node7
Fig. 4: CPU load of a Storm cluster: two different schedulers
the ackers ends up in the last used node with still some free space, or even in a new separated node. In this situation, all ackers will be co-placed inside the same node, or even the same worker.
This co-placement of ackers can cause a degradation of performances because of the increased load they put on the CPU. This can be observed by directly measuring the load on each node as shown in figures Figs. 3 and 4. When several ackers are placed inside node 7 (Figs. 3b and 4b), it increases the number of processes competing for the CPU, increasing the load, and thus slowing down the entire topology. Meanwhile, a more balanced ackers distribution (Figs. 3a and 4a) will even the load and ultimately offer better performance.
This can also be observed at the middleware level. Each executor has an incoming message queue called the distruptor
time 0
20 40
sojourn time (ms)
(a) Worker in a balanced schedul-ing time 0 250 500 750 1000 sojourn time (ms)
(b) Worker in a overloaded node
Fig. 5: Example of workers executors disruptor queues: so-journ time
time
0 B
255 MB
155 MB
network traffic (Bytes/s) totalacking
Fig. 6: Storm application network traffic using 7 char long java string tuples
queue, as well as an output transfer queue common to the worker where they are placed. When executors, i.e. ackers, are co-placed inside the same worker, their queues share the same memory space. When the load is well balanced, the tasks have a good processing rate, quickly consuming from the queue (Fig. 5a). However, if multiple ackers are co-placed inside the same node worker, the tasks won’t be able to keep up with the rate of incoming tuples. This will result in more congested queues with highly variable sojourn times (Fig. 5b).
To enable message guaranteeing, Storm needs to generate an acking message for each tuple processed by each task. As a consequence, this mechanism can generate a lot of traffic. Measuring network traffic — i.e. inter-worker and inter-node TCP traffic — during the experiments, we observe (Fig. 6) that in certain case the amount of traffic generated by the sole acking mechanism can be more than half of the total traffic produced by the running topology.
With large applications and a huge input rate, the number of tuples to be acked will be critical, exacerbating the problems described above. Even if the acker executors are designed to be lightweight, the high load of acking messages to be processed can over-exceed their capabilities, slowing down the processing rate. As a consequence, the number of pending tuples would increase and the back-pressure mechanism will choke the spouts. Simultaneously, the number of tuples waiting in the queue will build up, reaching the queue maximum and increasing the risk for new incoming tuples to fail.
Even at a small scale, the placement of ackers could impact the communication latency. If they are co-placed in a single node, it increases the probabilities that the acking messages travel through the network, instead of reaching directly a acker
in the same node (or, better, in the same worker). In such a situation, the optimization performed by the RAS scheduler to minimize the communication is at risk of being nullified by the increased distance to ackers.
V. ACKERS-AWAREPLACEMENT
In this section, we propose two extensions to the RAS scheduler that take into account ackers during tasks placement. The default number of ackers in the default RAS is equal to 1. This choice obviously leads to performance degradations with increasing application load. A more efficient acking strategy requires to: 1) set the number of ackers and 2) devise a strategy to map ackers to workers.
For the first problem, we rely on the heuristic used in the Even scheduler, which is to set a number of ackers equal to the number of workers. However, this number is not known in advance in the RAS scheduler, as opposed to the Even scheduler where it is set by the user. In the RAS scheduler, the number of workers is the result of the placement process based on the requirements of the component tasks in terms of CPU and RAM. To work around this issue, we use the components requirements with the CPU capacity of the nodes (resp. the JVM memory) to estimate the maximum number of executors a node can contain (resp. maximum number of executors per worker). We obtain the number of workers per node and the total number of nodes required. This gives us the total number of workers.
The second problem, mapping ackers to workers, can be addressed using two different strategies that will be detailed below. We decided to set to 0 their CPU and memory re-quirements. This gives us all the needed flexibility for their placement.
A. One-per-Worker Strategy
The One-per-Worker Strategy (OPW) focuses on balancing the acking process computation load over the workers. On large topology or large clusters, this translates into more uniform load over all nodes. The idea is to replicate the scheduling strategy of the Even Scheduler by placing one acker per worker while preserving the RAS algorithm for the other components.
The algorithm starts with an unmodified RAS placement strategy for the components (Algorithm 2). During this first phase, OPW gets the list of workers and during a second phase, acker placement is performed. Ackers are assigned in a round robin manner in each worker. The benefit of this approach is that it combines the default scheduling of RAS (minimized communication latency) and a better lead distribution for ackers.
B. Isolated Queue Strategy
This second strategy, called Isolated Queue (IQ), isolates the queues used by the ackers. The rational is to avoid competition with other executors over the incoming queue. This mechanism has the added benefit of reducing crashes due to incoming queues using all the available memory.
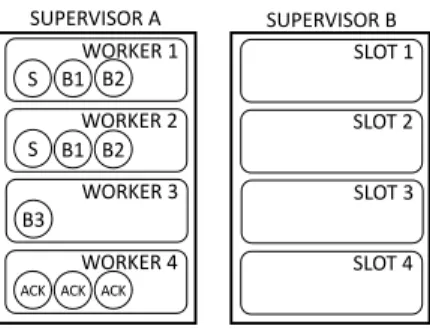
SUPERVISOR A SUPERVISOR B WORKER 1 S B1 WORKER 2 S B1 WORKER 3 B3 B2 B2 WORKER 4
ACK ACK ACK
SLOT 1 SLOT 2 SLOT 3 SLOT 4
Fig. 7: IQ placement example with a configuration that allows 3 executors per worker; 4 workers used, 3 total ackers placed on a dedicated worker
The IQ strategy deploys the same number of ackers as the OPW strategy, i.e. one per worker. But instead of placing one acker per worker, it groups them in a single worker. Listing 3 shows the algorithm executed after the RAS algorithm has finished placing the other components. The IQ strategy first obtains the nodes where the current topology assignment has reserved some slots, and then creates one worker for each node. The algorithm then cycles the nodes and the ackers to be placed. If in the selected node, a dedicated worker is not present it will create it and deploy a first acker in it. If it already exists, it will co-place another acker in the same worker.
Algorithm 3: IQ: Isolated Queue Strategy
1 RAS assignment of topology executors to workers; 2 fora in AckersToBePlaced do 3 n ← getNextUsedNode(); 4 w ← getAckerWorker(n); 5 ifw is null then 6 w ← createAckerWorker(n); 7 assign a to w; VI. EVALUATION A. Experimental Setup
To evaluate the impact of our strategies over the application throughput and average processing latency, we performed several benchmarks comparing the Even, RAS, OPW and IQ schedulers. The tests have been performed on the Grid5000 testbed3, that allows us to reserve computing nodes in different clusters. For our tests, we mainly used two clusters: the first one, suno, is located in the Sophia region and its node have two 4-cores Intel Xeon E5520 @2.27GHz with 32GB of memory. The second one, parapide, is in the Rennes region and offers nodes with Intel Xeon X5570 @2.93GHz and 24GB of memory. Inside a cluster all nodes are interconnected with 1Gbps links. The two sites are 850km apart and connected with a 10 Gbps dark fiber with a measured latency of 21ms.
Based on the evaluation cluster adopted by [1], we deployed Storm 1.2.1 over 17 nodes: the Nimbus and the Zookeeper server are co-placed in one node, the remaining 16 nodes host the Supervisors. Each Supervisor consists of 20 available slots with a maximum memory heap of 1024MB each. For the RAS, OPW and IQ schedulers, the resources configurations in each node are of 800 cpu units (two 4-cores cpus) and 32768MB (resp. 24576MB) of memory for suno (resp. parapide).
Based on the scenario previously described in Section IV, where we find a cpu overload problem in Storm applications, we focus our benchmarking on a CPU intensive application. Word Count (Fig. 8) is a canonical representative of this family of applications, used likewise in the BigDataBench suite [32] as a representative of social network analytics. Its
Spout Bolt Fi el ds G ro up in g Al l Gr ou pi ng
Word Generator Counter Ranker Merger
Fi el ds G ro up in g
Fig. 8: Simple streaming Word Count topology topology consists of four components. The Word Generators (i.e. the spouts), continuously inject in the topology random tuples obtained from a set of 1000 predefined words. The Count bolts receive the generated words as input, through a hash-based fieldsGrouping connection, and produce pairs word, counter as output, where counter is an incremental counter of the word’s occurrences. The Rankers receive these pairs as input, also through a fieldGrouping connection, and provide the ranking of the three most frequent words every two seconds. The final step is accomplished by the Merger. It is a single executor to which the Rankers connect through a globalGrouping. It receives the rankings from all the previous bolts and outputs the overall top three most frequent words.
We set the resources requirements for the ackers as ex-plained in Section V, and adjust the pending tuples value, max.spout.pending(see Section III-B), to 5000. Acking is enabled for every bolt. All components have the same resource requirements in each tests.
B. Methodology
To perform a comprehensive evaluation, we test the topol-ogy with two different levels of parallelism and with diverse resource requirements. Based over past works, [1], [33] and only considering the topology components, i.e. excluding the system executors, we define a large topology with a total of 376 executors, and a small topology with a total of 26 executors . The large topology features 75 word generators, 150 counters, 150 rankers and 1 merger. The small topology is configured with 5 word generators, 10 counters, 10 rankers
and 1 merger. We tune the different resources requirements to generate various scenarios and to better compare the four scheduling strategies.
We first benchmarked the application in a single cluster scenario, where the CPU limitation is more visible. Then, we moved to a multi-cluster scenario, so as to add a slower link that can impact the application latency.
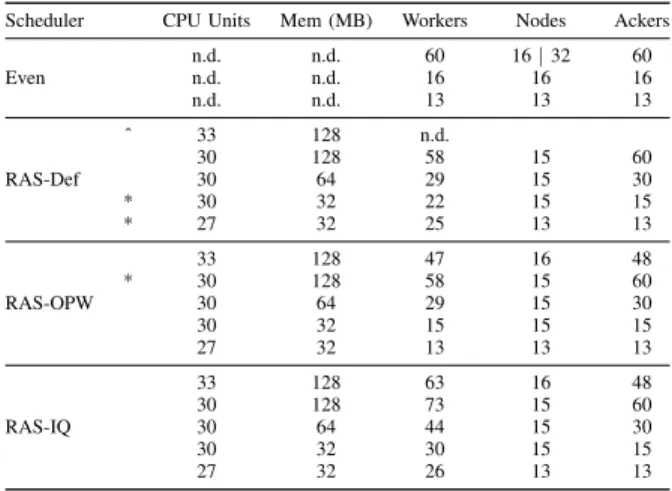
1) Large topology: The large topology has been investi-gated with several configurations (Table I) corresponding to different network distances between tasks. The Even scheduler has been tested with 13, 16 and 60 workers. Increasing the number of workers increases the number of used nodes, changing the communication distance between the executors. The RAS, OPW and IQ schedulers have been tested with 5 different variants. Starting from a requirement per component of 33 CPU units and 128MB, to spread the topology as much as possible in the single cluster, down to a requirement of 27 CPU units and 32MB of memory, to consider the effects of aggregating the tasks on a smaller number of nodes and workers.
Scheduler CPU Units Mem (MB) Workers Nodes Ackers
Even n.d. n.d. 60 16 | 32 60 n.d. n.d. 16 16 16 n.d. n.d. 13 13 13 RAS-Def ˆ 33 128 n.d. 30 128 58 15 60 30 64 29 15 30 * 30 32 22 15 15 * 27 32 25 13 13 RAS-OPW 33 128 47 16 48 * 30 128 58 15 60 30 64 29 15 30 30 32 15 15 15 27 32 13 13 13 RAS-IQ 33 128 63 16 48 30 128 73 15 60 30 64 44 15 30 30 32 30 15 15 27 32 26 13 13
(ˆ) not enough resources to schedule (*) out of memory crash TABLE I: Summary of tests run for the large topology. Total executors: 376 + ackers
2) Small topology: The small topology has been tested with a smaller set of configurations.
The Even scheduler has been tested with 16 and 13 workers. With 16 workers we are able to spread the tasks as much as possible over the available nodes, while with 13 workers, we can observe the effect of node sharing. With the RAS scheduler we have tested two different configurations. The first one maximizes the spreading of the topology. Since there is a total of 26 executors and 16 nodes with a capacity of 800 CPU units each, this can be achieved by requiring 400 CPU units for each component. This will result in 2 executors per node, which is the best achievable configuration given the number of available nodes. The second configuration places three executors per node by setting the CPU requirements to 265 units.
For the multi-cluster scenario, we added 15 nodes on the second cluster. The tests have been repeated with the same
Scheduler CPU Units Mem(MB) Workers Nodes Ackers Even n.d. n.d. 16 16 16 n.d. n.d. 13 13 13 RAS-Def 400 128 15 14 13 265 128 10 9 9 RAS-OPW 400 128 13 13 13 265 128 9 9 9 RAS-IQ 400 128 26 13 13 265 128 18 9 9
TABLE II: Summary of tests run for the small topology. Total executors: 26 + ackers
configurations used for the single-cluster case.
We focus our evaluation on two key data stream metrics: application throughput and processing latency. Throughput is obtained by summing the number of emitted tuples by every spout executor over the duration of the experiments. Latency is the average latency computed by Storm ackers. For a given tuple, it is the time between its registration at an acker and the completion of the acknowledgment tree. Hence it is a direct estimator of the end-to-end processing time. Every test has been run for 20 minutes and the first and last 5 minutes were excluded from measurement to account for the warm-up and shutdown phases. The results presented correspond to a steady state of the topology.
C. Results
1) Single Cluster, Large Topology: In this scenario, the Even scheduler (blue bars in Fig. 9) behaves as expected: in-creasing the number of workers increases throughput (Fig. 9a) but also processing latency (Fig. 9b). Indeed, increasing the number of workers while keeping the number of executors per node constant slightly increases the available memory for each executor. This results in more space available for the buffering queues. However, at the same time, a larger number of workers increases communication latency between executors in the same node, adding inter-worker communication.
In our experiments with the RAS scheduler, some config-urations would run out of memory and crash (missing values in Fig. 9a and Fig. 9b indicated by a cross). The only two working configurations were the ones with a requirement of 30 CPU units (CU) and with 128 and 64MB of required memory respectively. With a configuration of 33 CPU units per component, we don’t have enough space in the cluster to place all the components. Meanwhile, with the last two RAS configurations (30CU 32MB and 27CU 32MB), as well as the OPW strategy (30CU 128MB), we come across continuous memory dump crashes which prevents us from considering the results as valid. In all the failing scenarios, the cause is related to the acker executors. The recurring crashing JVMs are the ones containing only ackers, where we noticed that some ackers fill very quickly (in the first 10 seconds of run) the receiving queue and cause the worker to reach its memory heap limit.
Considering the only two valuable results (red bars in
60 Wrks16 Wrks13 Wrks
33CU 128MB30CU 128MB30CU 64MB30CU 32MB27CU 32MB33CU 128MB30CU 128MB30CU 64MB30CU 32MB27CU 32MB33CU 128MB30CU 128MB30CU 64MB30CU 32MB27CU 32MB
0 200 K 400 K 600 K 800 K 1.00 M 1.20 M 1.40 M 1.60 M Throughput (tuples/s)
even ras opw iq
(a) Throughput (higher is better)
60 Wrks16 Wrks13 Wrks
33CU 128MB30CU 128MB30CU 64MB30CU 32MB27CU 32MB33CU 128MB30CU 128MB30CU 64MB30CU 32MB27CU 32MB33CU 128MB30CU 128MB30CU 64MB30CU 32MB27CU 32MB
0 25 50 75 100 125 150 Latency (ms)
even ras opw iq
(b) Latency (lower is better)
Fig. 9: Results of the large-scale topology in the single cluster environment
Fig. 9), we can observe the importance of a correct resource requirements configuration. With 128MB of required memory, we have an average of 8 executors per node. This number dou-bles when we decrease the required memory down to 64MB. The placement in the first case results in 4 workers per node with 2 executors each, In the second case we have 2 workers per node with 4 executors each. Compared to the former case, we have a better distribution of ackers. This increases intra-worker communication, hence reducing communication latency by 82% and also improving the throughput by more than 115%. As we can see, the impact of placement in the first test (30CU 128MB in Fig. 9b) drastically increases the completion latency to over 300ms in average.
Both OPW (in green on Fig. 9) and IQ (in yellow) improve on the original RAS scheduler. Both strategies significantly improve the throughput, catching up with the Even scheduler performance.
Overall, while the OPW scheduler offers a good trade-off in terms of throughput and latency as compared to the RAS scheduler, the most meaningful improvements are observed with the IQ strategy. This is especially true in the last three configurations (30CU 64MB, 30CU 32MB, 27CU 32MB), which considerably improve the latency of the default RAS scheduler. At a similar throughput level, the IQ strategy reduces the latency by more than the 53% as compared to the RAS scheduler, and by the 33% w.r.t. the Even scheduler.
16 Wrks13 Wrks
400CU 128MB265CU 128MB400CU 128MB265CU 128MB400CU 128MB265CU 128MB
0 200 K 400 K 600 K 800 K 1.00 M 1.20 M 1.40 M Throughput (tuples/s)
even ras opw iq
(a) Throughput
16 Wrks13 Wrks
400CU 128MB265CU 128MB400CU 128MB265CU 128MB400CU 128MB265CU 128MB
0 2 4 6 8 Latency (ms)
even ras opw iq
(b) Latency
Fig. 10: Results of the small-scale topol-ogy in the single cluster environment
60 Wrks16 Wrks13 Wrks 0 500 K 1.00 M 1.50 M 2.00 M 2.50 M 3.00 M 3.50 M Throughput (tuples/s) even (a) Throughput 60 Wrks16 Wrks13 Wrks 0 20 40 60 80 Latency (ms) even (b) Latency
Fig. 11: Results of large-scale topology in the multi-cluster environment
16 Wrks13 Wrks
400CU 128MB265CU 128MB400CU 128MB265CU 128MB400CU 128MB265CU 128MB
0 200 K 400 K 600 K 800 K 1.00 M 1.20 M 1.40 M 1.60 M Throughput (tuples/s)
even ras opw iq
(a) Throughput
16 Wrks13 Wrks
400CU 128MB265CU 128MB400CU 128MB265CU 128MB400CU 128MB265CU 128MB
0 5 10 15 20 Latency (ms)
even ras opw iq
(b) Latency
Fig. 12: Results of the small-scale topol-ogy in the multi-cluster environment
In specific scenarios where latency is more relevant than throughput, we can, for the best configuration, reduce latency by 66%, at the cost of a 7% decrease of the throughput.
2) Single Cluster, Small Topology: Results with the small topology are presented in Fig. 10a and Fig. 10b for the throughput and latency respectively. We can observe that the Even schedulers performs very well in this scenario for both metrics. The RAS scheduler can achieve very good latency, but at the expense of a lower throughput in some cases. In addition, its performance varies in an unpredictable manner depending on the CPU and RAM requirements used for the tasks.
In contrast, the IQ and OPW schedulers achieve
stable performance irrespectively of the CPU and RAM requirements. They achieve performance on par with the Even scheduler, with slightly better results for OPW. A fair comparison between the OPW and Even schedulers can be done when both use the same number of physical nodes. As can be seen from Table II, this is the case when comparing the 13 workers case of the Even schedulers and the (400CU 128MB) case of the OPW scheduler. The performance are almost similar in terms of throughput and latency for the two schedulers in these two experiments.
Findings: overall, on a single cluster, our strategies improve the performances of the default RAS in all scenarios.
Moreover, in the worst case it is on par with the Even scheduler.
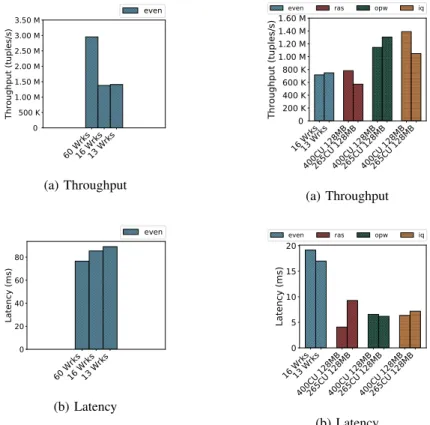
3) Multi Clusters, Large Topology: A key advantage of the RAS scheduler, and also IQ and OPW, in a multi-cluster scenario is that they will pack, as far as possible, the topology in a single cluster. This is the case for the large topology scenario and, as such, the results for the three resource aware schedulers are the same as in the single scenario (Fig. 9).
The Even scheduler, in contrast, is greedy and will deploy the topology over the two clusters, which causes the latency to ramp up from 6 to about 80 ms. But this can also lead to an increase in terms of throughput if it uses more physical nodes as is the case in the 60 workers scenario of Fig. 11a, where the throughput is almost double.
4) Multi Cluster, Small Topology: In this scenario, the Even scheduler clearly underperforms as compared to the resource aware schedulers, as it again deploys the topology over the two clusters. Also, the RAS scheduler again achieves less stable results than the IQ and OPW schedulers due to the balancing of the acking load they perform. This further enables them to improve throughput as compared to the original RAS scheduler while featuring similar latencies in this scenario.
Findings: our proposal improves on both default RAS and Even scheduler, when running on multiple clusters. The Even
scheduler can sometimes achieve better throughput at the cost of using twice as many nodes.
VII. CONCLUSION
In this work, we have demonstrated how implementing reliability in data stream systems can affect application per-formance if not done with care. This is especially true in acknowledgment-based systems, where the acking mechanism induces a significant processing and network load.
We exemplify the case with the Storm middleware, con-sidering its two standard schedulers, namely the Even and the Resource Aware Scheduler (RAS). The RAS scheduler was devised and is known to outperform the Even scheduler in a multi-cluster scenario. We have demonstrated that its relatively worse performance in single-cluster scenario is due to its handling of the ackers components. We have improved the RAS scheduler, with new ackers placement strategies — OPW and IQ — that enable it to perform at least as well as the Even scheduler in both scenarios with small or large topologies. This means that it is possible to design a single scheduler that offers consistent performance irrespectively of the exact scenario.
Our work focused on the acknowledgment mechanism, demonstrating its possible impact on application performance. However, DSP frameworks usually provide other mechanisms (logging, monitoring, etc) which also rely on system tasks. In the same manner, they can have an impact on the processing load. Thus, as future work, we intent to consider the non-functional tasks as part of the application during the scheduling process.
ACKNOWLEDGMENTS
Experiments presented in this paper were carried out using the Grid’5000 testbed, supported by a scientific interest group hosted by Inria and including CNRS, RENATER and several Universities as well as other organizations (see https://www. grid5000.fr).
The research leading to these results has received funding from the European Commissions Horizon 2020 Framework Programme for Research and Innovation (H2020), under grant agreement #732339: PrEstoCloud.
REFERENCES
[1] A. Toshniwal, S. Taneja, A. Shukla, K. Ramasamy, J. M. Patel, S. Kulka-rni, J. Jackson, K. Gade, M. Fu, J. Donham et al., “Storm@ twitter,” in ACM SIGMOD, 2014.
[2] S. Kulkarni, N. Bhagat, M. Fu, V. Kedigehalli, C. Kellogg, S. Mittal, J. M. Patel, K. Ramasamy, and S. Taneja, “Twitter heron: Stream processing at scale,” in ACM SIGMOD, 2015.
[3] P. Carbone, A. Katsifodimos, S. Ewen, V. Markl, S. Haridi, and K. Tzoumas, “Apache flink: Stream and batch processing in a single engine,” IEEE Data Eng. Bull., 2015.
[4] S. A. Noghabi, K. Paramasivam, Y. Pan, N. Ramesh, J. Bringhurst, I. Gupta, and R. H. Campbell, “Samza: stateful scalable stream pro-cessing at linkedin,” PVLDB, 2017.
[5] T. Akidau, A. Balikov, K. Bekiro˘glu, S. Chernyak, J. Haberman, R. Lax, S. McVeety, D. Mills, P. Nordstrom, and S. Whittle, “Millwheel: fault-tolerant stream processing at internet scale,” PVLDB, 2013.
[6] M. D. de Assuncao, A. da Silva Veith, and R. Buyya, “Distributed data stream processing and edge computing: A survey on resource elasticity and future directions,” Network and Computer Applications, 2018.
[7] S. Chintapalli, D. Dagit, B. Evans, R. Farivar, T. Graves, M. Holder-baugh, Z. Liu, K. Nusbaum, K. Patil, B. J. Peng et al., “Benchmarking streaming computation engines: Storm, flink and spark streaming,” in IEEE IPDPS, 2016.
[8] B. Peng, M. Hosseini, Z. Hong, R. Farivar, and R. Campbell, “R-storm: Resource-aware scheduling in storm,” in ACM Middleware, 2015. [9] G. Hesse and M. Lorenz, “Conceptual survey on data stream processing
systems,” in IEEE ICPADS, 2015.
[10] T. Akidau, R. Bradshaw, C. Chambers, S. Chernyak, R. J. Fern´andez-Moctezuma, R. Lax, S. McVeety, D. Mills, F. Perry, E. Schmidt et al., “The dataflow model: a practical approach to balancing correctness, latency, and cost in massive-scale, unbounded, out-of-order data pro-cessing,” PVLDB, 2015.
[11] Y. Zhuang, X. Wei, H. Li, Y. Wang, and X. He, “An optimal check-pointing model with online oci adjustment for stream processing appli-cations,” in IEEE ICCCN, 2018.
[12] L. Han, V. Le F`evre, L.-C. Canon, Y. Robert, and F. Vivien, “A generic approach to scheduling and checkpointing workflows,” in ACM ICPP, 2018.
[13] P. Carbone, G. F´ora, S. Ewen, S. Haridi, and K. Tzoumas, “Lightweight asynchronous snapshots for distributed dataflows,” CoRR, 2015. [14] T. Heinze, M. Zia, R. Krahn, Z. Jerzak, and C. Fetzer, “An adaptive
replication scheme for elastic data stream processing systems,” in ACM DEBS, 2015.
[15] V. Cardellini, V. Grassi, F. Lo Presti, and M. Nardelli, “Joint operator replication and placement optimization for distributed streaming appli-cations,” in EAI VALUETOOLS, 2017.
[16] ——, “Optimal operator replication and placement for distributed stream processing systems,” ACM SIGMETRICS, 2017.
[17] L. Su and Y. Zhou, “Tolerating correlated failures in massively parallel stream processing engines,” in IEEE ICDE, 2016.
[18] H. Li, J. Wu, Z. Jiang, X. Li, X. Wei, and Y. Zhuang, “Integrated recovery and task allocation for stream processing,” in IEEE IPCCC, 2017.
[19] H.-L. Li, J. Wu, Z. Jiang, X. Li, and X.-H. Wei, “A task allocation method for stream processing with recovery latency constraint,” Com-puter Science and Technology, 2018.
[20] W. A. Aljoby, T. Z. Fu, and R. T. Ma, “Impacts of task placement and bandwidth allocation on stream analytics,” in IEEE ICNP, 2017. [21] L. Aniello, R. Baldoni, and L. Querzoni, “Adaptive online scheduling
in storm,” in ACM DEBS, 2013.
[22] J. Xu, Z. Chen, J. Tang, and S. Su, “T-storm: Traffic-aware online scheduling in storm,” in IEEE ICDCS, 2014.
[23] V. Cardellini, V. Grassi, F. Lo Presti, and M. Nardelli, “Distributed qos-aware scheduling in storm,” in ACM DEBS, 2015.
[24] ——, “On qos-aware scheduling of data stream applications over fog computing infrastructures,” in IEEE ISCC, 2015.
[25] F. Bonomi, R. Milito, P. Natarajan, and J. Zhu, “Fog computing: A platform for internet of things and analytics,” in Big data and internet of things. Springer, 2014.
[26] L. Eskandari, Z. Huang, and D. Eyers, “P-scheduler: adaptive hierarchi-cal scheduling in apache storm,” in ACM ACSW, 2016.
[27] L. Eskandari, J. Mair, Z. Huang, and D. Eyers, “T3-scheduler: A topology and traffic aware two-level scheduler for stream processing systems in a heterogeneous cluster,” Future Generation Comp. Syst., 2018.
[28] P. Hunt, M. Konar, F. P. Junqueira, and B. Reed, “Zookeeper: Wait-free coordination for internet-scale systems.” in USENIX ATC, 2010. [29] Storm. Concepts. [Online]. Available: http://storm.apache.org/releases/
current/Concepts.html
[30] ——. Guaranteeing message processing. [Online]. Available: http: //storm.apache.org/releases/current/Guaranteeing-message-processing. html
[31] ——. Acking framework implementation. [Online]. Available: http: //storm.apache.org/releases/current/Acking-framework-implementation. html
[32] L. Wang, J. Zhan, C. Luo, Y. Zhu, Q. Yang, Y. He, W. Gao, Z. Jia, Y. Shi, S. Zhang et al., “Bigdatabench: A big data benchmark suite from internet services,” in IEEE HPCA, 2014.
[33] T. Li, Z. Xu, J. Tang, and Y. Wang, “Model-free control for distributed stream data processing using deep reinforcement learning,” PVLDB, 2018.