HAL Id: hal-00211883
https://hal.archives-ouvertes.fr/hal-00211883
Submitted on 22 Jan 2008HAL is a multi-disciplinary open access archive for the deposit and dissemination of sci-entific research documents, whether they are pub-lished or not. The documents may come from teaching and research institutions in France or abroad, or from public or private research centers.
L’archive ouverte pluridisciplinaire HAL, est destinée au dépôt et à la diffusion de documents scientifiques de niveau recherche, publiés ou non, émanant des établissements d’enseignement et de recherche français ou étrangers, des laboratoires publics ou privés.
Respiratory metabolism of illuminated leaves depends
on CO2 and O2 conditions.
Guillaume Tcherkez, Richard Bligny, Elizabeth Gout, Aline Mahé, Michael
Hodges, Gabriel Cornic
To cite this version:
Guillaume Tcherkez, Richard Bligny, Elizabeth Gout, Aline Mahé, Michael Hodges, et al.. Respiratory metabolism of illuminated leaves depends on CO2 and O2 conditions.. Proceedings of the National Academy of Sciences of the United States of America , National Academy of Sciences, 2008, 105 (2), pp.797-802. �10.1073/pnas.0708947105�. �hal-00211883�
This manuscript has been published in PNAS (Proceedings of the National
Academy of Sciences USA) Vol.105(2): 797-802 (2008)
Classification: Biological sciences/Plant biology
Respiratory metabolism of illuminated leaves depends on CO2- and O2-conditions Guillaume Tcherkez1,2,*, Richard Bligny3, Elizabeth Gout3, Aline Mahé4, Michael Hodges4 & Gabriel Cornic2.
1. Plateforme Métabolisme-Métabolome IFR87, Bâtiment 630, Université Paris-Sud XI, 91405 Orsay cedex, France.
2. Département d'Ecophysiologie Végétale, Laboratoire Ecologie Systématique Evolution, CNRS UMR8079, Batiment 362, Université Paris-Sud XI, 91405 Orsay cedex, France. 3. Laboratoire de Physiologie Cellulaire Végétale, CNRS UMR5168, CEA-Grenoble, 17, rue des Martyrs, 38054 Grenoble cedex 09, France.
4. Institut de Biotechnologie des Plantes, CNRS UMR8618, Bâtiment 630, Université Paris-Sud XI, 91405 Orsay cedex, France.
* Corresponding author.
Corresponding author: Dr Guillaume Tcherkez Postmail address:
Département d'Ecophysiologie Végétale ESE CNRS UMR8079
Batiment 362
Université Paris-Sud XI 91405 Orsay cedex, France.
E-mail: guillaume.tcherkez@u-psud.fr Fax: +33 1 69 15 72 38
Manuscript information: Total number of text pages: 21 Number of figures: 5
Number of tables: 3 (Supporting Information)
Number of words/characters (all included except Supporting Information): 6,227/39,838 Abbreviations: DHAP, dihydroxyacetone phosphate; Fd-GOGAT, ferredoxin-dependent glutamine-2-oxoglutarate aminotransferase; Fum, fumarate; Mal, malate; NMR, nuclear magnetic resonance; PDH, pyruvate dehydrogenase complex; PEPC, phosphoenolpyruvate carboxylase; Pyr, pyruvate; Succ, succinate; TCA, tricarboxylic acid.
Abstract 1
2
Day respiration is the process by which non-photorespiratory CO2 is produced by illuminated 3
leaves. The biological function of day respiratory metabolism is a major conundrum of plant 4
photosynthesis research: since the rate of CO2-evolution is partly inhibited in the light, it is 5
viewed as either detrimental to plant carbon balance or necessary for photosynthesis operation 6
(e.g. in providing cytoplasmic ATP for sucrose synthesis). Systematic variations in day 7
respiration rate under contrasting environmental conditions have been used to elucidate the 8
metabolic rationale of respiration in the light. Using isotopic techniques, we show that both 9
glycolysis and the TCA cycle activities are inversely related to the ambient CO2/O2 ratio: day 10
respiratory metabolism is enhanced under high photorespiratory (low-CO2) conditions. Such a 11
relationship also correlates with the DHAP/Glc-6-P ratio, suggesting that photosynthetic 12
products exert a control on day respiration. Thus, day respiration is normally inhibited by 13
phosphoryl (ATP/ADP) and reductive (NADH/NAD) poise, but up-regulated by 14
photorespiration. Such an effect may be related to the need for NH2-transfers during the 15
recovery of photorespiratory cycle intermediates. 16
17 18 19 20
Introduction 1
2
It is now seventy years since Krebs and Johnson proposed the mechanism by which pyruvic 3
acid is oxidised to CO2, and now called the ‘Krebs cycle’ or TCA cycle (1,2). While the 4
basics of the metabolic reactions involved in leaf respiration are known, intense efforts are 5
still currently devoted to elucidating the regulation of the TCA cycle (and, more generally, of 6
day respiration) in illuminated leaves (for a recent review, see ref. 3). 7
Leaf day respiration (non-photorespiratory CO2 evolution in the light) is an essential 8
metabolic pathway that accompanies photosynthetic CO2 assimilation and photorespiration. It 9
is widely accepted that leaf respiration is partly inhibited in the light when compared to 10
darkness (4). This acceptance is based on several strong lines of evidence, ranging from gas-11
exchange to molecular studies (for a review, see ref. 4): (i) the inhibition is thought to cause 12
the light-enhanced dark respiration (5); (ii) the pyruvate dehydrogenase (PDH) is down-13
regulated in the light (6,7); (iii) the metabolic flux through the TCA cycle in the light is 14
reduced in both extracted mitochondria (8) and intact leaves (9,10); (iv) mitochondria 15
experience high ATP/ADP and NADH/NAD+ ratios in the light that inhibit NAD-dependent 16
isocitrate dehydrogenase (11); and (v) carbohydrate molecules such as sucrose and glucose 17
are prevented from entering glycolysis (9), due to a modification of phosphofructokinase 18
activity by the allosteric effector Fru-2,6-bisphosphate (12). Nevertheless, not all leaf cells are 19
photosynthetic (e.g. most epidermal cells, phloem and xylem) so that some 'heterotrophic' 20
background respiration in the light is expected, but its contribution is minor. 21
Although inhibited by light, day respiration is critical for plant growth and leaf N 22
assimilation, as it provides ATP for Suc synthesis and TCA cycle intermediates (e.g. 2-23
oxoglutarate and oxaloacetate) for ammonium assimilation and amino-acid synthesis (13). 24
Thus for many years, the down-regulation of day respiration and of the TCA-cycle in the light 25
has been viewed as a perplexing phenomenon. It may be argued that the partial inhibition of 26
day respiration comes from a balance between two metabolic constraints: the energy 1
requirement for Suc synthesis and the minimal competition between glycolysis and Suc 2
synthesis for improved carbon gain. However, day respiration is additionally affected by other 3
metabolic processes such as O2 assimilation (photorespiration) (14), the rate of which depends 4
on the internal CO2/O2 ratio. The photorespiratory cycle leads to Gly oxidative 5
decarboxylation in the mitochondrion that supposedly gives rise to a large NADH/NAD+ 6
ratio, that in turn inhibits certain respiratory mitochondrial enzymes in vivo (11). 7
Photorespiration is thus assumed to down-regulate day respiratory CO2-evolution. 8
Nevertheless, increased photorespiration rates could require more Glu cycling to provide 9
amino groups for Gly synthesis in the peroxisomes. This higher demand might in turn require 10
an increase in 2-oxoglutarate and Glu synthesis, and thus a higher day respiratory rate. The 11
rationale of the metabolic homeostasis between day respiration and photorespiration are 12
therefore currently uncertain. 13
To clarify the regulation of day respiration in illuminated leaves and its interactions 14
with photorespiration, we have investigated the effect of the carboxylation-to-oxygenation 15
ratio on day respiratory metabolic fluxes using isotopic 12C/13C spectrometry and 13C and 31P 16
nuclear magnetic resonance (NMR). The results presented in this paper show that, while 17
respiratory CO2 evolution is always inhibited in the light when compared to the dark, the 18
metabolic flux associated with the TCA cycle is inversely related to net CO2 assimilation and 19
this correlates with changes in phosphorylated metabolites levels. In addition, 13C-distribution 20
after labeling shows a larger commitment towards TCA intermediates and Glu as 21
photorespiration increases. These findings, which are consistent with a role of day respiration 22
in sustaining photorespiratory N cycling and perhaps nitrate assimilation, have important 23
implications, ranging from the improvement of nitrogen use efficiency to the understanding of 24
leaf and global ecosystem carbon budgets. 25
1
Results 2
In order to determine the amplitude and the steps of the leaf respiratory pathway that are 3
inhibited in the light, detached leaves were fed with positionally labeled 13C-enriched 4
substrates (Pyr or Glc) and decarboxylation rates were measured by gas-exchange coupled to 5
isotopic spectrometry. This method allowed us to calculate the decarboxylation rate in the 6
light and, by comparing with the rate in darkness, the inhibition of decarboxylation in 7
illuminated leaves. The positional labeling in Pyr allowed us to discriminate between the CO2 8
produced by either the PDH (13C-1-Pyr, 13C-3-Glc) or the TCA cycle (13C-2-Pyr, 13C-1-Glc). 9
10
TCA-mediated decarboxylations are enhanced under low CO2/O2 11
When leaves were fed with 13C-enriched Pyr, the apparent carbon isotope discrimination ∆obs 12
increased, showing that 13CO2 was produced (Fig. 1A). Interestingly, the decarboxylation of 13
13
C-2-Pyr was low compared to that of 13C-1-Pyr, showing the predominance of CO2 14
produced by PDH as opposed to that produced by the TCA cycle. In addition, the smaller the 15
CO2/O2 ratio, the larger the ∆obs associated with 13C-1-Pyr. A similar but modest trend 16
occurred with 13C-2-Pyr (Fig. 1A). 17
Dark-respired CO2 was 13C-enriched compared to the natural abundance (δ13C of – 18
22.1±0.5‰) with both 13C-1- and 13C-2-Pyr, indicating that decarboxylation of Pyr was 19
substantial (Fig. 1B). The decarboxylation of 13C-1-Pyr in the dark was larger after a light 20
period at low CO2 (140 µL L-1) compared to a high CO2. Both 13C-1- and 13C-2-Pyr were 21
more decarboxylated in the dark after leaves had been exposed to light under low-O2 22
conditions (Fig. 1B), and this was sensitive to O2-conditions in the dark. 23
The isotopic data shown in Figure 1 were used to calculate the decarboxylation rates 24
(Fig. 2) associated with PDH and the TCA cycle using mass-balance equations (see Materials 25
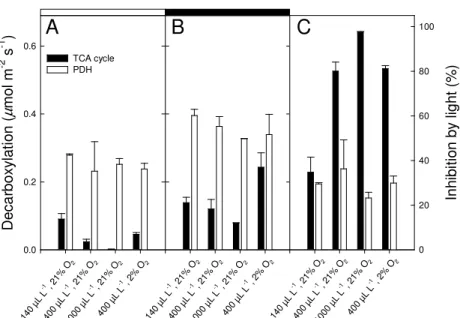
and Methods). While the decarboxylation rate associated with PDH was inhibited by only 1
30% in the light (Fig. 2), TCA cycle-mediated decarboxylations were much lower in the light 2
than in the dark, with an inhibition of around 80% under typical atmospheric conditions (400 3
µL L-1 CO2 in 21% O2). The inhibition of the PDH-mediated decarboxylation was relatively 4
constant under the CO2 and O2 conditions investigated. In contrast, TCA-mediated 5
decarboxylations were much more sensitive to low CO2 conditions, with 35% inhibition only 6
at 140 µL L-1 CO2 in 21% O2 (Fig. 2C). It should be noted that while the inhibition value 7
associated with the TCA cycle was similar in 400 µL L-1 CO2 2% O2 and in 400 µL L-1 CO2 8
21% O2, the absolute decarboxylation value was larger in 2% O2 both in the dark and in the 9
light (Fig. 2). This effect was due to a higher stomatal conductance in 2% O2 and 10
subsequently, larger transpiration rates that induced a higher absorption of labeled compounds 11
(data not shown). Such a positive effect of low O2 conditions on stomatal conductance has 12
already been observed in Xanthium strumarium (15). 13
14
The commitment to glycolysis is enhanced under low CO2/O2 15
Similar experiments were carried out with 13C-enriched Glc to determine whether the 16
glycolytic carbon flow changes under varying CO2/O2 conditions. Under typical conditions 17
(400 µL L-1 CO2 in 21% O2), leaves fed with 13C-1-Glc or 13C-3-Glc did not produce 18
significant amounts of 13CO2 in the light, as indicated by the very small deviation of the 19
apparent carbon isotope discrimination ∆obs (Table S1 of the Supporting Information). The 20
same applied to high CO2-to-O2 conditions (1000 µL L-1 CO2 in 21% O2), with a ∆obs value of 21
24.5±0.5‰. In contrast, the decarboxylation of 13C-1-Glc and 13C-3-Glc became apparent in 22
the light under low CO2 conditions (140 µL L-1 in 21% O2), with ∆obs values increasing up to 23
106.4±13.8‰ (with 13C-3-Glc, Table S1). This indicated that 13C-Glc could be oxidised in the 24
light by glycolysis and that PDH and TCA activities were both at the origin of the respired 25
13
CO2 from 13C-Glc. It should be noted that this increase was not an artefact caused by the 1
low CO2 mole fraction in the chamber (making decarboxylated CO2 proportionally larger), 2
because the CO2 mole fraction was taken into account in the mass-balance-based calculations. 3
In darkness, the δ13C value of respired CO2 increased to 365‰ (with 13C-3-Glc) after 4
photosynthesis at 400 µL L-1 CO2, and 719‰ (with 13
C-3-Glc) after photosynthesis at 140 µL 5
L-1 CO2 in 21% O2 (Table S1). When these values were used to calculate decarboxylation 6
values, it was found that both TCA- and PDH-mediated decarboxylations were inhibited by 7
nearly 90% at 400 µL L-1 CO2, and 60% at 140 µL L-1 CO2 in the light (Table S2 of the 8
Supporting Information). These data show that leaf CO2 levels modulate the entry of Glc 9
molecules into the glycolytic and respiratory pathways both in the light and the dark; Glc is a 10
better respiratory substrate at low CO2 levels. 11
12
Distributionof the 13C-label in metabolites 13
To gain information on the changes in metabolic pathways under the different CO2/O2 14
conditions in the light, the fate of the 13C-atoms (from 13C-substrate feeding) was determined 15
in leaf metabolites by 13C-NMR analyses. Leaves were fed with positionally-enriched (99% 16
13
C) substrates under either 140, 400, or 1000 µL L-1 CO2 in 21% O2 and the positional 17
isotopic abundances of identified metabolites (in % of 13C), measured by NMR, are displayed 18
as an isotopomics array (Fig. 3). As expected, hexoses and Glc- or Fru-moieties of Suc were 19
13
C-labeled when 13C-Glc was supplied to leaves so that several C-1 and C-6 positions formed 20
clusters (these positions are redistributed by aldolase and triose-phosphates isomerase 21
reactions). The C-4 and C-5 positions in hexoses clustered near to the C-3 positions, 22
indicating that a redistribution of 13C label occurred in the light through the pentose-23
phosphate pathway. 24
The flux through the pentose-phosphate cycle may be estimated with both NMR and 1
gas-exchange data. At 140 µL L-1 CO2, the 13C-amount in the C-atom positions redistributed 2
by the pentose-phosphate cycle (i.e. the 13C-amount in C-2, C-3, C-4 and C-5 after 13C-1-Glc 3
labeling and the 13C-amount in C-1, C-2, C-5 and C-6 after 13C-3-Glc labeling), as found by 4
NMR after labeling, corresponds to a 13C flux of 0.03 µmol m-2 s-1. With the gas-exchange 5
data, the flux through the pentose-phosphate cycle can be estimated by the excess of 6
calculated CO2 production from the TCA with respect to the PDH, because the pentose-7
phosphate cycle involves the decarboxylation of the C-1 atom of Glc. With 13C-1-Glc 8
labeling, The TCA-mediated decarboxylation rate was 0.11 µmol m-2 s-1 while the PDH-9
mediated decarboxylation was 0.07 µmol m-2 s-1 (Table S2 of the Supporting information). 10
The CO2 production by the pentose-phosphate cycle was thus of 0.04 µmol m-2 s-1, a value 11
that is very close to that obtained with NMR. Such a value is nevertheless not enough to 12
explain the entire 13CO2 production from 13C-Glc at low CO2, so that the enhancement of the 13
commitment to glycolysis still holds under this condition. 14
The commitment to the TCA cycle can be assessed with 13C-labeling in organic acids. 15
Some organic- and amino-acids clustered on the upper part of Fig. 3, with positional 13 C-16
enrichment generally lower than 10%. However, the C-2 atom of malate and the C-2 and C-3 17
atoms of Glu were clearly labeled when 13C-Pyr was supplied. This labeling was lower at high 18
CO2, and the same applied to the C-2 and C-3 atoms of fumarate. Since these C-atom 19
positions in malate, Glu and fumarate can only be labeled by the interplay (redistribution) of 20
the TCA cycle, this labeling trend is indicative of an increase in TCA cycle activity. This 21
view agrees with the increase of the 13C-abundance in Glu, succinate and fumarate from high 22
to low CO2/O2 ratios as shown in Fig. 4 (where 13C-abundances are relative to those found in 23
malate in order to take into account variations in refixed decarboxylated 13CO2 by 24
phosphoenolpyruvate carboxylase (PEPC) activity, as discussed below). 25
Nevertheless, the lower 13C-abundance in organic acids under high CO2 conditions 1
may also partly be due to the diluting effect of assimilated 12C-enriched carbon (inlet CO2 has 2
a δ13C value near to –50‰). This effect is expected in malate and fumarate, which are two 3
major metabolites accumulated by Xanthium leaves. There was indeed a significant and 4
negative correlation between the isotopic enrichment in fumarate C-2/3 and malate C-2 and 5
the quantity of these organic acids (Fig. 4, inset). However, the correlation was reversed in the 6
case of Glu C-2 (Fig. 4, inset) while there was no correlation at all with other organic acids or 7
amino-acids (data not shown). Therefore, we conclude that the lower 13C-enrichment in 8
organic- and amino-acids at high CO2 conditions was not only caused by an isotopic dilution 9
but also by the decrease of the commitment of 13C-Pyr to the TCA cycle. 10
11 13
CO2 refixation 12
While the trend of 13C-labeling in TCA cycle intermediates is clear, the rate of 13
decarboxylation of 13C-enriched substrates in the light and the 13C-labeling of different 14
metabolites may have been adulterated by 13CO2 refixation by either PEPC or Rubisco. 15
Indeed, 13CO2 fixation by PEPC occurred under each CO2 condition investigated in the 16
present study, as revealed by the 13C-enrichment in the C-4 of malate when 13C-1-Pyr or 13 C-17
2-Pyr was supplied to leaves. However, the C-2 and C-3 positions in malate were also clearly 18
13
C-enriched under low CO2 conditions when fed with 13C-2-Pyr (Fig. 3), and this observation 19
is consistent with an increased TCA cycle activity. 20
Metabolites could have been also 13C-labeled via photosynthetic 13CO2 refixation. The 21
labeling of hexoses and Suc in the C-3 position after Pyr feeding (refixation of 13CO2 22
decarboxylated from 13C-1-Pyr by Rubisco) did occur but the maximum positional 13 C-23
abundance in C-3 indicates that the proportion of refixed 13C in the whole molecule was about 24
0.7% only. Refixation of respired CO2 into starch was also assessed after gas-exchange and 25
on-line apparent ∆obs measurements (Fig. 1): the carbon isotope composition (δ13C) of starch 1
was between –36.5 (minimum value obtained at 1000 µL L-1 CO2, with 13C-1-Pyr feeding) 2
and –12.7‰ (maximum value obtained at 140 µL L-1 CO2 with 13C-1-Pyr feeding), indicating 3
that the proportion of starch containing refixed CO2 was between 0 and 0.4% only (see Table 4
S3 of the Supporting Information). Therefore, although Rubisco-mediated refixation of 5
decarboxylated 13CO2 did occur, it was always very low. 6
7
Correlations with phosphorylated metabolites 8
Phosphorylated metabolites, such as dihydroxyacetone phosphate (DHAP), are known to be 9
important regulators of the primary carbon metabolism of plant leaves (12,16). Therefore, we 10
measured the amounts of phosphorylated compounds by 31P-NMR spectroscopy on the same 11
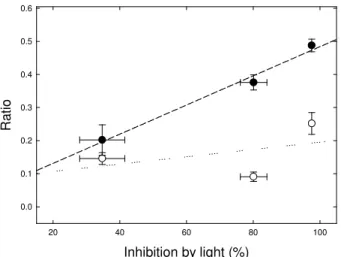
samples used for the 13C-labeling and 13C-NMR analyses. There was a clear linear and 12
positive correlation between the activity of the TCA cycle, as witnessed by gas-exchange 13
(values from Fig. 2), and the DHAP-to-Glc-6-phosphate ratio (Fig. 5, dashed line). In 14
contrast, there was no statistically significant correlation with the DHAP/Pi ratio although a 15
positive trend was apparent (Fig. 5, dotted line). 16
17
Discussion 18
19
Based on data from gas-exchange analyses to enzymatic activities (6,7,8,9), it has become 20
widely accepted that leaf day respiration (non photorespiratory CO2 evolution in the light) is 21
inhibited in the light (for a review, see 3). However, the rationale and the effect of 22
environmental conditions on day respiration and its inhibition are uncertain and solving such 23
an issue is critical to understand how leaves adapt carbon partitioning between export of 24
photosynthates and respiration or N economy under varying natural conditions. CO2 and O2 25
levels are two parameters of fundamental importance because the leaf internal CO2/O2 ratio 26
changes when environmental conditions alter stomatal closure (e.g. drought). Here, we have 1
developed isotopic methods to provide evidence that respiratory metabolism is up-regulated 2
when the CO2/O2 ratio decreases, and we argue that day respiration is an exquisite example of 3
metabolic compromise between feedback inhibition by NADH and ATP, and 2-oxoglutarate 4
precursor requirement for N metabolism. 5
6
The regulation of the TCA cycle 7
While no major effect on PDH-decarboxylation was observed, the carbon flow through the 8
TCA cycle increased under low CO2/O2 conditions, as evidenced by the larger 9
decarboxylation rate of 13C-2-Pyr, so that the inhibition by light of the TCA cycle was 40% at 10
140 µL L-1 CO2 as compared to nearly 90% under typical conditions (400 µL L-1 CO2, Figs.1 11
and 2). Furthermore, the 13C-labeling of succinate, citrate and Glu, as revealed by NMR 12
tracing after 13C-2-Pyr feeding, increased as the CO2 mole fraction decreased (Fig. 4). In this 13
context, the observed labeling in malate (Fig. 3), that indicated the simultaneous increase in 14
PEPC activity, comes as no surprise: this is in agreement with the anapleurotic role of this 15
enzyme, that compensates for 2-oxoglutarate consumption (for Glu synthesis) by feeding the 16
TCA cycling with oxaloacetate molecules (17). The whole picture is thus consistent with an 17
increased commitment to the TCA cycle and Glu production under low CO2 conditions. 18
The up-regulation of the TCA metabolism under low CO2 stems from a larger 19
glycolytic carbon input, as evidenced by the enhancement of 13C-3-Glc decarboxylation (see 20
the Result section and Table S1 and S2) and the slight 13C-labeling in malate C-2 after 13 C-21
Glc feeding (Fig. 3). In addition, as a consequence of the lower photosynthetic CO2 fixation 22
rate, the DHAP/Glc-6-P ratio decreased with CO2 mole fraction, and importantly, this ratio 23
was strongly correlated with the inhibition of the TCA cycle (Fig. 5). The relative abundance 24
of triose phosphates is already known to be a metabolic parameter that controls carbon entry 25
to glycolysis by the interplay of the effector Fru-2,6-bisphosphate (12), and promotes 1
pyruvate kinase activity (18). It thus appears clear that it also controls the commitment of 2
carbon molecules to the respiratory pathway. Uncertainty nevertheless remains about whether 3
it acts indirectly on the TCA cycle (through the enhancement of glycolysis) or not. 4
5
Interactions with photorespiration 6
The higher carbon flow through the TCA cycle under low CO2 may appear somewhat 7
paradoxical as it has often been supposed that large photorespiratory rates inhibit 8
mitochondrial respiratory enzymes (11,19), such as the NAD-dependent isocitrate 9
dehydrogenase (11). Accordingly, Gly decarboxylase antisense lines of potato (Solanum 10
tuberosum) have lower decarboxylation rates in the light (as revealed by 14C-labeling 11
experiments) and the ATP/ADP as well as the NADH/NAD+ ratios are both higher than in the 12
wild type (20). In addition, the predominance of NADH production by Gly oxidation over that 13
by the TCA cycle has been shown using isolated mitochondria under ADP-limiting conditions 14
(21). This might reduce the NAD+ available for the mitochondrial dehydrogenase steps of the 15
TCA cycle. Our results show that the inhibition of day respiration occurs whatever the 16
CO2/O2 ratio and furthermore, there is a lower inhibition value under very low-O2 conditions 17
(400 µL L-1 CO2, 2% O2) as compared to high-CO2 conditions (1000 µL L-1 CO2, 21% O2) 18
(Fig. 2). This would be consistent with a much reduced mitochondrial redox poise caused by 19
the non-physiological, very low oxygen mole fraction. 20
However, we show here that the inhibition of the TCA cycle is relaxed under low-21
CO2 conditions in 21% O2 (see above). Isocitrate production is probably not influenced by 22
such photorespiratory conditions, as citrate synthase remains active because of the very large 23
Ki(ATP) (5 mmol L-1) and the absence of any NADH effect (22). As the mitochondrial NAD-24
dependent isocitrate dehydrogenase is believed to be inhibited in the light, we suggest that 25
isocitrate is processed by the cytosolic or mitochondrial NADP-dependent isocitrate 1
dehydrogenase (23). This bypass would allow to sustain the necessary Glu flow under 2 photorespiratory conditions. 3 4 Possible rationale 5
The regulation of the TCA cycle by the CO2/O2 conditions may be viewed as a side effect of 6
the drop in the DHAP relative quantity on the commitment to glycolysis and therefore 7
respiration (see above and Fig. 5). Unless there are other prevailing imperatives (such as the 8
need of NADH to reduce photorespiration-derived hydroxypyruvate or H2O2), it also reflects 9
an increased need for Glu to feed photorespiratory N-recycling when conditions shift to low 10
CO2 mole fractions, simply because the production of Gly from glycolate would require a 11
higher Glu flow. Unsurprisingly then, the production of the Glu-precursor 2-oxoglutarate by 12
the TCA cycle is enhanced. The argument that photorespiration is beneficial for Glu synthesis 13
is in agreement with the positive correlation between photorespiration and leaf nitrate 14
reduction (24,25). This scenario is also consistent with the results obtained in the cytoplasmic 15
male sterile CMSII mutant of tobacco (affected in the mitochondrial respiratory complex I) in 16
which the day respiratory rate is similar or even higher than that of the wild type while both 17
photorespiration and N-metabolism (amino-acid synthesis) are enhanced (26,27). 18
Therefore, we argue that day respiratory homeostasis in leaves is likely to be the result 19
of a compromise between two opposing forces: (i) an inhibition of respiration and glycolysis 20
due to high mitochondrial NADH levels generated by photorespiration (Gly decarboxylation) 21
and elevated ATP/ADP and DHAP levels generated by photosynthetic activity; (ii) a 22
stimulation of the TCA cycle in order to adjust 2-oxoglutarate production to photorespiratory 23
Glu demand. Such a compromise should be very dynamic, adjusting to changes in 24
environmental conditions that modify stomatal closure, thereby altering leaf internal CO2/O2 25
balance. For example, water deficit, that leads to a low internal CO2 mole fraction, 1
presumably promotes day respiration and photorespiration. Therefore, in the summer months 2
the quantitative significance of these metabolic changes should be evident in many C3 crops 3
and natural vegetation. However, it is probable that such a promoting effect may disappear 4
on a long-term basis because of acclimation processes (28,29). Thus the extent to which the 5
regulation of day respiration by CO2 and O2 conditions scale up to crop productivity and 6
global carbon sequestration needs further experimental assessment. 7
8 9
Material and methods 10
Plant material 11
Cocklebur (Xanthium strumarium L., Asteraceae) plants were grown in the greenhouse from 12
seed in 100 mL pots of potting mix and transferred to 3 L pots after two weeks. Minimum 13
photosynthetic photon flux density during a 16-h photoperiod was kept at approximately 400 14
µmol m-2 s-1 by supplementary lighting. Temperature and vapor pressure deficit were 15
maintained at approximately 25.5/18.5oC and 1.4/1.2 kPa day/night, respectively. The carbon 16
isotope composition (δ13C) of CO2 in the greenhouse air was –9.5±0.3‰. The third or fourth 17
leaves (from the apical bud) were used for all measurements. 18
19
Gas exchange measurements 20
a- Closed system (dark respiration) 21
The respiration chamber was placed in a closed system, which was directly coupled to an 22
elemental analyser (EA) NA-1500 (Carlo-Erba, Milan) through a 15-mL loop, as described in 23
(30). After decarboxylating the system, respired CO2 was accumulated until it reached nearly 24
300 µL L-1. The loop was then shunted and the gas inside the loop was introduced into the EA 25
with helium for gas chromatography. The connection valve between the EA and the isotope 1
ratio mass spectrometer (VG Optima, Micromass, Villeurbanne, France) was opened when 2
the CO2 peak emerged from the EA. 3
4
b- Open system (photosynthesis and on-line carbon isotope discrimination) 5
The photosynthesis system has already been described in (9). Briefly, a purpose-built 6
assimilation chamber was connected in parallel to the sample air hose of the LI-6400 (Li-Cor 7
Inc., Lincoln, NE). Leaf temperature was controlled at 21oC with circulating water from a 8
cooling water bath to the jacket of the leaf chamber, and was measured with a copper-9
constantan thermocouple plugged to the thermocouple sensor connector of the LI-6400 10
chamber/IRGA. Inlet air was adjusted to ca. 10 mmol mol-1 H2O and passed through the 11
chamber at a rate of 30 L h-1, monitored by the LI-6400. Light (400 µmol m-2 s-1) was 12
supplied by a 500 W halogen lamp (Massive N. V., Kontich, Belgium). Inlet CO2 was 13
obtained from a gas cylinder (Alphagaz N48, Air Liquide, France) with a δ13C of – 14
50.2±0.2‰. The outlet air of the chamber was regularly shunted and was sent to the loop to 15
measure its 12C/13C isotope composition and thus the on-line carbon isotopic discrimination 16
(∆obs). The gas inside the loop was introduced into the EA for GC as described above. ∆obs 17
during photosynthesis was measured following the method described by ref. (31). Air with 18
2% oxygen was from a cylinder (Crystal gas mixture, Air Liquide, France). When light was 19
turned off, the leaf was immediately removed from the open system and one half was frozen 20
in liquid nitrogen. The other half (still attached to the peduncle) was placed in the closed 21
system for dark respiration measurements (see above). 22
Starch extraction 1
The protocol for starch extraction was similar to that described in (30). The frozen leaf 2
material was lyophilised and powdered. 50 mg of leaf powder was suspended with 1 mL of 3
distilled water in an Eppendorf tube (Eppendorf Scientific, Hamburg, Germany). After 4
centrifugation, the pellet was washed four times with 95% ethanol at room temperature and 5
starch was extracted by HCl solubilization and precipitated with cold methanol. After 6
lyophilisation, starch was transferred to tin capsules (Courtage Analyze Service, Mont Saint-7
Aignan, France) for isotope analysis. 8
9
NMR analyses 10
Leaves used for NMR spectroscopy were fed for 2 h at 21°C and 400 µmol m-2 s-1 with either 11
water (control), 12C-substrates or 13C-substrates in a large plexiglass chamber (surface area 12
450 cm²) connected in parallel to the sample air hose of the LI-6400 (Li-Cor Inc., Lincoln, 13
NE), allowing CO2 mole fraction monitoring. 14
NMR measurements were carried out as described in (9) and (32) from perchloric acid 15
extracts prepared from 5 g of frozen leaf material. Spectra were obtained using a Bruker 16
spectrometer (AMX 400) equipped with a 10-mm multinuclear probe tuned at 161.9 and 17
100.6 MHz for 31P- and 13C-NMR, respectively. The assignment of 13C resonance peaks was 18
carried out according to (33). Identified compounds were quantified from the area of their 19
resonance peaks using fully relaxed conditions for spectra acquisition (pulses at 20 s 20
intervals). Peak intensities werenormalized to a known amount of the reference compound 21
(maleate for 13C and methyl-phosphonate for 31P) that was added to the sample (internal 22
standard). 23
24 25
13
C-enriched molecules 1
The positional 13C-labeled molecules (99% 13C in the considered position) were purchased 2
from Eurisotop (Saclay, France). Pyruvate was dissolved in distilled water and the pH was 3
adjusted to 6.7 with NaOH. To obtain non-fully labeled solutions (∆obs experiments), the 4
labeled compounds were mixed with industrial glucose (δ13C = −9‰) or pyruvate 5
(δ13C = −21‰) from Sigma. The resulting overall composition of glucose and pyruvate 6
solutions was checked to be 2500‰ and 1400‰, respectively. In each case, the final 7
concentration was 0.015 mol L-1. The solutions were fed to the leaves through the 8 transpiration stream. 9 10 11 12 Calculations 13
The procedure used to calculate the decarboxylation rates of 13C-enriched substrates in the 14
light from apparent ∆obs values has already been explained in detail (9). Briefly, the difference 15
between apparent ∆obs values obtained with and without substrate addition is considered to 16
reflect the additional decarboxylation flux in the light. Using mass balance equations, it can 17
be shown that the decarboxylation rate rday has the following form: 18 ( ) o o e e e o fixed day M s fixed c c c c d r SV λ λ λ λ λ − + − = ⋅ − 19
where d is the flow, S leaf surface area, VM the molar volume at air temperature, ce and co are 20
the CO2 mole fractions in inlet and outlet air, respectively. λ values are 13C percentages (using 21
delta-values is not possible because of large 13C-enrichments) in inlet CO2 (subscript e), outlet 22
CO2 (subscript o), net fixed CO2 (subscript fixed), and 13C-enriched added substrate (subscript 23
s). This equation holds for homogeneously labeled substrates; it is somewhat changed for 24
positional enrichments to take into account the different origin of decarboxylated CO2. This 1
occurs when glucose or pyruvate are added: the C-1 atom of pyruvate is decarboxylated by 2
PDH while the 2 and 3 positions are decarboxylated by the Krebs cycle. Similarly, the C-3
3 and C-4 atom positions of glucose are decarboxylated by the PDH reaction, the other being 4
decarboxylated by the Krebs cycle. Taking advantage of positionally 13C-enriched substrates: 5
13
C-1-pyruvate would specifically enrich the CO2 produced by PDH while 13C-2-pyruvate 6
would specifically enrich the CO2 that comes from the Krebs cycle. The same applies to 7
positional 13C-enrichment in glucose. It should be noted that, in contrast to the argument of 8
ref. (3), any isotopic dilution of the substrate is taken into account as the observed carbon 9
isotope discrimination is always a net value that integrates the decarboxylation of natural (that 10
is, not added) Pyr or Glc molecules, both before and after 13C-substrate addition. 11
A similar procedure applies to dark-respired CO2 measurements. In other words, CO2 12
that is produced in darkness (13C-percentage λglobal) after a light period with 13C-enriched 13
substrate feeding comes from respiratory oxidation of new photosynthates (the 13C-percentage 14
in the net fixed carbon is λfixed), photosynthates from the previous light period in the 15
greenhouse (13C-percentage λprevious), and additional C coming from the 13
C-enriched substrate 16
fed to the leaf (13C percentage λs). The night-decarboxylation rate has the following form: 17 global p night n s p r R λ λ λ λ − = ⋅ − 18
where λp is a linear combination of λprevious and λfixed. It is equal to 0.6 λprevious+ 0.4 λfixed after 19
2-3 h in the light under ordinary CO2/O2 conditions (during which 200-400 mmol C m-2 have 20
been fixed), and 0.5 λprevious + 0.5 λfixed after 2-3 h in the light under high CO2 conditions 21
(during which 400-800 mmol C m-2 have been fixed) (34). It should be noted that possible 22
variations in these coefficients do only introduce very slight errors in the estimate of the 13 C-23
enriched substrate decarboxylation rnight, because of the strong 13C-enrichment of the 24
substrate (that is, the λp value is always very small compared to λglobal or λs and may be 1
neglected). Again, that relationship is somewhat modified with positional enrichments to take 2
into account the different origin of decarboxylated CO2 (as described in 9). 3
4
Clustering analysis 5
The 13C-NMR data were represented as an isotopomic array as described in (35). The 6
positional isotopic abundances (in 13C-percentage) relative to the natural 13C-abundance 7
(1.1%) are indicated by colors so that black cells indicate near-natural abundance, green and 8
red cells indicate lower- and larger-than-natural 13C-abundance. The clustering analysis was 9
carried out with the Cluster software and the array is drawn using the TreeView software 10
(both are from M. Eisen, Standford University). 11
Acknowledgements. We thank the Institut Fédératif de Recherche 87 for its support through a Transversal Project grant. Dr G. Tcherkez wishes to thank Dr. Jean Vidal for valuable discussions on the manuscript.
References
1 Krebs, H. A. & Johnson, W. A. (1937) Biochem. J. 31, 645-660. 2 Krebs, H. A. & Johnson, W. A. (1937) Enzymologia 4, 148-156.
3 Nunes-Nesi, A., Sweetlove, L. J. & Fernie, A. R. (2007) Physiol. Plant. 129, 45-56. 4 Atkin, O. K., Millar, A. H., Gärdestrom, P. & Day, D. A. (2000) in Photosynthesis,
Physiology and Metabolism, eds Leegood, R. C., Sharkey, T. D. & von Caemmerer, S. (Kluwer Academic Publisher, London), pp. 203-220.
5 Cornic, G. (1973) Physiol. Vég. 11, 663-679.
6 Budde, R. J. A. & Randall, D. D. (1990) Proc. Natl. Acad. Sci. USA 87, 673-676. 7 Tovar-Mendez, A., Miernyk, J. A. & Randall, D. D. (2003) Eur. J. Biochem. 270,
1043-1049.
8 Hanning, I. & Heldt, H. W. (1993) Plant Physiol. 103, 1147-1154.
9 Tcherkez, G., Cornic, G., Bligny, R., Gout, E. & Ghashghaie, J. (2005) Plant Physiol. 138, 1596-1606.
10 McCashin, B. G., Cossins, E. A. & Canvin, D. T. (1988) Plant Physiol. 87, 155-161. 11 Igamberdiev, A. U. & Gardeström, P. (2003) Biochim. Biophys. Acta 1606, 117-125. 12 Plaxton, W. C. (1996) Annu. Rev. Plant Physiol. Plant Mol. Biol. 47, 185-214. 13 Tcherkez, G. & Hodges, M. (2007) J. Exp. Bot., in press.
14 Pinelli, P. & Loreto, F. (2003) J. Exp. Bot. 54, 1761-1769.
15 Messinger, S. M., Buckley, T. N. & Mott, K. A. (2006) Plant Physiol. 140, 771-778. 16 Stitt, M. (1990) Annu. Rev. Plant Physiol. Plant Mol. Biol. 41, 153-185.
17 Huppe, H. C. & Turpin, D. H. (1994) Annu. Rev. Plant Mol. Biol. Plant Physiol. 45, 577-607.
18 Lin, M., Turpin, D. H. & Plaxton, W. C. (1989) Arch. Biochem. Biophys. 269, 228-238.
19 Gardeström, P. & Wigge, B. (1988) Plant Physiol. 88, 69-76.
20 Bykova, N. V., Keerberg, O., Pärnik, T., Bauwe, H. & Gardeström, P. (2005) Planta 222, 130-140.
21 Day, D. D., Neuburger, M. & Douce, R. (1985) Aust. J. Plant Physiol. 12, 119-130. 22 Irendale, S. E. (1979) Phytochemistry 18, 1057-1058.
23 Chen, R. D. & Gadal, P. (1990) Plant Physiol. Biochem. 28, 141-145.
24 Rachmilevitch, S., Cousins, A. B. & Bloom, A. J. (2004) Proc. Nat. Acad. Sci. USA 101, 11506-11510.
25 Bloom, A. J., Smart, D. R., Nguyen, D. T. & Searles, P. S. (2002) Proc. Nat. Acad. Sci. USA 99, 1730-1735.
26 Priault, P., Tcherkez, G., Cornic, G., DePaepe, R., Naik, R., Ghashghaie, J. & Streb, P. (2006) J. Exp. Bot. 57, 3195-3207.
27 Dutilleul, C., Lelarge, C., Prioul, J. L., DePaepe, R., Foyer, C. H. & Noctor, G. (2005) Plant Physiol. 139, 64-78.
28 Thomas, R. B., Reid, C. D., Ybema, R. & Strain, B. R. (1993) Plant Cell Environ. 16, 539-546.
29 Shapiro, J. B., Griffin, K. L., Lewis, J. D. & Tissue, D. T. (2004) New Phytol. 162, 377-386.
30 Tcherkez, G., Nogués, S., Bleton, J., Cornic, G., Badeck, F. & Ghashghaie, J. (2003) Plant Physiol. 131, 237-244.
31 Evans, J. R., Sharkey, T. D., Berry, J. A. & Farquhar, G. D. (1986) Aust. J. Plant Physiol. 13, 281-292.
32 Aubert, S., Gout, E., Bligny, R., Marty-Mazars, D., Barrieu, F., Alabouvette, J., Marty, F. & Douce, R. (1996) J. Cell Biol. 133, 1251-1263.
33 Gout, E., Bligny, R., Pascal, N. & Douce, R. (1993) J. Biol. Chem. 286, 3986-3992. 34 Nogués, S., Tcherkez, G., Cornic, G. & Ghashghaie, J. (2004) Plant Physiol. 136,
3245-3254.
Figure 1. A, carbon isotope discrimination (∆obs) associated with photosynthesis of detached leaves (at 21°C and 400 µmol m-2 s-1 PPFD) fed with either 13C-1- or 13C-2-enriched Pyr under four CO2/O2 conditions: 140, 400 or 1000 µL L-1 CO2 in 21% O2, and 400 µL L-1 CO2 in 2% O2. B, carbon isotope composition (δ13C) of respired CO2 in darkness after the corresponding light periods. When leaves experienced a light period under 2% O2, the carbon isotope composition was measured in either 21% (indicated as '400 µL L-1, 2-21%') or 2% O2 (indicated as '400 µL L-1, 2-2%'). Each value is the mean±SE of three measurements. The control δ13C value of respired CO2 was –22.1±0.5‰.
Figure 2. Decarboxylation rates and inhibition of decarboxylation by light calculated from data of Fig. 1, using the method of ref. (9). The decarboxylation rates by PDH (white bars) and the TCA cycle (black bars) are given in the light (panel A, denoted as rlight just below) and in the dark (panel B, denoted as rnight just below). Inhibition by light (calculated as 1 – rlight/rnight, in %) is indicated on panel C. Conditions experienced by leaves during the light period are indicated on the x axis as in Fig. 1: 140, 400 and 1000 µL L-1 CO2 in 21% O2 and 400 µL L-1 CO2 in 2% O2. The δ13C values of dark-respired CO2 obtained in 2% O2 (Fig. 1B right bars) were used to calculate the inhibition value after a light period in 2% O2.
Figure 3. Isotopomics array representation of 13C-abundance in the carbon atom positions of major metabolites in detached leaves incubated with 13C-substrates for 2 h at 21°C, 21% O2 and 400 µmol m-2 s-1 PPFD. CO2 mole fraction was 140 µL L-1, 400 µL L-1, and 1000 µL L-1. At t = 2 h, leaves were immediately frozen in liquid nitrogen for perchloric acid extraction. Perchloric extracts were analysed for positional 13C-abundances by NMR. Each column is a separate set of experimental conditions. Cit, citrate; Fum, fumarate; Ido/Gal, uncertain D-hexofuranose belonging to the idose-galactose group; Mal, malate; Obt, oxobutyrate; SF and
SG, fructosyl and glucosyl moieties of sucrose, respectively. Red and green cells indicate 13 C-abundances above and below the natural abundance (which is 1.1%). Below-natural abundance cells appear dark-green because the 13C-abundance is still very close to 1.1%.
Figure 4. Main panel. 13C-abundance in glutamate (Glu, black bars), succinate (Succ, light-grey bars) and fumarate (Fum, dark-light-grey bars), relative to that in malate. Values are from the data of Fig. 3. The three different CO2 mole fractions (in µmol mol-1) used in the experiment are indicated on the x axis. Inset. Data of Fig. 3, replotted to show the relationship between the positional 13C-abundance (in % of 13C) in malate C-2 (triangles), fumarate C-2/3 (circles) and glutamate C-2 (squares) and the quantity of metabolite (in µmol per gram of fresh weight). Short dashed lines indicate exponential decay (fumarate and malate) and linear (Glu) regressions; both are significant: F=7.26 (P<0.005) and F=16.38 (P<0.003), respectively.
Figure 5. Relationship between the inhibition of the TCA cycle in the light (in %, data from Fig. 2) and the dihydroxyacetone phosphate (DHAP) to inorganic phosphate (Pi) (open discs) or Glc-6-phosphate (closed disks) ratio. Phosphorylated compounds were measured by 31 P-NMR on the same samples used for 13C-NMR after 13C-labeling. Lines stand for linear regressions. The regression with DHAP/Glc-6-P is significant (F=61.7, P<0.08).
Figure 1 δ 1 3 C o f d a rk -r e s p ir e d C O2 ( ‰ ) 0 200 400 600 800 1000 1200 1400 1600 S te a d y ∆o b s ( ‰ ) 0 50 100 150 200 250 without 13C-substrate fed with 13C-substrate
A
B
13C-1 Pyr 13C-2 Pyr 13C-1 Pyr 13C-2 Pyr
140 µL L -1, 2 1% O2 400 µL L -1, 2 1% O2 1000 µL L -1, 2 1% O2 400 µL L -1, 2 % O 2 140 µL L -1, 2 1% O2 400 µL L -1, 2 1% O2 1000 µL L -1, 2 1% O2 400 µL L -1, 2 % O 2 140 µL L -1, 2 1% O2 400 µL L -1, 2 1% O2 1000 µL L -1, 2 1% O2 400 µL L -1, 2 -21% O2 400 µL L -1, 2 -2% O2 140 µL L -1, 2 1% O2 400 µL L -1, 2 1% O2 1000 µL L -1, 2 1% O2 400 µL L -1, 2 -21% O2 400 µL L -1, 2 -2% O2
Figure 2 D e c a rb o x y la ti o n ( µm o l m -2 s -1 ) 0.0 0.2 0.4 0.6 TCA cycle PDH
A B C
In h ib it io n b y l ig h t (% ) 0 20 40 60 80 100 140 µL L -1, 2 1% O2 400 µL L -1, 2 1% O2 1000 µL L -1, 2 1% O2 400 µL L -1, 2 % O 2 140 µL L -1, 2 1% O2 400 µL L -1, 2 1% O2 1000 µL L -1, 2 1% O2 400 µL L -1, 2 % O 2 140 µL L -1, 2 1% O2 400 µL L -1, 2 1% O2 1000 µL L -1, 2 1% O2 400 µL L -1, 2 % O 226 F ig ur e 3 140 µL L-1 400 µL L-1 1000 µL L-1
Figure 4
CO2 mole fraction (µmol mol-1)
1 3 C a b u n d a n c e r e la ti v e t o M a la te 0.0 0.1 0.2 0.3 0.4 0.5 0.6 0.7 Glu Succ Fum Quantity (µmol g FW-1) 0.0 0.5 1.0 1.5 2.0 2.5 3.0 3.5 P o s it io n a l 1 3C a b u n d a n c e ( % ) 0 2 4 6 8 10 12 140 µL L-1 400 µL L-1 1000 µL L-1
Figure 5 Inhibition by light (%) 20 40 60 80 100 R a ti o 0.0 0.1 0.2 0.3 0.4 0.5 0.6
Supporting information (for on-line publication)
Table S1. Apparent photosynthetic carbon isotope discrimination (∆obs) and carbon isotope composition of dark-respired CO2 (δ 13
C) of detached leaves fed with 13C-1- or 13C-3-Glc. Conditions during the light period are 140 and 400 µL L-1 CO2 in 21% O2 under 400 µmol m-2 s-1 PPFD. In
water (no feeding conditions), the ∆obs value is 21.6±1.2‰. The δ13C value of respired CO2 in darkness in water (no feeding) is -34.5±0.8‰ and
-42.0±0.7‰ after a light period under 140 µL L-1 and 400 µL L-1 CO2, respectively. Mean and SE of three measurements.
140 µL L-1 CO2 in 21% O2 400 µL L
-1
CO2 in 21% O2
13
C-1-Glc 13C-3-Glc 13C-1-Glc 13C-3-Glc
Light Darkness Light Darkness Light Darkness Light Darkness
∆obs, ‰ δ 13 C, ‰ ∆obs, ‰ δ 13 C, ‰ ∆obs, ‰ δ 13 C, ‰ ∆obs, ‰ δ 13 C, ‰ 56.0±5.6 386±8 106.4±13.8 719±30 23.8±1.0 245±8 23.8±1.0 365±33
Table S2. Glucose decarboxylation rates and inhibition of decarboxylation by light, using the method of ref. (9) and data from Table S1. The decarboxylation rates by PDH and the TCA cycle are given in the light (denoted as rlight just below) and in the dark (denoted as rnight just below).
Inhibition by light (calculated as 1 – rlight/rnight, in %) is indicated on the right.
140 µL L-1 CO2 in 21% O2 400 µL L
-1
CO2 in 21% O2
PDH decarboxylation TCA decarboxylation PDH decarboxylation TCA decarboxylation
Decarboxylation value in the
light, µmol m-2 s-1 0.067±0.011 0.111±0.001 0.007±0.001 0.019±0.001 Decarboxylation value in darkness, µmol m-2 s-1 0.205±0.017 0.267±0.001 0.074±0.001 0.204±0.001 Inhibition by light, % 67.4±2.8 58.5±0.1 89.4±0.7 90.7±0.1
Table S3. Carbon isotope composition of starch (in ‰) after feeding leaves with 13C-enriched Glc (δ13C=2500‰) or Pyr (δ13C=1400‰) in the light under different CO2/O2 conditions (experiment described in Figure 1) and associated contributions of 13C-enriched substrates to starch
synthesis. The δ13C value of CO2 used in the open system is −50.2‰. Samples were immediately frozen in liquid nitrogen after 2 hours feeding,
for starch extraction. The contribution values assume refixation of the 13C-enriched decarboxylated CO2 and do not take into account the global
δ13C of added substrate. Contributions given in µmol m-2 s-1are average values over the 2 h feeding period. Mean and SD of three measurements.
140 µL L-1 CO2 in 21% O2 400 µL L-1 CO2 in 21% O2 1000 µmol mol-1 CO2 in
21% O2
400 µmol mol-1 CO2 in
2% O2
13
C-1-Pyr 13C-2-Pyr 13C-1-Glc 13C-3-Glc 13C-1-Pyr 13C-2-Pyr 13C-1-Glc 13C-3-Glc 13C-1-Pyr 13C-2-Pyr 13C-1-Pyr 13C-2-Pyr
No feeding –28.0±1.0 –31.4±0.4 –35.4±0.9 –33.0±0.9 Fed leaf -12.7±0.5 -27.4±0.4 -18.3±0.5 -13.3±0.6 -21.8±1.0 -29.9±0.7 -27.3±0.6 -27.7±0.2 -36.5±0.5 -32.5±0.4 -22.3±0.3 -27.4±0.7 Contribution (%) 0.37 0.01 0.13 0.20 0.23 0.03 0.06 0.05 0 0.06 0.26 0.13 Contribution (µmol m-2 s-1) 0.06 0 0.02 0.03 0.04 0.01 0.01 0.01 0 0.01 0.04 0.02