HAL Id: hal-01829736
https://hal.archives-ouvertes.fr/hal-01829736
Submitted on 4 Jul 2018HAL is a multi-disciplinary open access archive for the deposit and dissemination of sci-entific research documents, whether they are pub-lished or not. The documents may come from teaching and research institutions in France or abroad, or from public or private research centers.
L’archive ouverte pluridisciplinaire HAL, est destinée au dépôt et à la diffusion de documents scientifiques de niveau recherche, publiés ou non, émanant des établissements d’enseignement et de recherche français ou étrangers, des laboratoires publics ou privés.
Mapping soil typologies using geomorphologic features
extracted from dem and SAR data: A environmental
factor affecting malaria transmission in the Amazon
Zhichao Li, Thibault Catry, Nadine Dessay, Emmanuel Roux, F. Seyler
To cite this version:
Zhichao Li, Thibault Catry, Nadine Dessay, Emmanuel Roux, F. Seyler. Mapping soil typologies using geomorphologic features extracted from dem and SAR data: A environmental factor affecting malaria transmission in the Amazon. IGARSS 2016 - 2016 IEEE International Geoscience and Remote Sensing Symposium, Jul 2016, Beijing, China. �10.1109/IGARSS.2016.7729812�. �hal-01829736�
MAPPING SOIL TYPOLOGIES USING GEOMORPHOLOGIC FEATURES EXTRACTED
FROM DEM AND SAR DATA: AN ENVIRONMENTAL FACTOR AFFECTING MALARIA
TRANSMISSION IN THE AMAZON
Zhichao Li
1*, Thibault Catry
1, Nadine Dessay
1, Emmanuel Roux
1, Frédérique Seyler
1 1ESPACE-DEV, UMR 228 IRD/UM/UR/UG, Institut de Recherche pour le Développement (IRD),
Montpellier, France
[email protected]
;
[email protected]
;
[email protected]
;
[email protected]
;
[email protected]
ABSTRACT
Soil typologies are characterized by different distribution and circulation of water, associated with specific water chemical properties, and thus potentially affects the distribution and density of malaria vectors in the Amazon. Based on a conceptual model of tropical soil evolution and distribution, the curvature of watershed slopes is a key indicator of soil typology. The average curvature of each subwatershed in our study area was identified using 30 m resolution SRTM data. PALSAR image with a spatial resolution of 12.5 m was used to implement a land cover map, including water and water surfaces. The non-water surface was then integrated with the average curvature of subwatersheds for soil typologies mapping. An indirect approach of soil typologies prediction was proposed, which is complementary with the classical soil classification methods.
Index Terms— Soil typologies mapping, SRTM, ALOS PALSAR, geomorphology, malaria
1. INTRODUCTION
Malaria is one of the most common vector-borne diseases in the world, with an estimated 214 million new cases and 438,000 deaths in 2015 [1], which mostly covers tropical and subtropical zones. In the Americas, the Amazonian region is the most affected by the disease. Soil typologies play an important role
in malaria transmission. Actually, the distribution and density of malaria vectors is impacted by water physical and chemical properties, which are linked with soil typology.
In the Amazon, sustained high temperature and heavy rainfall significantly affect soil evolution and consequently geomorphologic features. Geomorphologic features (elevation, slope, aspect, curvature, etc.) are then indicators of soil evolution. They are the consequence of movements and redistribution of water and matter in the landscape [2]. Moreover, soil typologies mapping is a difficult topic in the Amazon because of dense forest cover and poor accessibility for field data [3]. In such context, using remote sensing is a solution for digital soil typologies mapping. Digital elevation model (DEM), combined with optical and/or Synthetic Aperture Radar (SAR) imagery may be used to characterize geomorphologic features and water distribution [2]. SAR data are cloud-penetrating which enables to reduce the information omission caused by clouds.
The objective of this study is to propose a novel method of digital soil mapping based on geomorphologic features determination and remote sensing.
2. STUDY AREA
This study was carried out in an Amazonian area, the cross-border region between French Guiana and
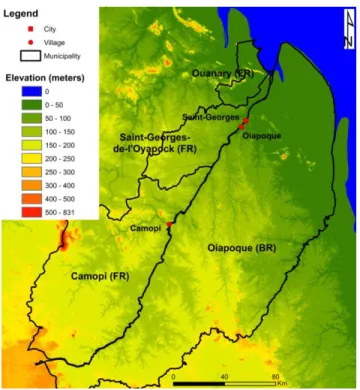
Brazil, corresponding to the Oyapock basin and including the French municipalities of Camopi, Saint-Georges-de-l’Oyapock and Ouanary, and the Brazilian municipality of Oiapoque (Figure 1).
Figure 1: The elevation map and administrative division of study area.
The altitude increases from the northeast to the southwest, with the eastern coastal lowlands and the western highlands (Figure 1). The climate is typically tropical, with an average annual temperature of 27°C and humidity ≥ 80%.
3. DATA AND METHODS
3.1. Knowledge-based model of soil evolution
In our study area, ferralsols derived from a granito-gneissic basement are dominant. The soil evolution presents three main processes (Figure 2) [4]:
1. Vertical lessivage of ferralsols with the lateral impoverishment of ferrum;
2. Impoverishment and redistribution of ferrum with the blockage of B-Horizon by illuvial clay;
3. Podzolisation hydromorphic: ferralsols is progressively degraded and disappear while clay minerals are attacked.
The stages of soil evolution correspond to convex, convex-concave and concave interfluves, respectively. Ferralsols (red) are predominant in convex interfluves. Soils with a little development (Red-yellow) mainly occur in convex-concave interfluves. Hydromorphic soils mainly appear in concave interfluves.
Figure 2: The knowledge-based model of soil evolution [4].
3.2. Soil typologies mapping
The Shuttle Radar Topography Mission (SRTM) 30m DEM was used for identifying the curvature, flow direction and the outlet of each subwatershed. The flow direction data and outlets were used to compute a layer of subwatersheds, which was integrated with curvature layer using zonal statistic for determining the average curvature of each subwatershed. Finally, all subwatersheds were classified as convex, concave-convex and concave, which the three soil types in the soil evolution model. The above data processing was performed using Arcmap 10.2.
Water surfaces and artificial lands do not contain information relevant for soil typologies mapping [2]. Moreover, artificial lands accounts for a very small proportion in our study area. One ALOS PALSAR image dated August 7, 2010 with a spatial resolution of 12.5 m (radiometrically calibrated, with the speckle filtered and geometric correction) was used to perform a textural analysis (GLCM under Sentinel tool box). Then, a simple thresholding method on the entropy of SAR signal was used for creating a binary land cover map: water and non-water surfaces. The convex, concave-convex and concave were applied on the
non-water surface for implementing the specialization of
soil typologies. The entire method is summarized in Figure 3.
Figure 3: Summarized methodology for soil typology mapping using DEM and SAR data
4. RESULTS AND DISCUSSION
4.1. Results
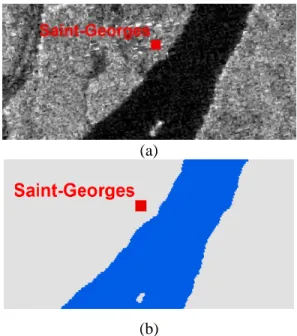
Figure 4a shows that the water and non-water surfaces are distinctly visible in PALSAR image. Water surfaces were detected using an appropriate threshold value of entropy (figure 4b).
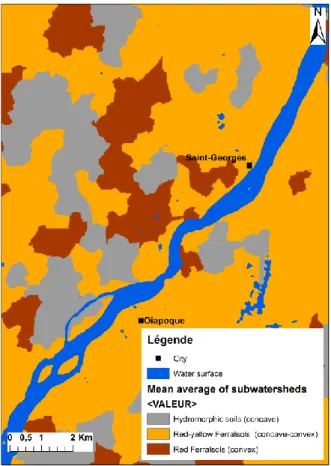
The subwatersheds were presented in figure 5. Three soil typologies located in the three different landscapes in term of curvature (figure 6).
(a)
(b)
Figure 4: a) ALOS PALSAR imagery; b) the binary land cover (water and non-water surfaces)
(subset of Saint-Georges city).
Figure 5: Example of subwatersheds in our study area.
Figure 6: Map of soil typologies related to soil evolution.
4.2. Discussion
In our study, the knowledge of tropical soil evolution is the cornerstone. The proposed method is suitable for our study area because of the predominance of the dense vegetation cover and the small amount of artificial lands. Other environmental factors or geomorphologic features may be integrated in this study. For example, the effect of vegetation as indicator of soil evolution may be relatively easy to characterize using remote sensing and should be considered in the future. High-resolution satellite imagery could be used to extract artificial lands in other study areas where artificial lands accounts for a larger proportion. The validation of soil classification could be performed, using the existing pedological maps, field data and expert knowledge. Moreover, using the proposed method, the DEM at a higher
spatial resolution may be used to refine the map of soil typologies which could be used at a local scale.
5. CONCLUSION ET PERSPECTIVES
This study proposed a novel method of soil typologies mapping based on the knowledge of tropical soil evolution and the combining of DEM and SAR data. The approach enables the identification of geomorphologic features and the spatialization of soil types. The proposed approach may be used to access the breeding sites of malaria vectors and their water physical and chemical properties.
6. ACKNOWLEDGMENTS
This research was supported by the TéléPal project (CNES-TOSCA 2014 call), the Biodiva program funded by GUYAMAZON action (IRD, MAEDI, Brazilian FAPs), the GAPAM-Sentinela project (Guyamazon call) and the China Scholarship Council.
7. REFERENCES
[1] WHO. “World Malaria Report 2015”, World Health Organization, Geneva, Switzerland, 2015. [2] V.L. Mulder, S. de Bruin, M.E. Schaepman, T.R. Mayr, “The use of remote sensing in soil and terrain mapping – A review,” Geoderma, vol. 162, pp. 1-19, 2010.
[3] S. Guiet, J.F. Cornu, O. Brunaux, J. Betbeder, J.M. Carozza, C. Richard-Hansen, “Landform and landscape mapping, French Guiana (South Americ), Journal of Maps, vol 9, pp. 325-335, Mar 2013. [4] A. Melfi, E. Fritsch, R. Boulet, F. Seyler, A. Carvalho, P. Magat, “Distribuição dos solos nas paisagens lateríticas da Amazônia. Elaboração de um modelo conceitual ilustrando a evolução hydro-bio-geoquímica destas paisagens,” XIII Congresso Latino Americano de Ciência do solo, Águas de Lindoia, SP, Brasil, 4-8 August 1996.