HAL Id: hal-03045107
https://hal.archives-ouvertes.fr/hal-03045107
Submitted on 7 Dec 2020
HAL is a multi-disciplinary open access
archive for the deposit and dissemination of
sci-entific research documents, whether they are
pub-lished or not. The documents may come from
teaching and research institutions in France or
L’archive ouverte pluridisciplinaire HAL, est
destinée au dépôt et à la diffusion de documents
scientifiques de niveau recherche, publiés ou non,
émanant des établissements d’enseignement et de
recherche français ou étrangers, des laboratoires
Pumping effect of heterogeneous meniscus formed
around spherical particle
Hayate Nakamura, Tetsuya Ogawa, Motochika Inoue, Takuma Hori, Lizhong
Mu, Harunori Yoshikawa, Farzam Zoueshtiagh, Georg Dietze, Takahiro
Tsukahara, Ichiro Ueno
To cite this version:
Hayate Nakamura, Tetsuya Ogawa, Motochika Inoue, Takuma Hori, Lizhong Mu, et al.. Pumping
effect of heterogeneous meniscus formed around spherical particle. Journal of Colloid and Interface
Science, Elsevier, 2020, 562, pp.133-141. �10.1016/j.jcis.2019.12.005�. �hal-03045107�
Pumping effect of heterogeneous meniscus formed
around spherical particle
Hayate Nakamuraa, Tetsuya Ogawaa, Motochika Inouea, Takuma Horib, Lizhong Muc, Harunori N. Yoshikawad,∗, Farzam Zoueshtiaghe, Georg Dietzef,
Takahiro Tsukaharag,h, Ichiro Uenog,h,∗
aDivision of Mechanical Engineering, Graduate School of Science and Technology, Tokyo
University of Science. 2641 Yamazaki, Noda, Chiba 278-8510, Japan
bDivision of Advanced Mechanical Systems Engineering, Institute of Engineering, Tokyo
University of Agriculture and Technology. 2-24-16 Koganei City, Naka Town, Tokyo 184-8588, Japan
cKey laboratory of Ocean Energy Utilization and Energy Conservation of Ministry of
Education, School of Energy and Power Engineering, Dalian University of Technology, China
dUniversit´e Cˆote d’Azur, CNRS, Institut de Physique de Nice, France
eUniversit´e Lille, CNRS, ECLille, ISEN, Univ. Valenciennes, UMR 8520 - IEMN, F-59000
Lille, France
fUniversit´e Paris-Sud, CNRS, Lab. FAST, Bˆat. 502, Campus Univ., Orsay, F-91405,
France
gDepartment of Mechanical Engineering, Faculty of Science and Technology, Tokyo
University of Science. 2641 Yamazaki, Noda, Chiba 278-8510, Japan
hResearch Institute for Science and Technology (RIST), Tokyo University of Science. 2641
Yamazaki, Noda, Chiba 278-8510, Japan
Abstract
Hypothesis: A disturbance such as a microparticle on the pathway of a spreading
droplet has shown the tremendous ability to accelerate locally the motion of the macroscopic contact line (Mu et al., J. Fluid Mech. 830, 2017) [1]. Although this ability has been linked to the particle-liquid interaction, the physical mech-anisms behind it are still poorly understood despite its academic interest and the scope of numerous industrial applications in need of fast wetting.
Experiments: In order to better understand the mechanisms behind the
particle-liquid interaction, we numerically investigate the pressure and velocity fields in the liquid film. The results are compared to experiments assessing the temporal shape variation of the liquid-film meniscus from which pressure difference around
∗Corresponding author
Email addresses: Harunori.YOSHIKAWA@univ-cotedazur.fr (Harunori N. Yoshikawa),
the particle is evaluated.
Findings: The particle-induced acceleration of the film front depends both on
the shape of the meniscus that forms around the particle foot and the liq-uid “reservoir” in the film that can be pumped thanks to the presence of the particle. The study validates the presence of three stages of pressure differ-ence between the upstream and downstream regions of the meniscus around the particle, which leads to the local acceleration/deceleration of the macro-scopic contact line. We indicate that asymmetric meniscus around the particle foot produces a net pressure force driving liquid and accelerating the liquid-film front.
Keywords: dynamic wetting, meniscus, capillary 2010 MSC: 00-01, 99-00
1. Introduction
Many natural systems exploit the wetting of their surfaces in various as-pects. For example, lotus leaves repel water droplets by their microstructures [2]; nepenthes rafflesianas profit of quick liquid transport thanks to their unique surface structures [3]; water-walking insects take postures that deform the free 5
surface and enable them to leap over menisci [4]. Wetting also finds its impor-tance in numerous industrial fields. Efficient heat transfer in heat pipes requires enhanced wetting of their inner surfaces by working fluids. The functioning of a micro-total analysis system (µ-TAS) may fully depend on the wetting phe-nomena in microfluidic channels and involved elements [5]. For instance, the 10
transport of a small amount of liquid into a small inspection region of µ-TAS is realized by chemical [6, 7] or physical functionalization of surfaces [8] where controlled wetting is of utmost importance.
Owing to its importance, numerous studies on wetting have been reported. Liquid spreading on a solid surface can be characterized by the behavior of a 15
contact line (CL), which is a junction of solid, liquid, and gas phases. The dynamics of a CL can be characterized by the spreading parameter, S = γSG−
γSL− γ, where γSG, γSL and, γ are the interfacial tensions of gas, solid-liquid and solid-liquid-gas interfaces, respectively [9]. A contact line can be pinned onto a solid surface under S < 0 to form a static contact angle predicted by 20
Young’s equation [10]. A CL can advance under S > 0 to extend the wetted area of surface. Focusing on this phenomenon, Hoffman performed experiments of pushing silicone oil in a glass tube with a piston [11]. The correlation between the contact angle θ and the capillary number Ca = µU/γ was derived; here,
µ and U are the dynamics viscosity of the liquid and the velocity of the CL,
25
respectively. The capillary number is an important parameter for estimating the effects of viscous stress on liquid spreading.
The correlation between the spreading radius R and the spreading time
t of liquid film on a smooth horizontal substrate can be expressed as R ∼ ta
[12, 13, 14]. Here, a is an exponent that depends on the dominant force acting on 30
the liquid film; a = 1/10 and 1/8 in the regimes of the interfacial-force dominant [13] and the gravity-dominant [12], respectively. In particular, the parameter becomes a = 1/7 in the one-dimensional spreading when surface tension is dominant. In the case of rough surfaces, it was indicated that the roughness enhances the wettability under S > 0 [15]. Microstructures of solid surfaces 35
change the wetting behavior significantly [16, 17, 18, 19, 20]. The coupled effects of surface chemical properties and surface topology on the exponent were investigated [7].
Recently, the dynamics of an advancing CL interacting with spherical par-ticles placed on a horizontal substrate was investigated [1, 21]. It was shown 40
that the CL can undergo a large acceleration up to 10 times faster than in the absence of particles. Mu et al. [1] attributed this behavior to the curvature of the meniscus formed around spherical particles and showed that the observed large velocities can be explaneed by their theoretical model based on the Cox’s law [22]. Mu et al. [23] extended the experimental studies of Mu et al. [1] and 45
Kondo et al. [21] but with different particles in cylindrical and triangular prism shapes. They found that spherical particles caused the largest acceleration. They also showed that the sequential arrangement of microstructures enables
a control over the direction of liquid transport, which would constitute a novel efficient alternative to existing liquid transport techniques [24].
50
In this paper, we perform numerical simulations of the interaction between a CL and a single particle by a numerical code based on the InterFoam solver of the open-source software OpenFOAM. The goal is to elucidate the details of the local flow characteristics in the wetting process and unravel the physical mechanisms behind the acceleration of the CL. The behavior of CL predicted by 55
the simulations are first compared with experiments to validate our numerical code. The velocity field and pressure distribution obtained by the simulations are then examined. Based on the computational results, the physical mechanism responsible for the CL acceleration is unraveled.
2. Methods
60
2.1. Numerical simulations
The open-source solver for computational fluid dynamics, OpenFoam (ver. 5.0), is used to carry out the present numerical simulations. The free-surface modeling technique of the volume of fluid [25] is used to track the gas-liquid two-phase flow. The governing equations for the simulations are:
∇ · U = 0 (1)
∂ρU
∂t +∇ · (ρUU) = −∇p + ∇ · τ + ρg + FSV (2)
∂α
∂t +∇ · (αU) + ∇ · (Urα (1− α)) = 0. (3)
Equations (1)-(3) are, respectively, the continuity equation of incompressible flows, the Navier-Stokes equation, and an advection equation of volume function
α. The symbols U , p, τ , FSV, Ur represent velocity, pressure, viscous stress, force induced by the interfacial tension, and relative velocity between liquid 65
values of 1 and 0 when an computational cell is fully occupied by liquid and gas, respectively, and takes in-between values when an interface is present in the cell. Solving the advection equation enables to track the interface. Note that in order to counteract the numerical diffusion, a compression velocity is used. 70
We define α = 0.5 isosurface as the liquid-gas interface. The stress due to the interfacial tension is described by FSV = γκn = γκ∇α/∥∇α∥ by continuum surface force method [26], where κ and n are the curvature of the interface and the unit normal vector of the interface pointing to the gas phase, respectively.
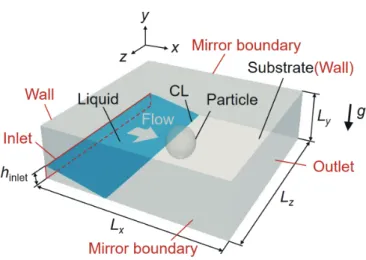
The computational domain is shown in Fig. 1. The length and grid number 75
of the domain are (Lx, Ly, Lz) [µm] = (300, 80, 300) and (Nx, Ny, Nz) = (150, 40, 150), respectively. The origin of the coordinate system is set on the substrate surface at the upstream edge of the computational domain. No-slip and no-penetration conditions are imposed at the substrate surface (x, y = 0,
z). The top plane (x, y = Ly, z) and the side planes ((x, y, z = 0); (x, y, 80
z = Lz)) are set to mirror boundaries. A spherical solid boundary representing a particle of diameter Dp= 50 µm is positioned at the center of the substrate (xp= 150, yp= 25, zp= 150) µm. The wettability of the substrate and that of the particle are prescribed by contact angles θs= 5◦and θp= 20◦, respectively. The advancing/receding contact angles for the substrate and particles are set to 85
be 0◦ and 10◦, and 10◦ and 30◦, respectively. We set the physical properties of liquid and gas as those of 2-cSt silicone oil and air used in the experiments; the surface tension, density and kinematic viscosity of the liquid are γ = 1.83×10⁻² N/m, ρl = 873 kg/m3, νl = 2.0× 10⁻⁶ m2/s, and the density and kinematic viscosity of the gas are ρg= 1 kg/m3 and νg= 1.48× 10⁻⁵ m2/s, respectively. 90
The gravitational acceleration is set to be constant at g = 9.81 m/s2. At time t = 0 s, the liquid film starts to flow into the computational domain under the condition of Pinlet = 0 from the inlet of height hinlet = 20 µm at the x = 0 boundary. The capillary number of the liquid flow is small, e.g., Ca = 3.01× 10⁻⁴ just before the particle start to be wetted, but larger than 95
in the experiments (Sec. 2.2 and Ref. [1]) in order to reduce the time for flow computation. Kondo et al.[21] indicated that the ratio of the maximum
Figure 1: Computational domain of spreading liquid film on horizontal substrate with a single particle.
velocity of the contact line to the velocity just prior to the interaction with the particle on the substrate become drastically smaller as increasing Ca. It was indicated that the maximum velocity decreases accompanying with the particle
100
sucked to the bulk of the droplet after the contact with the contact line of the droplet. It must be noted that such trend was obtained in the system with the mobile particle just settled on the substrate. In the present simulation, we employ the particle fixed to the substrate, thus the trend observed by Kondo et
al.[21] never takes place. Corresponding Reynolds number Re = U0Dp/ν and
105
Ohnesorge number Oh =√ρν2/(γD p) =
√
Ca/Re for the present simulation are Re = 7.89×10⁻²and Oh = 6.18×10⁻², respectively. Here U0is the velocity
of the macroscopic contact line just prior to the contact with the particle. We limit ourselves to deal with the phenomenon under which the effect of inertia is negligible.
110
2.2. Experiment
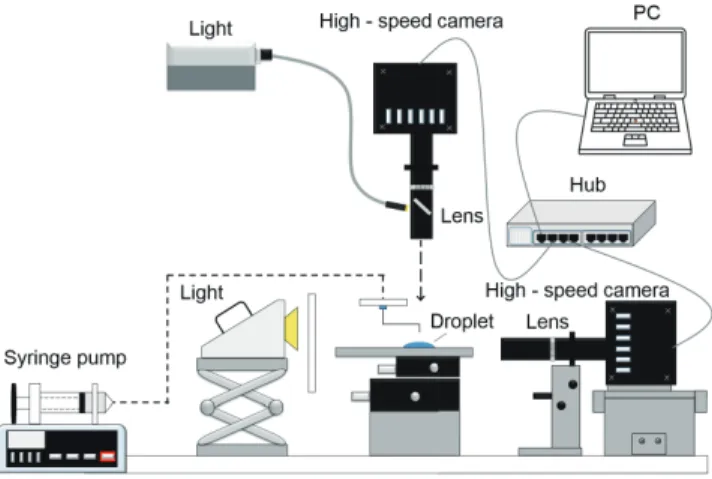
Experiments are conducted to assay the similarity and the validity of the computational results. The setup, identical to that of Mu et al.[1], is illustrated in Fig. 2. For detailed description of the setup refer to Mu et al.[1] The test fluid
Figure 2: Experimental apparatus for observation of droplet spreading on substrate. Simulta-neous observation from above and side is realized with synchronized two high-speed cameras.
is 2-cSt silicone oil (polydimethylsiloxane, KF-96L-2cSt, Shin-Etsu Chemical 115
Co., Ltd.), with a density of ρ = 873 kg/m3, a kinematic viscosity of ν = 2.00 mm2/s, and a surface tension of γ = 18.3 mN/m at 25 ◦C. A syringe pump (YPS-202, YMC Co., Ltd.) delivers a droplet of volume of 1.8 mm3 through a needle tip coated with fluoride. The height of the needle tip from the substrate is set to 2.0 mm. The substrate is a silicon-wafer priory cleaned by acetone and 120
then by plasma (PDC 32G, Harrick Plasma) for a duration of 10 minute before every experimental run. Spherical glass particles (Soda lime, Fuji Manufacturing Co., Ltd.) of diameter Dp = 200 µm are used. The particle size here is larger than those used in the previous experiment [1] and in our numerical simulations in order to capture the gas-liquid interface with higher accuracy. The horizontal 125
distance between the centers of the particle and the needle tip is 4.0 mm. The interaction between the liquid and the particle is monitored simultaneously from top and side by high-speed cameras (Fastcam Mini WX100, Photron Ltd.). The resolution in top and side views are 2.17 µm/pix and 0.77 µm/pix, respectively. The frame rates of both cameras are 50 frames per second (fps). A 100 W cold 130
3. Results and discussion
3.1. Experiment
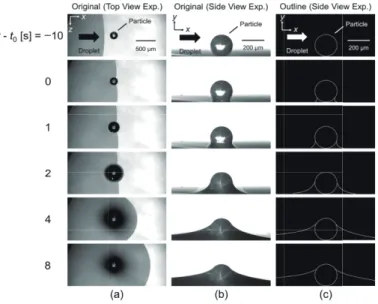
The spatio-temporal profiles of the liquid film interacting with a particle are derived from the videos captured by the high-speed cameras. The snapshot 135
views in Fig. 3 (a, b) show the spreading behavior of the droplet near the particle in both views. We here define as t0[s] the moment at which the meniscus starts to envelop the particle observed from top. The velocity of the CL, UCL, is obtained from video analysis. In order to evaluate UCL, we apply the process as indicated in Fig. 4 in [1] to the successive images observed from the side. 140
That is, we construct a space-time diagram along the substrate surface for tracking the position of the macroscopic contact line, XCL(t), from the successive side-view images. The velocity UCL is then the computed from the temporal evolution of XCL(t). The capillary number just before interacting with particle corresponds to Ca∼ 3.7×10⁻⁶. Under the present condition for the experiment,
145
the Reynolds and Ohnesorge numbers are Re∼ 3.9×10⁻³and Oh∼ 3.1×10⁻², respectively. We thus neglect the inertia effect in the present system as [1]. The profiles of liquid film in the symmetry plane (i.e., the plane z = zp) extracted from side-view images are shown in Fig. 3 (c). By monitoring the temporal evolution of the spatial profiles of the meniscus formed around the particle, we 150
obtain the same tendency as that in the previous study using smaller spherical particles of diameter Dp= 50 µm [1]. That is, when the spreading liquid film makes a contact with the particle, a concave meniscus, i.e., a meniscus with negative curvature in the x-y plane, forms around the particle foot, as seen in Fig. 3 (b, c).
155
From meniscus profiles we evaluate the pressure difference ∆pgl between liquid and gas phases based on the stress balance at interface,
∆pgl:= pg− pl= γ ( ξyy ( 1 + ξ2 y )3/2 − 1 ξ(1 + ξ2 y )1/2 ) , (4)
where pg, pl represent the pressures on the gas and liquid sides of the interface, respectively, and x = ξ(t, y) is the meniscus profile in the symmetry plane. ξy
Figure 3: Meniscus formation around a particle of a diameter Dp= 200 µm observed in an
experiment. Images in top view (a) and in side view (b) and meniscus profiles (c) extracted from the side view images.
and ξyy stand for the first and second derivatives of ξ with respect to y. In Eq. (4), viscous stresses and gravity force are neglected, as both capillary and Bond numbers, Ca, Bo are small: Ca ∼ 3.7 × 10⁻⁶ ≪ 1 and Bo = ρDp2g/γ ∼ 160
1.87×10⁻²≪ 1 in our experiment. The stress balance condition at the interface then takes the same form as the Young-Laplace equation. In Equation (4), we have also assumed that the azimuthal variation of meniscus shape around the particle is locally negligible at the upstream and downstream sides. This assumption is supported by the fact that the CL downstream of the meniscus 165
remains circular throughout meniscus development as shown in Fig. 3 (a). We estimate ∆pglfor an observed meniscus by seeking a value of ∆pglthat produces the solution of Eq. (4) fitting the best the experimental profile. This evaluation of Laplace pressure is validated from numerical results (Appendix).
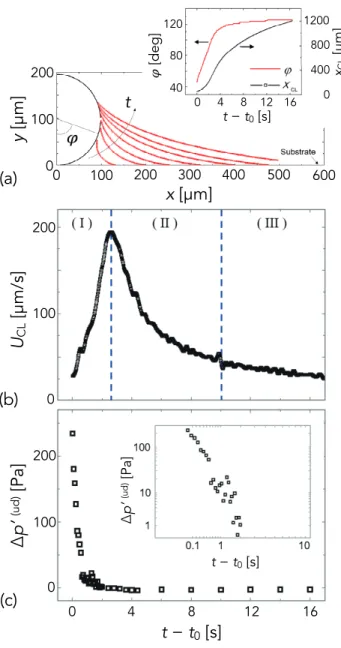
The temporal variation of velocity of the CL, UCLare shown in Figure 4 (b). 170
The net pressure difference (Fig. 4 (c)) between upstream and downstream of the particle is assessed from ∆p′(ud) := p(up)l − p(down)l = ∆p(up)gl − ∆p(down)gl
where superscripts (up) and (down) indicate ‘upstream’ and ‘downstream’ with respect to the particle, respectively. These figures show a rapid increase of
UCL at the beginning of meniscus formation (at 0≤ t − t0 [s]≤ 2.6), before a 175
decrease (at t− t0 [s] > 2.6) as the pressure difference drops. Here, UCL hits maximum value slightly after the highest pressure difference ∆p′(ud)is reached. This observation suggests that the pressure inside the meniscus is an important factor for the acceleration of the .
3.2. Simulation
180
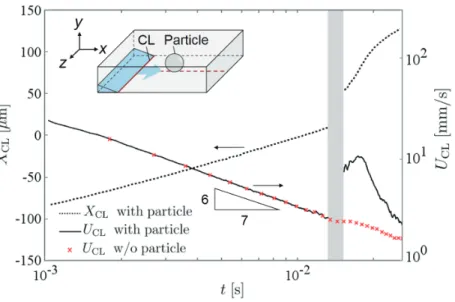
Figure 5 shows numerical results of the spreading distance XCLand the UCL on the substrate with or without the particle. The spreading distance XCL is defined as the CL position along the line of (x, y = 0, z = zp), and UCL is approximated by central differences. As shown in Fig. 5, on the flat substrate without the particle, the simulations correctly reproduce the liquid film spreads 185
by following Tanner’s law [13], XCL ∝ t1/7 and UCL ∝ t−6/7. Similar to the experiments, the presence of the particle significantly alters the spreading of the liquid film: the velocity increases to reach a maximum value and then gradually decreases.
The theoretical analysis in the previous study [1] found that the meniscus 190
formed around the particle plays an important role in the acceleration phe-nomenon. We now investigate in detail what happens within the meniscus based on our numerical simulations, as shown in Fig. 6. In our simulation, the liquid film rises up around the particle right after the interaction, and the menis-cus with negative curvature of the interface is spontaneously formed, which is 195
similar to our experimental results. At the initial stage of meniscus formation (i.e., just after the liquid film contacts with the particle), the velocity on the meniscus surface exhibits an increase locally at the contact part (t = 15.0 ms). As the liquid film rises around the particle, the CL on the substrate spreads forward (t = 17.0 ms), and then decreases (t = 19.0 ms). Here, the interface 200
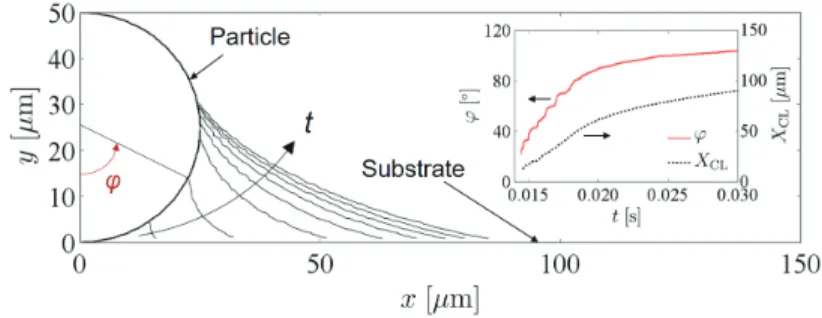
shape of the liquid film in the x-y cross section is shown in Fig. 7 to discuss the detail of its time evolution. The inset shows the comparison of the CL angular
(a)
0 100 200y
[
μ
m]
x [μm]
0 100 200 300 400 500 600 0 100 200U
CL[
μ
m/s]
(b)
0 100 200Δ
p’
(ud)[Pa]
(c)
0 4 8 12 16t − t
0[s]
𝜑
t
40 80 120 𝜑 [deg] xCL [ μ m] 1200 800 400 0 0 4 8 12 16 t − t0 [s] Δ p’ (ud) [Pa] t − t0 [s]Figure 4:memo by IU:
I plan changing the figure for (a); temporal variations of the meniscus are also illustrated as Mu et al.(JFM 2017) in order to reflect the comment 4 by the reviewer1. What do you think? (a) Example of evaluating profiles of meniscus (red) formed around particle from experimental result. Inset: temporal variations of the contact-line positions along the particle, ϕ, and that along the substrate, XCL. Temporal variations of (b) CL velocity UCLand (c)
evaluated pressure difference between menisci on upstream and downstream sides ∆p′(ud)l :=
Figure 5: Temporal variations of the CL position XCLand velocity UCLon substrates. The
CL position is derived on the line parallel to the x direction passing under the particle foot on the substrate as illustrated in inset. Note that the CL position is not well defined in the gray area, in which the CL is traveling around the particle foot.
position φCL around the particle and XCL. Because the CL of the spreading liquid film keeps advancing downstream of the particle, the distance over which the meniscus connects the substrate to the particle becomes longer and longer, 205
and this causes the meniscus curvature (in the x-y plane) to decrease in mag-nitude. Such trend qualitatively agrees with the experimental results [1]. We note the time scale of meniscus formationO(10−2 s) is different from that in the experiments O(1 s), since the capillary number just in prior to the liquid contact with the particle in our simulation is larger than that in the experiment. 210
We monitor the temporal variation of the pressure distribution in the menis-cus during its formation process, which is difficult to be observed in the experi-ment. Figure 8 illustrates the spatio-temporal variation of the pressure around the particle at different y. At t = 15.0 ms, the contact line makes a contact with the particle to form the meniscus. The lines that are almost parallel to 215
Figure 6: Meniscus formation around a particle of a diameter 50 µm observed in a simulation. Vectors indicate the velocity on the meniscus surface. Note that the particle periphery at the same level in y as the front of the meniscus is illustrated in (a) for the sake of visibility.
the liquid near the substrate touches the particle, the contour at y = 0 is de-formed, and those at y = 5 and 10 exhibit almost straight shape. Due to the negative curvature of the liquid film to form the meniscus as aforementioned, the pressure in the meniscus around the partciel foot becomes negative (y = 0). 220
As time elapses, the contact line along the particle surface rises to form larger meniscus, the contour becomes deforms at higher positions (see y = 5 at t = 18, and y = 5 and 10 at t = 21). As the meniscus develops around the particle, the absolute value of negative pressure becomes smaller in the meniscus because the curvature radius becomes larger as illustrated in Fig. 7. One finds that there 225
exists negative gradient of the pressure around the particle in the x direction; the pressure in the upstream region against the particle becomes higher than the downstream region. This pressure gradient drives the liquid inside the meniscus toward the downstream side against the particle like a pump. It is obvious that the distribution of the pressure is symmetrical about the plane of z = zp. In 230
the following we will discuss the pressure distribution in that plane.
As shown in Fig. 9 (a), the pressure inside the meniscus is lower than the atmospheric pressure at an initial stage (t = 15.0 ms). As the liquid film rises around the particle, the pressure inside the meniscus increases towards
Figure 7: Temporal variation of meniscus profile around a particle on plane of z = zp by
numerical simulation.First profile corresponds to the meniscus surface at t = 0.015 s and the time interval between profiles is of 0.0002 s. Inset illustrates temporal variations of angular position φCLof the meniscus front on the particle and the position of CL on the substrate
XCL.
the atmospheric pressure because of the diminishing curvature caused by the 235
ongoing advancement of the CL (t = 15.0 to 21.0 ms) as shown in Fig. 7 as well. At the same time, the pressure difference between upstream and downstream sides is generated inside the meniscus at the particle foot (t = 18.0 ms), and it eventually diminishes (t = 21.0 ms). These results can be also explaneed by assuming that the Young-Laplace equation (4) is applicable to dynamical 240
wetting. As aforementioned, the pressure difference between the menisci on the upstream and downstream sides drives the liquid forward along the particle foot. The time evolution of the pressure difference ∆p = p(up)− p(down)inside the menisci on the upstream and the downstream sides and the CL velocity UCL are shown in Fig. 9 (b). Here, the pressures p(up) and p(down) are extracted 245
at xup and xdown, corresponding to (x, y, z) [µm] = (xp± 15, 2.5, zp). The CL velocity after the encounter with the particle (marked by the gray region in panel 9 (b) can be roughly classified into three regions of (I) acceleration, (II) deceleration, and (III) convergence. The volume function αupand αdown at the two points xup and xdown are also shown in the upper graph of Fig. 9 (b), 250
in order to show when the advancing contact line has reached the downstream evaluation point xdown. This happens at t = 14.5 ms. Before that instant, the pressure p(down)at x = x
y [µm] = 0
5
10
t
[ms] = 15.0
18.0
21.0
x z y α = 0.5 particle edgeP
[Pa]
0 -400 -800 -1200Figure 8:Spatio-temporal distributions of pressure at different height y.
the time trace of ∆p carries the signature of p(up). This pressure decreases when the meniscus starts to form on the upstream side of the particle, producing the 255
minimum in the ∆p trace. Then, as the meniscus forms around the particle foot and reaches xdown, ∆p becomes positive and reaches a maximum. This is due to the asymmetric nature of the meniscus, which displays a greater curvature on the downstream side. The CL velocity on the substrate reaches the maximum value slightly after it. From these results, we conclude that the meniscus plays a 260
role as a ‘pump’ to suck a liquid from the bulk of the film and supply it behind the particle due to the pressure difference inside the meniscus between the front (upstream) and rear (downstream) of the particle.
In order to investigate the detailed behavior of the liquid inside the meniscus, the pressure, the absolute velocity U , and the velocities in x-, y- and z-directions 265
in the liquid film around the particle on (x, y, z) = (xp, y, z) cross section are shown in Fig. 11. Initially the velocity in the x direction of the liquid
Figure 9: (a) Temporal variation of pressure around a particle on plane of z = zp. (b)
Temporal variations of pressure difference between upstream (at xup as shown in (a)) and
downstream (xdown) sides in meniscus, and CL velocity UCL. The monitoring points inside
the meniscus on the upstream and downstream sides are defined as xup = (135, 2.5, 150)
[µm], xdown= (165, 2.5, 150) [µm], respectively. Top of (b) indicates the temporal variation
of the volume fraction α measured at xup (αup) and at xdown(αdown). The position of CL
on the substrate cannot be well defined in the gray area.
Figure 10: Spatial-temporal variations of pressure, absolute velocity, and velocity component in each direction inside the meniscus formed around the particle on plane of (x, y, z) = (x, y,
Figure 11: viscous dissipation??
film, Ux, develops in the vicinity of the gas-liquid interface near the contact line on the particle, and then the large Ux region transit to the z direction as the liquid film rises around the particle (region (i)→ region (ii)). The small 270
region near the particle foot (region (iii)) prevents the liquid to supply forward because of the viscous effect. The variation of the position where the velocity becomes maximum corresponds to the transition of the dominant driving force to ‘pump’ the liquid toward downstream region from the pressure difference within the meniscus in the main flow direction to the interfacial tension acting 275
on the interface with the curvature (red square in Fig. 6 (a)). One finds that the distribution of Uxis almost the same as that of U , thus the pumping effect contributes the liquid transport almost along the x direction.
4. Concluding remarks
280
The physical mechanism behind the local acceleration of the contact line of a spreading droplet due to its interaction with a microparticle as reported by Mu
et al. [1, 23, 24] was investigated numerically and experimentally. The aim of
the numerical simulations was to access the physical data such as the pressure and velocity fields in the liquid film forming around the particle that were not 285
accessible experimentally. The experiments were used to validate the numerical simulations through the time-dependent shape taken by the meniscus around the particle’s foot. Numerical simulations reproduce the experimental observations of an accelerating microscopic contact line around the particle. In particular, the simulations similarly show that the particle-liquid film interaction enables 290
the microscopic contact line of a spreading of droplet to accelerate and overcome locally the commonly known power laws of Tanner or Lopez [12, 13, 14]. This result is of primary importance as it provides a numerical tool to predict the wetting dynamic of a substrate by a liquid with respect to topological conditions. The simulations were limited to small capillary numbers Ca = µUCL/γ ∼ 295
O(10−4) to O(10−6). In order to unravel the physics behind the contact line acceleration, a particular focus was made in studying the process of meniscus formation right after the contact of the contact line with the particle. Three regimes of behaviour for the contact line were identified: an accelerating, a decelerating, and a converging regime [21]. It is found that the characteris-300
tic time for the meniscus formation around the particle becomes of the order ofO(10−2 s) which is much longer than that reported in the literature for the fully wetting of a smooth substrate by a liquid [27]. Furthermore, the relaxation of the Laplace pressure occurs within a long characteristic time of the order of
µDp/2γ ∼ O(10−6 s). This long characteristic time is linked to the significant 305
limitation of the liquid within a liquid film. Indeed, the pressure difference be-tween the upstream and downstream regions of the meniscus around the particle is behind the pumping mechanism that delivers the liquid from the bulk to the contact line behind the particle. Once the pressure difference vanishes the local
contact line around the particle decelerates till it is matched by the main contact 310
line of the spreading droplet that follows the Tanner’s law [13]. Those findings leads a comprehensive description of the enhancement of the droplet spreading on the microstructured solid surfaces [16, 17, 18, 19, 20]. We will apply these findings and the numerical simulations to optimize the wetting of a microstruc-tured surface. It will, in particular, be used to unravel the physical mechanism 315
behind the dynamics of successive accelerations experienced by a contact line through an array of pillars reported by [24, 28] where the local acceleration of the contact line can reach up to 100 times that of a spreading droplet on a smooth substrate. Such understanding and data are of primary importance for designing economical and low-energy consuming liquid transport devices, 320
for example, in optimal designing of hemiwicking structures for heat-pipe wicks for improving the performance of lithium-ion batteries by structuring electrode surfaces [29].
Acknowledgment
This work was partially supported from Japan Society for the Promotion of 325
Science (JSPS) by Grant-in-Aid for Challenging Exploratory Research (grant number: 16K14176) and by Grant-in-Aid for Scientific Research (grant num-ber: 19H02083). Authors acknowledge a financial support from MAE (French Ministry of Foreign Affairs and International Development) as well as from JSPS through the PHC Sakura program ‘Wetting dynamics in the presence of 330
particles.’ This work benefited from the support of the project FEFS ANR-CE21-2018 of the French National Research Agency (ANR).
Appendix
Validation of Laplace pressure measurement
Laplace pressure ∆pgl of a meniscus developing around a spherical particle 335
is estimated from its profile in the x− y plane, forms around the particle foot, as seen in Fig. 3 (b, c). The profile x = ξ (y) of an axisymmetric meniscus
with a constant Laplace pressure is a solution of the Eqs. 4. Note that ∆pgl in Eqs. 4 is the average of the pressures at the meniscus surface ξ (y) given by the following:
340
(a)
(b)
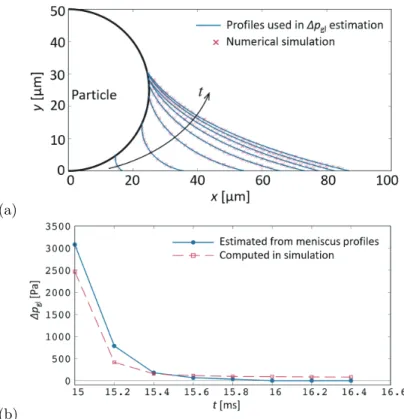
Figure A.1: (a) Profiles of a downstream side of meniscus developing around a spherical particle at t = 15, 15.2, 15.4, 15.6, 15.8, 16, 16.2, and 16.4 ms. Profiles determined in a numerical simulation and theoretical ones are compared. The latter profiles are used to estimate Laplace pressure ∆pgl. (b) Temporal variation of the pressure difference ∆pgl at
gas-liquid interface of downstream side of meniscus by estimation based on Laplace pressure and simulation. ∆pgl= ∑N n=2 1 2 ( xn−1+ xn)sn· 12 ( ∆pngl−1+ ∆pngl ) ∑N n=2 1 2(x n−1+ xn) sn (5) where sn= √
(xn− xn−1)2+ (yn− yn−1)2, and (xn, yn) are the coordinates of a meniscus surface.
In order to compare the best fitting profiles and the results of numerical simulation, the profile obtained from the result of simulation using Eqs. 4 is overwritten again, and agree well as shown in Fig. A.1 (a). Figure A.1 (b) 345
shows the comparison between the pressure at the gas-liquid interface by esti-mated from the profiles of Fig. A.1 (a) and computed by simulation. A slight decrease of ∆pgl with y is observed and trends are consistent. From the above, this Laplace pressure measurement is valid enough to indicate the relationship between the CL velocity and the pressure difference inside the meniscus, which 350
are estimated by the meniscus profiles, in the experiment.
References
[1] L. Mu, D. Kondo, M. Inoue, T. Kaneko, H. N. Yoshikawa, F. Zoueshtiagh, I. Ueno, Sharp acceleration of a macroscopic contact line induced by a particle, Journal of Fluid Mechanics 830 (2017) R1.
355
[2] W. Barthlott, C. Neinhuis, Purity of the sacred lotus, or escape from con-tamination in biological surfaces, Planta 202 (1997) 1–8.
[3] H. Chen, P. Zhang, L. Zhang, H. Liu, Y. Jiang, D. Zhang, Z. Han, L. Ji-nag, Continuous directional water transport on the peristome surface of nepenthes alata, Nature 532 (2016) 85–89.
360
[4] D. L. Hu, J. W. M. Bush, Meniscus-climbing insects, Nature 437 (2005) 733–736.
[5] H. Jouhara, A. Chauhan, T. Nannou, S. Almahmoud, B. Delpech, L. C. Wrobel, Heat pipe based systems - advances and applications, Energy 128 (2017) 729–754.
365
[6] D. E. Kataoka, S. M. Troian, Patterning liquid flow on the microscopic scale, Nature 402 (1999) 794–797.
[7] B. L. Kessenich, N. Pokhrel, E. Nakouzi, C. J. Newcomb, M. Flury, L. Maibaum, J. J. D. Yoreo, Connecting wettability, topography, and
chem-istry in a simple lipid-montmorillonite system, Journal of Colloid and In-370
terface Science 555 (2019) 498–508.
[8] K. M. Ang, L. Y. Yeo, Y. M. Hung, M. K. Tan, Graphene-mediated mi-crofluidic transport and nebulization via high frequency rayleigh wave sub-strate excitation, Lab on a Chip 16 (2016) 3503–3514.
[9] S. Ross, P. Becher, The history of the spreading coefficient, Journal of 375
Colloid and Interface Science 149 (2) (1992) 575–579.
[10] T. Young, An essay on the cohesion of fluids, Philosophical Transactions of the Royal Scociety of London 95 (1805) 65–87.
[11] R. L. Hoffman, A study of the advancing interface. i. interface shape in liquid-gas systems -, Journal of Colloid and Interface Science 50 (2) (1975) 380
228–241.
[12] J. Lopez, C. A. Miller, E. Ruckenstein, Spreading kinetics of liquid drops on solids, Journal of Colloid and Interface Science 56 (3) (1976) 460–468. [13] L. H. Tanner, The spreading of silicone oil drops on horizontal surfaces,
Journal of Physics D: Applied Physics 12 (1979) 1473–1484. 385
[14] A.-M. Cazabat, M. A. C. Stuart, Dynamics of wetting: effects of surface roughness, Journal of Physical Chemistry 90 (22) (1986) 5845–5849. [15] R. N. Wenzel, Resistance of solid surfaces to wetting by water, Industrial
and Engineering Chemistry 28 (8) (1936) 988–994.
[16] L. Courbin, E. Denieul, E. Dressaire, M. Roper, A. Ajdari, H. A. Stone, 390
Imbibition by polygonal spreading on microdecorated surfaces, Nature Ma-terials 6 (2007) 661–664.
[17] R. Xiao, E. N. Wang, Microscale liquid dynamics and the effect on macroscale propagation in pillar arrays, Langmuir 27 (2011) 10360–10364.
[18] N. Obara, K. Okumura, Imbibition of a textured surface decorated by short 395
pillars with rounded edges, Physical Review E 86 (2012) 020601(R). [19] J. Wang, M. Do-Quang, J. J. Cannon, F. Yue, Y. Suzuki, G. Amberg,
J. Shiomi, Surface structure determines dynamic wetting, Scientific Reports 5 (2015) 8474.
[20] J. Kim, M.-W. Moon, H.-Y. Kim, Dynamics of hemiwicking, Journal of 400
Fluid Mechanics 800 (2016) 57–71.
[21] D. Kondo, L. Mu, F. de Miollis, T. Ogawa, M. Inoue, T. Kaneko, T. Tsuka-hara, H. N. Yoshikawa, F. Zoueshtiagh, I. Ueno, Acceleration of the macro-scopic contact line of a droplet spreading on a substrate after interaction with a particle, International Journal of Microgravity Science and Appli-405
cation 34 (4) (2017) 340405.
[22] R. G. Cox, The dynamics of the spreading of liquids on a solid surface. part 1. viscous flow, Journal of Fluid Mechanics 168 (1986) 169–194.
[23] L. Mu, H. N. Yoshikawa, D. Kondo, T. Ogawa, M. Kiriki, F. Zoueshtiagh, M. Motosuke, T. Kaneko, I. Ueno, Control of local wetting by microscopic 410
particles, Colloids and Surfaces A 555 (2018) 615–620.
[24] L. Mu, H. N. Yoshikawa, F. Zoueshtiagh, T. Ogawa, M. Motosuke, I. Ueno, Quick liquid propagation on a linear array of micropillars, Langmuir 35 (2019) 9139–9145.
[25] C. W. Hirt, B. D. Nichols, Volume of fluid (vof) method for the dynamics 415
of free boundaries, Journal of Computational Physics 39 (1981) 201–225. [26] J. U. Brackbill, D. B. Kothe, C. Zemach, A continuum method for modeling
surface tension, Journal of Computational Physics 100 (2) (1992) 335–354. [27] A.-L. Biance, C. Clanet, D. Q. r , First steps in the spreading of a liquid
droplet, Physical Review E 69 (2004) 016301. 420
[28] E. Spruijt, E. L. Guludec, C. Lix, M. Wagner, D. Qu´er´e, Liquid filmification from menisci, Europhysics Letters 112 (2015) 16002.
[29] W. Pfleging, A review of laser electrode processing for development and manufacturing of lithium-ion batteries, Nanophotonics 7 (2018) 549–573.