HAL Id: hal-02333021
https://hal.sorbonne-universite.fr/hal-02333021
Preprint submitted on 25 Oct 2019
HAL is a multi-disciplinary open access
archive for the deposit and dissemination of sci-entific research documents, whether they are pub-lished or not. The documents may come from teaching and research institutions in France or abroad, or from public or private research centers.
L’archive ouverte pluridisciplinaire HAL, est destinée au dépôt et à la diffusion de documents scientifiques de niveau recherche, publiés ou non, émanant des établissements d’enseignement et de recherche français ou étrangers, des laboratoires publics ou privés.
Méziane Aite, Komlan Avia, Christophe Caron, Chung Cho, Jonas Collen,
Alexandre Cormier, et al.
To cite this version:
Simon Dittami, Erwan Corre, Loraine Brillet-Guéguen, Agnieszka Lipinska, Méziane Aite, et al.. The genome of Ectocarpus subulatus -a highly stress-tolerant brown alga. 2019. �hal-02333021�
The genome of Ectocarpus subulatus – a
1highly stress-tolerant brown alga
2Simon M. Dittami1*, Erwan Corre2, Loraine Brillet-Guéguen1,2, Agnieszka P. Lipinska1, Noé 3
Pontoizeau1,2, Meziane Aite3, Komlan Avia1,4, Christophe Caron2†, Chung Hyun Cho5, Jonas Collén1, 4
Alexandre Cormier1, Ludovic Delage1, Sylvie Doubleau6, Clémence Frioux3, Angélique Gobet1, 5
Irene González-Navarrete7, Agnès Groisillier1, Cécile Hervé1, Didier Jollivet8, Hetty KleinJan1, 6
Catherine Leblanc1, Xi Liu2, Dominique Marie8, Gabriel V. Markov1, André E. Minoche7,9, Misharl 7
Monsoor2, Pierre Pericard2, Marie-Mathilde Perrineau1, Akira F. Peters10, Anne Siegel3, Amandine 8
Siméon1, Camille Trottier3, Hwan Su Yoon5, Heinz Himmelbauer7,9,11, Catherine Boyen1, Thierry 9
Tonon1,12 10
11 1
Sorbonne Université, CNRS, Integrative Biology of Marine Models (LBI2M), Station Biologique 12
de Roscoff, 29680 Roscoff, France 13
2
CNRS, Sorbonne Université, FR2424, ABiMS platform, Station Biologique de Roscoff, 29680, 14
Roscoff, France 15
3
Institute for Research in IT and Random Systems - IRISA, Université de Rennes 1, France 16
4
Université de Strasbourg, INRA, SVQV UMR-A 1131, F-68000 Colmar, France 17
5
Department of Biological Sciences, Sungkyunkwan University, Suwon 16419, Republic of Korea 18
6
IRD, UMR DIADE, 911 Avenue Agropolis, BP 64501, 34394 Montpellier, France 19
7
Centre for Genomic Regulation (CRG), The Barcelona Institute of Science and Technology, Dr. 20
Aiguader 88, Barcelona, 08003 Spain 21
8
Sorbonne Université, CNRS, Adaptation and Diversity in the Marine Environment (ADME), 22
Station Biologique de Roscoff (SBR), 29680 Roscoff, France 23
9
Max Planck Institute for Molecular Genetics, 14195 Berlin, Germany 24
10
Bezhin Rosko, 40 Rue des Pêcheurs, 29250 Santec, France 25
11
Department of Biotechnology, University of Natural Resources and Life Sciences (BOKU), 26
Vienna, 1190 Vienna, Austria 27
12
Centre for Novel Agricultural Products, Department of Biology, University of York, Heslington, 28
York, YO10 5DD, United Kingdom. 29 † Deceased 30 31 *
Correspondence: simon.dittami@sb-roscoff.fr, phone +33 29 82 92 362, fax +33 29 82 92 324. 32
Abstract
34 35
Brown algae are multicellular photosynthetic stramenopiles that colonize marine rocky shores 36
worldwide. Ectocarpus sp. Ec32 has been established as a genomic model for brown algae. Here we 37
present the genome and metabolic network of the closely related species, Ectocarpus subulatus 38
Kützing, which is characterized by high abiotic stress tolerance. Since their separation, both strains 39
show new traces of viral sequences and the activity of large retrotransposons, which may also be 40
related to the expansion of a family of chlorophyll-binding proteins. Further features suspected to 41
contribute to stress tolerance include an expanded family of heat shock proteins, the reduction of 42
genes involved in the production of halogenated defence compounds, and the presence of fewer cell 43
wall polysaccharide-modifying enzymes. Overall, E. subulatus has mainly lost members of gene 44
families down-regulated in low salinities, and conserved those that were up-regulated in the same 45
condition. However, 96% of genes that differed between the two examined Ectocarpus species, as 46
well as all genes under positive selection, were found to encode proteins of unknown function. This 47
underlines the uniqueness of brown algal stress tolerance mechanisms as well as the significance of 48
establishing E. subulatus as a comparative model for future functional studies. 49
Introduction
51
Brown algae (Phaeophyceae) are multicellular photosynthetic organisms that are successful 52
colonizers of rocky shores in the world’s oceans. In many places they constitute the dominant 53
vegetation in the intertidal zone, where they have adapted to multiple stressors including strong 54
variations in temperature, salinity, irradiation, and mechanical stress (wave action) over the tidal 55
cycle1. In the subtidal environment, brown algae form kelp forests that harbor highly diverse 56
communities2. They are also harvested as food or for industrial purposes, such as the extraction of 57
alginates3. The worldwide annual harvest of brown algae has reached 10 million tons in 2014 and is 58
constantly growing4. Brown algae share some basic photosynthetic machinery with land plants, but 59
their plastids derived from a secondary or tertiary endosymbiosis event with a red alga, and they 60
belong to an independent lineage of eukaryotes, the stramenopiles5. This phylogenetic background, 61
together with their distinct habitat, contributes to the fact that brown algae have evolved numerous 62
unique metabolic pathways, life cycle features, and stress tolerance mechanisms. 63
To enable functional studies of brown algae, strain Ec32 of the small filamentous alga Ectocarpus 64
sp. has been established as a genetic and genomic model6–8. This strain was formerly described as 65
Ectocarpus siliculosus, but has since been shown to belong to an independent clade by molecular
66
methods9,10. More recently, three additional brown algal genomes, that of the kelp species 67
Saccharina japonica11, that of Cladosiphon okamuranus12, and that of Nemacystus decipiens13, have 68
been characterized. Comparisons between these four genomes have allowed researchers to obtain a 69
first overview of the unique genomic features of brown algae, as well as a glimpse of the genetic 70
diversity within this group. However, given the evolutionary distance between these algae, it is 71
difficult to link genomic differences to physiological differences and possible adaptations to their 72
lifestyle. To be able to generate more accurate hypotheses on the role of particular genes and 73
genomic features for adaptive traits, a common strategy is to compare closely related strains and 74
species that differ only in a few genomic features. The genus Ectocarpus is particularly well suited 75
for such comparative studies because it comprises a wide range of morphologically similar but 76
genetically distinct strains and species that have adapted to different marine and brackish water 77
environments9,14–16. One species within this group, Ectocarpus subulatus Kützing10, comprises 78
isolates highly resistant to elevated temperature17 and low salinity. A strain of this species was even 79
isolated from freshwater18, constituting one of the handful of known marine-freshwater transitions in 80
brown algae19. 81
Here we present the draft genome and metabolic network of a strain of E. subulatus, establishing the 82
genomic basis for its use as a comparative model to study stress tolerance mechanisms, and in 83
particular low salinity tolerance, in brown algae. Similar strategies have been successfully employed 84
in terrestrial plants, where “extremophile” relatives of model- or economically relevant species have 85
been sequenced to explore new stress tolerance mechanisms in the green lineage20–25. The study of 86
the E. subulatus genome, and subsequent comparative analysis with other brown algal genomes, in 87
particular that of Ectocarpus sp. Ec32, provides insights into the dynamics of Ectocarpus genome 88
evolution and divergence, and highlights important adaptive processes, such as a potentially 89
retrotransposon driven expansion of the family of chlorophyll-binding proteins with subsequent 90
diversification. Most importantly, our analyses underline that most of the observed differences 91
between the examined species of Ectocarpus correspond to proteins with yet unknown functions. 92
Results
93
Sequencing and assembly of the E. subulatus genome
94
A total of 34.7Gb of paired-end read data and of 28.8Gb of mate-pair reads (corresponding to 45 95
million non-redundant mate-pairs) were acquired (Supporting Information Table S1). The final 96
genome assembly size of strain Bft15b was 227Mb (Table 1), and we also obtained 123Mb of 97
bacterial contigs corresponding predominantly to Alphaproteobacteria (50%, with the dominant 98
genera Roseobacter 8% and Hyphomonas 5%), followed by Gammaproteobacteria (18%), and 99
Flavobacteria (13%). The mean sequencing coverage of mapped reads was 67X for the paired-end
100
library, and the genomic coverage was 6.9, 14.4, and 30.4X for the 3kb, 5kb, and 10kb mate-pair 101
libraries, respectively. RNA-seq experiments yielded 8.8Gb of RNA-seq data, of which 96.6% 102
(Bft15b strain in seawater), 87.6% (freshwater strain in seawater), and 85.3% (freshwater strain in 103
freshwater) aligned with the final genome assembly of the Bft15b strain. 104
Gene prediction and annotation
105
The number of predicted proteins in E. subulatus was 60% higher than that predicted for Ec32 106
(Table 1), mainly due to the presence of mono-exonic genes, many of which corresponded to 107
transposases, which were not removed from our predictions, but had been manually removed from 108
the Ec32 genome. Ninety-eight percent of the gene models were supported by at least one associated 109
RNA-seq read, and 92% were supported by at least ten reads, with lowly-expressed (<10 reads) 110
genes being generally shorter (882 vs 1,403 bases), and containing fewer introns (2.6 vs 5.7). In 111
7.3% of all predicted proteins we detected a signal peptide, and 3.7% additionally contained an 112
‘ASAFAP’-motif (Supporting Information Table S2) indicating that they are likely targeted to the 113
plastid26. Overall the BUSCO27 analyses indicate that the E. subulatus genome is 86% complete 114
(complete and fragmented genes) and 91% when not considering proteins also absent from all other 115
currently sequenced brown algae (Table 1). 116
Repeated elements
117
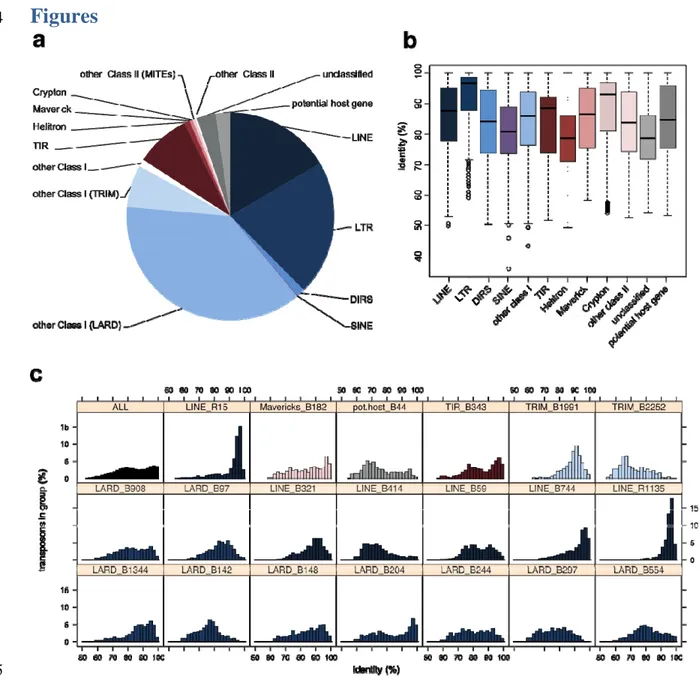
Thirty percent of the E. subulatus genome consisted of repeated elements. The most abundant groups 118
of repeated elements were large retrotransposon derivatives (LARDs), followed by long terminal 119
repeats (LTRs, predominantly Copia and Gypsy), and long and short interspersed nuclear elements 120
(LINEs, Figure 1A). The overall distribution of sequence identity levels within superfamilies showed 121
two peaks, one at an identity level of 78-80%, and one at 96-100% (Figure 1C). An examination of 122
transposon conservation at the level of individual families revealed a few families that follow this 123
global bimodal distribution (e.g. TIR B343 or LARD B204), while the majority exhibited a 124
unimodal distribution with peaks either at high (e.g. LINE R15) or at lower identity levels (e.g. 125
LARD B554) (Figure 1C). Terminal repeat retrotransposons in miniature (TRIM) and LARDs, both 126
non-autonomous groups of retrotransposons, were among the most conserved families. A detailed 127
list of transposons is provided in Supporting Information Table S3. In line with previous 128
observations carried out in Ectocarpus sp. Ec32, no methylation was detected in the E. subulatus 129
genomic DNA. 130
Organellar genomes
131
Plastid and mitochondrial genomes from E. subulatus have 95.5% and 91.5% sequence identity with 132
their Ectocarpus sp. Ec32 counterparts in the conserved regions respectively. Only minor structural 133
differences were observed between organellar genomes of both Ectocarpus genomes, as detailed in 134
Supporting Information Text S1. 135
Global comparison of predicted proteomes
136
Metabolic network-based comparisons
137
Similar to the network previously obtained for Ectocarpus sp. Ec3228, the E. subulatus Bft15b 138
metabolic network comprised 2,074 metabolic reactions and 2,173 metabolites in 464 pathways, 139
which can be browsed at http://gem-aureme.irisa.fr/sububftgem. In total, 2,445 genes associated with 140
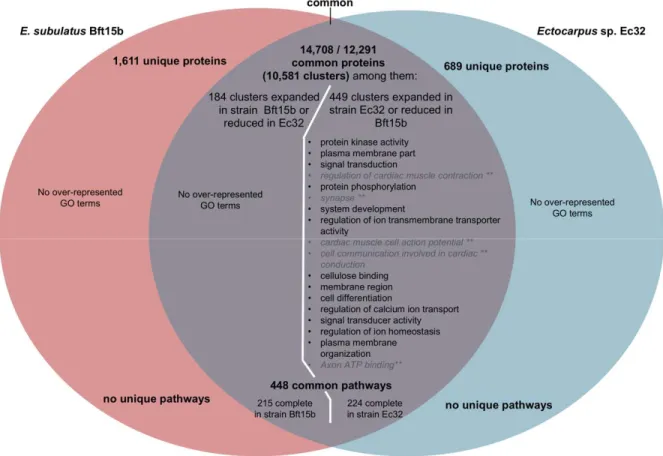
at least one metabolic reaction, and 215 pathways were complete (Figure 2). Comparisons between 141
both networks were carried out on a pathway level (Supporting Information Text S1, Section 142
“Metabolic network-based comparisons”), but no pathways were found to be truly specific to either 143
Ec32 and/or Bf15b. 144
Genes under positive selection
145
Out of the 2,311 orthogroups with single-copy orthologs that produced high quality alignments, 172 146
gene pairs (7.4%) exhibited dN/dS ratios > 0.5 (Supporting Information Table S4). Among these, 147
only eleven (6.4%) were found to fit significantly better with the model allowing for positive 148
selection in the Ectocarpus branch. These genes are likely to have been under positive selection, and 149
two of them contained a signal peptide targeting the plastid. All of them are genes specific to the 150
brown algal lineage with unknown function, and only two genes contained protein domains related 151
to a biochemical function (one oxidoreductase-like domain, and one protein prenyltransferase, alpha 152
subunit). However, all of them were expressed at least in E. subulatus Bft15b. There was no trend 153
for these genes to be located in specific regions of the genome (all except two for Ectocarpus sp. 154
Ec32 were on different scaffolds) and none of the genes were located in the pseudoautosomal region 155
of the sex chromosome. 156
Genes specific to either Ectocarpus genome, and expanded genes and gene families
157
After manual curation based on tblastn searches to eliminate artefacts arising from differences in the 158
gene predictions, 184 expanded gene clusters and 1,611 predicted proteins were found to be specific 159
to E. subulatus compared to Ectocarpus sp., while 449 clusters were expanded and 689 proteins 160
were found specifically in the latter (Figure 2, Supporting Information Table S5). This is far less 161
than the 2,878 and 1,093 unique clusters found for a recent comparison of N. decipiens and C. 162
okamuranus13. Gene set enrichment analyses revealed no GO categories to be significantly over-163
represented among the genes unique to or expanded in E. subulatus Bft15b, but several categories 164
were over-represented among the genes and gene families specific to or expanded in the Ectocarpus 165
sp. Ec32 strain. Many were related either to signalling pathways or to the membrane and transporters 166
(Figure 2), but it is difficult to distinguish between the effects of a potentially incomplete genome 167
assembly and true gene losses in Bft15b. In the manual analyses we therefore focussed on the genes 168
specific to and expanded in E. subulatus. 169
Among the 1,611 E. subulatus-specific genes, 1,436 genes had no homologs (e-value < 1e-5) in the 170
UniProt database as of May 20th 2016: they could thus, at this point in time, be considered lineage-171
specific and had no function associated to them. Among the remaining 175 genes, 145 had hits (e-172
value < 1e-5) in Ectocarpus sp. Ec32, i.e. they likely correspond to multi-copy genes that had 173
diverged prior to the separation of Ectocarpus and S. japonica, and for which the Ectocarpus sp. 174
Ec32 and S. japonica orthologs were lost. Thirteen genes had homology only with uncharacterized 175
proteins or were too dissimilar from characterized proteins to deduce hypothetical functions; another 176
eight probably corresponded to short viral sequences integrated into the algal genome 177
(EsuBft1730_2, EsuBft4066_3, EsuBft4066_2, EsuBft284_15, EsuBft43_11, EsuBft551_12, 178
EsuBft1883_2, EsuBft4066_4), and one (EsuBft543_9) was related to a retrotransposon. Two 179
adjacent genes (EsuBft1157_4, EsuBft1157_5) were also found in diatoms and may be related to the 180
degradation of cellobiose and the transport of the corresponding sugars. Two genes, EsuBft1440_3 181
and EsuBft1337_8, contained conserved motifs (IPR023307 and SSF56973) typically found in toxin 182
families. Two more (EsuBft1006_6 and EsuBft308_11) exhibited low similarities to animal and 183
fungal transcription factors, and the last (EsuBft36_20 and EsuBft440_20) consisted almost 184
exclusively of short repeated sequences of unknown function (“ALEW” and 185
“GAAASGVAGGAVVVNG”, respectively). In total, 1.7% contained a signal peptide targeting the 186
plastid, i.e. significantly less than the 3.7% in the entire dataset (Fisher exact test, p<0.0001). 187
The large majority of Ectocarpus sp. Ec32-specific proteins (511) also corresponded to proteins of 188
unknown function without matches in public databases. Ninety-seven proteins were part of the E. 189
siliculosus virus-1 (EsV-1) inserted into the Ec32 genome and the remaining 81 proteins were poorly
190
annotated, usually only via the presence of a domain. Examples are ankyrin repeat-containing 191
domain proteins (12), Zinc finger domain proteins (6), proteins containing wall sensing component 192
(WSC) domains (3), protein kinase-like proteins (3), and Notch domain proteins (2). 193
Regarding the 184 clusters of expanded genes in E. subulatus, 139 (1,064 proteins) corresponded to 194
proteins with unknown function, 98% of which were found only in Ectocarpus. Furthermore, nine 195
clusters (202 proteins) represented sequences related to transposons predicted in both genomes, and 196
eight clusters (31 proteins) were similar to known viral sequences. Only 28 clusters (135 proteins) 197
could be roughly assigned to biological functions (Table 2). They comprised proteins potentially 198
involved in modification of the cell-wall structure (including sulfation), in transcriptional regulation 199
and translation, in cell-cell communication and signalling, as well as a few stress response proteins, 200
notably a set of HSP20s, and several proteins of the light-harvesting complex (LHC) potentially 201
involved in non-photochemical quenching. Only 0.6% of all genes expanded in Bft15b contained a 202
signal peptide targeting the plastid, i.e. significantly less than the 3.7% in the entire dataset (Fisher 203
exact test, p<0.0001). 204
Striking examples of likely expansions in Ectocarpus sp. Ec32 or reduction in E. subulatus Bft15b 205
were different families of serine-threonine protein kinase domain proteins present in 16 to 25 copies 206
in Ec32 compared to only 5 or 6 in Bft15b, Kinesin light chain-like proteins (34 vs. 13 copies), two 207
clusters of Notch region containing proteins (11 and 8 vs. 2 and 1 copies), a family of unknown 208
WSC domain containing proteins (8 copies vs. 1), putative regulators of G-protein signalling (11 vs. 209
4 copies), as well as several expanded clusters of unknown and viral proteins. However, these results 210
need to be taken with caution because the E. subulatus Bft15b genome was less complete than that 211
of Ectocarpus sp. Ec32. 212
Correlation with gene expression patterns
213
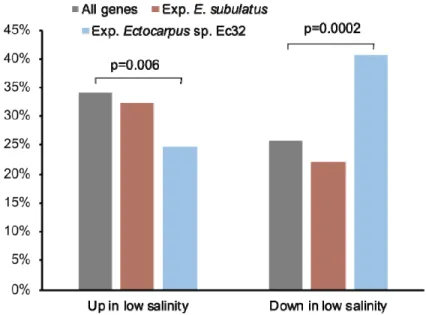
To assess whether genomic adaptations in E. subulatus Bft15b were located preferentially in genes 214
that are known to be responsive to salinity stress, we compared expanded gene families to previously 215
available expression data obtained for a freshwater strain of E. subulatus grown in freshwater vs 216
seawater29. This analysis revealed that genes that were down-regulated in response to low salinity 217
were significantly over-represented among the gene families expanded in Ectocarpus sp. Ec32 or 218
reduced in E. subulatus Bft15b, (42% of genes vs 26% for all genes; Fischer exact test p=0.0002), 219
while genes that were upregulated in response to low salinity were significantly under-represented 220
(25% vs 33%; Fischer exact test p=0.006; Figure 3, Supporting Information Table S6). This 221
indicates that E. subulatus Bft15b has mainly lost members of gene families that were generally 222
down-regulated in low salinities, and conserved those that were upregulated in this condition. 223
Targeted manual annotation of specific pathways
224
In addition to the global analyses carried out above, genes related to cell wall metabolism, sterol 225
metabolism, polyamine and central carbon metabolism, algal defence metabolites, transporters, and 226
abiotic stress response were manually examined and annotated, because, based on literature studies, 227
these functions could be expected to explain the physiological differences between E. subulatus 228
Bft15b and Ectocarpus sp. Ec32. Overall the differences between both Ectocarpus strains with 229
respect to these genes were minor; a detailed description of these results is available in Supporting 230
Information Text S1 and Supporting Information Table S7, and a brief overview of the main 231
differences is presented below. 232
Regarding gene families reduced in E. subulatus Bft15b or expanded in Ectocarpus sp. Ec32, the E. 233
subulatus genome encoded only 320 WSC-domain containing proteins, vs. 444 in Ectocarpus sp..
234
Many of these genes were down-regulated in response to low salinity, (61% of the WSC domain 235
containing genes with available expression data; Fischer exact test, p=0.0004) while only 7% were 236
upregulated (Fischer exact test, p-value=0.0036). In yeast, WSC domain proteins may act as cell 237
surface mechanosensors and activate the intracellular cell wall integrity signalling cascade in 238
response to hypo-osmotic shock30. Whether or not they have similar functions in brown algae, 239
however, remains to be established. Furthermore, we found fewer aryl sulfotransferase, tyrosinases, 240
potential bromoperoxidases, and thyroid peroxidases in the E. subulatus genome compared to 241
Ectocarpus sp., and it entirely lacks haloalkane dehalogenases (Supporting Information Text S1). All
242
of these enzymes are involved in the production of polyphenols and halogenated defence 243
compounds, suggesting that E. subulatus may be investing less energy in defence, although a 244
potential bias induced by differences in the assembly completeness cannot be excluded here. 245
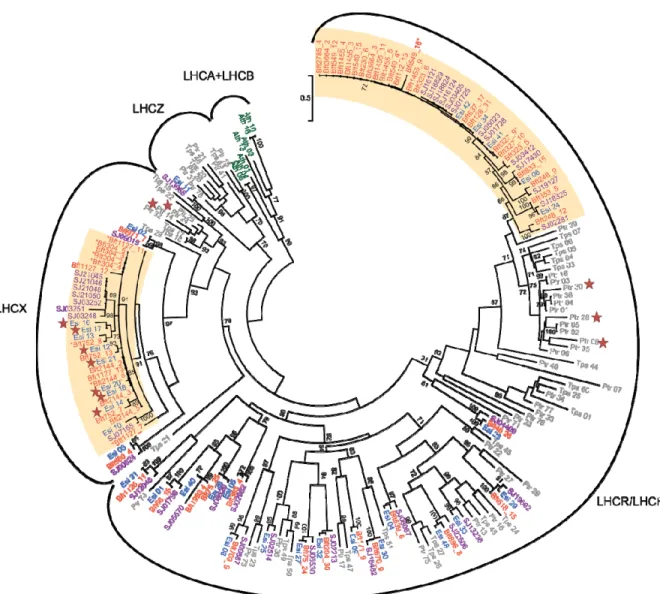
Regarding gene families expanded in E. subulatus Bft15b or reduced in Ectocarpus sp. Ec32, we 246
detected differences with respect to a few “classical” stress response genes. Notably an HSP20 247
protein was present in three copies in the genome of E. subulatus and only one copy in Ectocarpus 248
sp.. We also found a small group of LHCX-family chlorophyll-binding proteins (CBPs) as well as a 249
larger group belonging to the LHCF/LHCR family that have probably undergone a recent expansion 250
in E. subulatus (Figure 4). Some of the proteins appeared to be truncated (marked with asterisks), 251
but all of them were associated with RNA-seq reads, suggesting that they may be functional. A 252
number of these proteins were also flanked by LTR-like sequences. CBPs have been reported to be 253
up-regulated in response to abiotic stress in stramenopiles31,32, including Ectocarpus33, probably as a 254
way to deal with excess light energy when photosynthesis is affected. 255
Discussion
256
Here we present the draft genome and metabolic network of E. subulatus strain Bft15b, a brown alga 257
which, compared to Ectocarpus sp. Ec32, is characterized by high abiotic stress tolerance10,17. Based 258
on time-calibrated molecular trees, both species separated roughly 16 Mya29, i.e. slightly before the 259
split between Arabidopsis thaliana and Thellungiella salsuginea (7-12 Mya)34. This split was 260
probably followed by an adaptation of E. subulatus to highly fluctuating and low salinity habitats19. 261
Traces of recent transposon activity and integration of viral sequences
262
The E. subulatus Bft15b genome is only approximately 6% (flow cytometry) to 23% (genome 263
assembly) larger than that of Ectocarpus sp. Ec32, and no major genomic rearrangements or 264
duplications were detected. However, we observed traces of recent transposon activity, especially 265
from LTR transposons, which is in line with the absence of DNA methylation. Bursts in transposon 266
activity have been identified as one potential driver of local adaptation and speciation in other model 267
systems such as salmon35 or land plants34,36. Furthermore, LTRs are known to mediate the 268
retrotransposition of individual genes, leading to the duplication of the latter37. In E. subulatus 269
Bft15b, only a few expansions of gene families were observed since the separation from Ectocarpus 270
sp. Ec32, and only in the case of the recent expansion of the LHCR family were genes flanked by a 271
pair of LTR-like sequences. These elements lacked both the group antigen (GAG) and reverse 272
transcriptase (POL) proteins, which implies that, if retro-transposition was the mechanism 273
underlying the expansion of this group of proteins, it would have depended on other active 274
transposable elements to provide these activities. 275
A second factor that has shaped the Ectocarpus genomes were viruses. Viral infections are a 276
common phenomenon in Ectocarpales38, and a well-studied example is the Ectocarpus siliculosus 277
virus-1 (EsV-1)39. It was found to be present latently in several strains of Ectocarpus sp. closely 278
related to strain Ec32, and has also been found integrated in the genome of the latter, although it is 279
not expressed7. As previously indicated by comparative genome hybridization experiments40, the E. 280
subulatus Bft15b genome does not contain a complete EsV-1 like insertion, although a few shorter
281
EsV-1-like proteins were found. Thus, the EsV-1 integration observed in Ectocarpus sp. Ec32 has 282
likely occurred after the split with E. subulatus, and the biological consequences of this insertion 283
remain to be explored. 284
Few classical stress response genes but no transporters involved in adaptation
285
One aim of this study was to identify genes that may potentially be responsible for the high abiotic 286
stress and salinity tolerance of E. subulatus. Similar studies on genomic adaptation to changes in 287
salinity or to drought in terrestrial plants have previously highlighted genes generally involved in 288
stress tolerance to be expanded in “extremophile” organisms. Examples are the expansion of 289
catalase, glutathione reductase, and heat shock protein families in desert poplar24, arginine 290
metabolism in jujube41, or genes related to cation transport, abscisic acid signalling, and wax 291
production in T. salsuginea34. In our study, we found that gene families reduced in E. subulatus 292
Bft15b compared to the marine Ectocarpus sp. Ec32 model have previously been shown to be 293
repressed in response to stress, whereas gene families up-regulated in response to stress had a higher 294
probability of being conserved. However, there are only few signs of known stress response gene 295
families among them, notably the two additional HSP20 proteins and an expanded family of CBPs. 296
E. subulatus Bft15b also has a slightly reduced set of genes involved in the production of
297
halogenated defence compounds that may be related to its habitat preference: it is frequently found 298
in brackish and even freshwater environments with low availability of halogens. It also specializes in 299
habitats with high levels of abiotic stress compared to most other brown algae, and may thus invest 300
less energy in defence against biotic stressors. 301
Another anticipated adaptation to life in varying salinities lies in modifications of the cell wall. 302
Notably, the content of sulfated polysaccharides is expected to play a crucial role as these 303
compounds are present in all marine plants and algae, but absent in their freshwater relatives42,43. 304
The fact that we found only small differences in the number of encoded sulfatases and 305
sulfotransferases indicates that the absence of sulfated cell-wall polysaccharides previously observed 306
in E. subulatus in low salinities44 is probably a regulatory effect or simply related to the lack of 307
sulfate in low salinity. This is also coherent with the wide distribution of E. subulatus in marine, 308
brackish water, and freshwater environments. 309
Finally, transporters have previously been described as a key element in plant adaptation to different 310
salinities45. Similar results have also been obtained for Ectocarpus in a study of quantitative trait loci 311
(QTLs) associated with salinity and temperature tolerance46. In our study, however, we found no 312
indication of genomic differences related to transporters between the two species. This observation 313
corresponds to previous physiological experiments indicating that Ectocarpus, unlike many 314
terrestrial plants, responds to strong changes in salinity as an osmoconformer rather than an 315
osmoregulator, i.e. it allows the intracellular salt concentration to adjust to values close to the 316
external medium rather than keeping the intracellular ion composition constant33. 317
Species-specific genes of unknown function are likely to play a dominant role in
318
adaptation
319
In addition to genes that may be directly involved in the adaptation to the environment, we found 320
several gene clusters containing domains potentially involved in cell-cell signalling that were 321
expanded in the Ectocarpus sp. Ec32 genome (Table 2), e.g. a family of ankyrin repeat-containing 322
domain proteins47. These observed differences may be, in part, responsible for the existing pre-323
zygotic reproductive barrier between the two examined species of Ectocarpus48. 324
The vast majority of genomic differences between the two investigated species of Ectocarpus, 325
however, corresponds to proteins of entirely unknown functions. All of the 11 gene pairs under 326
positive selection were unknown genes taxonomically restricted to brown algae. Of the 1,611 E. 327
subulatus Bft15b-specific genes, 88% were unknown. Most of these genes were expressed and are
328
thus likely to correspond to true genes; their absence from the Ectocarpus sp. Ec32 genome was also 329
confirmed at the nucleotide level. A large part of the mechanisms that underlie the adaptation to 330
different ecological niches in Ectocarpus may, therefore, lie in these genes of unknown function. 331
This can be partly explained by the fact that still only few brown algal genomes have been 332
sequenced, and that currently most of our knowledge on the function of their proteins is based on 333
studies in model plants, animals, yeast, or bacteria, which have evolved independently from 334
stramenopiles for over 1 billion years49. They differ from land plants even in otherwise highly 335
conserved aspects, for instance in their life cycles, cell walls, and primary metabolism50. Substantial 336
contributions of lineage-specific genes to the evolution of organisms and the development of 337
innovations have also been described for animal models51, and studies in basal metazoans 338
furthermore indicate that they are essential for species-specific adaptive processes52. 339
Despite the probable importance of these unknown genes for local adaptation, Ectocarpus may still 340
heavily rely on classical stress response genes for abiotic stress tolerance. Many of the gene families 341
known to be related to stress response in land plants (including transporters and genes involved in 342
cell wall modification), and for which no significant differences in gene contents were observed, 343
have previously been reported to be strongly regulated in response to environmental stress in 344
Ectocarpus29,33,53. This high transcriptomic plasticity is probably one of the features that allow 345
Ectocarpus to thrive in a wide range of environments, and may form the basis for its capacity to
346
further adapt to “extreme environments” such as freshwater18. 347
Conclusion and future work
348
We have shown that since the separation of E. subulatus and Ectocarpus sp. Ec32, both genomes 349
have been shaped partially by the activity of viruses and transposons, particularly large 350
retrotransposons. Over this period of time, E. subulatus has adapted to environments with high 351
abiotic variability including brackish water and even freshwater. We have identified a few genes that 352
likely contribute to this adaptation, including HSPs, CBPs, a reduction of genes involved in 353
halogenated defence compounds, or some changes in cell wall polysaccharide-modifying enzymes. 354
However, the majority of genes that differ between the two examined Ectocarpus species or that 355
may be under positive selection encode proteins of unknown function. This underlines the 356
fundamental differences that exist between brown algae and terrestrial plants or other lineages of 357
algae. Studies as the present one, i.e. without strong a priori assumptions about the mechanisms 358
involved in adaptation, are therefore essential to start elucidating the specificities of this lineage as 359
well as the various functions of the unknown genes. 360
Methods
361
Biological material. Haploid male parthenosporophytes of E. subulatus strain Bft15b (Culture
362
Collection of Algae and Protozoa CCAP accession 1310/34), isolated in 1978 by Dieter G. Müller in 363
Beaufort, North Carolina, USA, were grown in 14 cm (100 ml) Petri Dishes in Provasoli-enriched 364
seawater54 under a 14/10 daylight cycle at 14°C. Strains were exanimated by light microscopy (800X 365
magnification, phase contrast) to ensure that they were free of contaminating eukaryotes, but did still 366
contain some alga-associated bacteria. Approximately 1 g fresh weight of algal culture was dried on 367
a paper towel and immediately frozen in liquid nitrogen. For RNA-seq experiments, in addition to 368
Bft15b, a second strain of E. subulatus, the diploid freshwater strain CCAP 1310/196 isolated from 369
Hopkins River Falls, Australia18, was included. One culture was grown as described above for 370
Bft15b, and for a second culture, seawater was diluted 20-fold with distilled water prior to the 371
addition of Provasoli nutrients29 (culture condition referred to as freshwater). 372
Flow cytometry experiments to measure nuclear DNA contents were carried out as previously
373
described55, except that young sporophyte tissue was used instead of gametes. Samples of the 374
genome-sequenced Ectocarpus sp. strain Ec32 (CCAP accession 1310/4 from San Juan de Marcona, 375
Peru) were run in parallel as a size reference. 376
DNA and RNA were extracted using a phenol-chloroform-based protocol56. For DNA sequencing, 377
four Illumina libraries were prepared and sequenced on a HiSeq2000: one paired-end library 378
(Illumina TruSeq DNA PCR-free LT Sample Prep kit #15036187, sequenced with 2x100 bp read 379
length), and three mate-pair libraries with span sizes of 3kb, 5kb, and 10kb respectively (Nextera 380
Mate Pair Sample Preparation Kit; sequenced with 2x50bp read length). One poly-A enriched RNA-381
seq library was generated for each of the three aforementioned cultures according to the Illumina 382
TruSeq Stranded mRNA Sample Prep kit #15031047 protocol and sequenced with 2x50 bp read 383
length. 384
The degree of DNA methylation was examined by HPLC on CsCl-gradient purified DNA56 from 385
three independent cultures per strain as previously described57. 386
Redundancy of mate-pairs (MPs) was reduced to mitigate the negative effect of redundant chimeric 387
MPs during scaffolding. To this means, mate-pair reads were aligned with bwa-0.6.1 to a 388
preliminary E. subulatus Bft15b draft assembly calculated from paired-end data only. Mate-pairs 389
that did not map with both reads were removed, and for the remaining pairs, read-starts were 390
obtained by parsing the cigar string using Samtools and a custom Pearl script. Mate-pairs with 391
redundant mapping coordinates were removed for the final assembly, which was carried out using 392
SOAPDenovo258. Scaffolding was then carried out using SSPACE basic 2.059 (trim length up to 5 393
bases, minimum 3 links to scaffold contigs, minimum 15 reads to call a base during an extension) 394
followed by a run of GapCloser (part of the SOAPDenovo package, default settings). A dot plot of 395
syntenic regions between E. subulatus Bft15b and Ectocarpus sp. Ec32 was generated using D-396
Genies 1.2.060. Given the high degree of synteny observed (Supporting Information Text S1), 397
additional scaffolding was carried out using MeDuSa and the Ectocarpus sp. Ec32 genome as 398
reference61. This super-scaffolding method assumes that both genome structures are be similar. 399
Annotations were generated first for version 1 of the Bft15b genome and then transferred to the new 400
scaffolds of version 2 using the ALLMAPS62 liftover function. Both the assemblies with (V2) and 401
without (V1) MeDuSa scaffolding have been made available. RNA-seq reads were cleaned using 402
Trimmomatic (default settings), and a second Bft15b genome-guided assembly was performed with 403
Tophat2 and with Cufflinks. Sequencing coverage was calculated based on mapped algal reads only, 404
and for pair libraries the genomic coverage was calculated as number of unique algal mate-405
pairs * span size / assembly size. 406
As cultures were not treated with antibiotics prior to DNA extraction, bacterial scaffolds were 407
removed from the final assembly using the taxoblast pipeline63. Every scaffold was cut into 408
fragments of 500 bp, and these fragments were aligned (blastn, e-value cutoff 0.01) against the 409
GenBank non-redundant nucleotide (nt) database. Scaffolds for which more than 90% of the 410
alignments were with bacterial sequences were removed from the assembly (varying this threshold 411
between 30 and 95% resulted in only very minor differences in the final assembly). Finally, we ran 412
the Anvi’o v5 pipeline to identify any remaining contaminant bins (both bacterial and eukaryote) 413
based on G/C and kmer contents as well as coverage64. “Contaminant” scaffolds were submitted to 414
the MG-Rast server to obtain an overview of the taxa present in the sample65. They are available at 415
http://application.sb-roscoff.fr/blast/subulatus/download.html. 416
Repeated elements were searched for de novo using TEdenovo and annotated using TEannot with
417
default parameters. LTR-like sequences were predicted by the LTR-harvest pipeline66. These tools 418
are part of the REPET pipeline67, of which version 2.5 was used for our dataset. 419
BUSCO 2.0 analyses27 were run on the servers of the IPlant Collaborative68 with the general 420
eukaryote database as a reference and default parameters and the predicted proteins as input. 421
Plastid and mitochondrial genomes of E. subulatus Bft15b, were manually assembled based on
422
scaffolds 416 and 858 respectively, using the published organellar genomes of Ectocarpus sp. Ec32 423
(accessions NC_013498.1, NC_030223.1) as a guide7,69,70. Genes were manually annotated based on 424
the result of homology searches with Ectocarpus sp. Ec32 using a bacterial genetic code (11) and 425
based on ORF predictions using ORF finder. Ribosomal RNA sequences were identified by 426
RNAmmer71 for the plastid and MITOS72 for the plastid, and tRNAs or other small RNAs were 427
identified using ARAGORN73 and tRNAscan-SE74. In the case of the mitochondrial genome, the 428
correctness of the manual assembly was verified by PCR where manual and automatic assemblies 429
diverged. 430
Putative protein-coding sequences were identified using Eugene 4.1c75. Assembled RNA-seq reads 431
were mapped against the assembled genome using GenomeThreader 1.6.5, and all available proteins 432
from the Swiss-Prot database as well as predicted proteins from the Ectocarpus sp. Ec32 genome7 433
were aligned to the genome using KLAST76. Both aligned de novo-assembled transcripts and 434
proteins were provided to Eugene for gene prediction, which was run with the parameter set 435
previously optimized for the Ectocarpus sp. Ec32 genome7. The subcellular localization of the 436
proteins was predicted using SignalP version 4.177 and the ASAFIND software version 1.1.526. 437
For functional annotation, predicted proteins were submitted to InterProScan and compared to the
438
Swiss-Prot database by BlastP search (e-value cutoff 1e-5), and the results imported to Blast2GO78 439
The genome and all automatic annotations were imported into Apollo79,80 for manual curation. 440
During manual curation sequences were aligned with characterized reference sequences from 441
suitable databases (e.g. CAZYME, TCDB, SwissProt) using BLAST, and the presence of 442
InterProScan domains necessary for the predicted enzymatic function was manually verified. 443
The E. subulatus Bft15b genome-scale metabolic model reconstruction was carried out as 444
previously described28 by merging an annotation-based reconstruction obtained with Pathway 445
Tools81 and an orthology-based reconstruction based on the Arabidopsis thaliana metabolic network 446
AraGEM82 using Pantograph83. A final step of gap-filling was then carried out using the Meneco 447
tool84. The entire reconstruction pipeline is available via the AuReMe workspace85. For pathway-448
based analyses, pathways that contained only a single reaction or that were less than 50% complete 449
were not considered. 450
Functional comparisons of gene contents were based primarily on orthologous clusters of genes
451
shared with version 2 of the Ectocarpus sp. Ec32 genome86 as well as the S. japonica (Areschoug) 452
genome11. They were determined by the OrthoFinder software version 0.7.187. To identify genes 453
specific to either of the Ectocarpus genomes, we examined all proteins that were not part of a multi-454
species cluster and verified their absence in the other genome by tblastn searches (threshold e-value 455
of 1e-10). Only genes without tblastn hit that encoded proteins of at least 50 amino acids were 456
further examined. A second approach consisted in identifying clusters of genes that were expanded 457
or reduced in either of the two Ectocarpus genomes based on the Orthofinder results. Blast2GO 3.178 458
was then used to identify significantly enriched GO terms among the genes specific to either 459
Ectocarpus genome or the expanded/reduced gene families (Fischer’s exact test with FDR correction
460
FDR<0.05). These different sets of genes were also examined manually for function, genetic 461
context, GC content, and EST coverage (to ensure the absence of contaminants). 462
The search for genes under positive selection was based on a previous analysis in other brown 463
algae88. Therefore, Orthofinder analyses were expanded to include also Macrocystis pyrifera, 464
Scytosiphon lomentaria88, and Cladosiphon okamuranus12. Rates of non-synonymous to 465
synonymous substitution (ω=dN/dS) were searched for in clusters of single-copy orthologs. Protein 466
sequences were aligned with Tcoffee89 (M-Coffee mode), translated back to nucleotide using 467
Pal2Nal90, and curated with Gblocks91 (-t c -b4 20) or manually when necessary. Sequences that 468
produced a gapless alignment that exceeded 100bp were retained for pairwise dN/dS analysis 469
between Ectocarpus strains using CodeML (F3x4 model of codon frequencies, runmode = −2) of the 470
PAML4 suite92. Orthogroups for which the pairwise dN/dS ratio between Ectocarpus species 471
exceeded 0.5, which were not saturated (dS < 1), and which contained single-copy orthologs in at 472
least two other species were used to perform positive selection analysis with CodeML (PAML4, 473
F3x4 model of codon frequencies): branch-site models were used to estimate dN/dS values by site 474
and among branches in the species tree generated for each orthogroup. The branch leading to the 475
genus Ectocarpus was selected as a ‘foreground branch’, allowing different values of dN/dS among 476
sites in contrast to the remaining branches that shared the same distribution of ω. Two alternative 477
models were tested for the foreground branch: H1 allowing the dN/dS to exceed 1 for a proportion of 478
sites (positive selection), and H0 constraining dN/dS<1 for all sites (neutral and purifying selection). 479
A likelihood ratio test was then performed for the two models (LRT=2×(lnLH1-lnLH0)) and genes 480
for which H1 fitted the data significantly better (p<0.05) were identified as evolving under positive 481
selection. 482
Phylogenetic analyses were carried out for gene families of particular interest. For
chlorophyll-483
binding proteins (CBPs), reference sequences were obtained from a previous study93, and aligned 484
together with E. subulatus Bft15b and S. japonica CBPs using MAFFT (G-INS-i)94. Alignments 485
were then manually curated, conserved positions selected in Jalview95, and maximum likelihood 486
analyses carried out using PhyML 3.096, the LG substitution model, 1000 bootstrap replicates, and an 487
estimation of the gamma distribution parameter. The resulting phylogenetic tree was visualized 488
using MEGA797. 489
Acknowledgements
490
We would like to thank Philippe Potin, Mark Cock, Susanna Coelho, Florian Maumus, and Olivier 491
Panaud for helpful discussions, as well as Gwendoline Andres for help setting up the Jbrowse 492
instance. This work was funded partially by ANR project IDEALG (ANR-10-BTBR-04) 493
“Investissements d’Avenir, Biotechnologies-Bioressources”, the European Union’s Horizon 2020 494
research and innovation Programme under the Marie Sklodowska-Curie grant agreement number 495
624575 (ALFF), and the CNRS Momentum call. Sequencing was performed at the Genomics Unit of 496
the Centre for Genomic Regulation (CRG), Barcelona, Spain. 497
Author contributions
498
Conceived the study: SMD, AP, AS, HH, CB, TT. Provided materials: AFP, APL. Performed 499
experiments: SMD, SD, IGN, DM, MMP. Analysed data: SMD, APL, EC, LBG, NP, MA, KA, 500
CHC, JC, AC, LD, SD, CF, AGo, AGr, CH, DJ, HK, XL, GVM, AEM, MM, PP, MMP, ASim, CT, 501
HSY, TT. Wrote the manuscript: SMD, KA, APL, JC, LD, CH, Ago, AGr, GVM, ASim, TT. 502
Revised and approved of the final manuscript: all authors. 503
Additional Information
504
Competing interests
505
The authors declare no competing interest. 506
Data availablility
507
Sequence data (genomic and transcriptomic reads) were submitted to the European Nucleotide 508
Archive (ENA) under project accession number PRJEB25230 using the EMBLmyGFF3 script98. A 509
JBrowse99 instance comprising the most recent annotations is available via the server of the Station 510
Biologique de Roscoff (http://mmo.sb-roscoff.fr/jbrowseEsu). The reconstructed metabolic network 511
of E. subulatus is available at http://gem-aureme.irisa.fr/sububftgem. Additional resources and 512
annotations including a blast server are available at http://application.sb-513
roscoff.fr/project/subulatus/index.html. The complete set of manual annotations is provided in 514
Supporting Information Table S7. 515
References
516
1. Davison, I. R. & Pearson, G. A. Stress tolerance in intertidal seaweeds. J. Phycol. 32, 197– 517
211 (1996). 518
2. Steneck, R. S. et al. Kelp forest ecosystems: Biodiversity, stability, resilience and future. 519
Environmental Conservation 29, 436–459 (2002).
520
3. McHugh, D. J. A guide to the seaweed industry. FAO Fish. Tech. Pap. (FAO, Rome, Italy) 521
(2003). 522
4. Food and Agriculture Organization of the United Nations, F. Global production statistics 523
1950-2014. (2016). Available at: http://www.fao.org/fishery/statistics/global-production/en. 524
(Accessed: 16th September 2016) 525
5. Archibald, J. M. The puzzle of plastid evolution. Curr. Biol. 19, R81-8 (2009). 526
6. Peters, A. F., Marie, D., Scornet, D., Kloareg, B. & Cock, J. M. Proposal of Ectocarpus 527
siliculosus (Ectocarpales, Phaeophyceae) as a model organism for brown algal genetics and
528
genomics. J. Phycol. 40, 1079–1088 (2004). 529
7. Cock, J. M. et al. The Ectocarpus genome and the independent evolution of multicellularity 530
in brown algae. Nature 465, 617–21 (2010). 531
8. Heesch, S. et al. A sequence-tagged genetic map for the brown alga Ectocarpus siliculosus
provides large-scale assembly of the genome sequence. New Phytol. 188, 42–51 (2010). 533
9. Stache-Crain, B., Müller, D. G. & Goff, L. J. Molecular systematics of Ectocarpus and 534
Kuckuckia (Ectocarpales, Phaeophyceae) inferred from phylogenetic analysis of nuclear- and
535
plastid-encoded DNA sequences. J. Phycol. 33, 152–168 (1997). 536
10. Peters, A. F., Coucerio, L., Tsiamis, K., Küpper, F. C. & Valero, M. Barcoding of cryptic 537
stages of marine brown algae isolated from incubated substratum reveals high diversity. 538
Cryptogam. Algol. 36, 3–29 (2015).
539
11. Ye, N. et al. Saccharina genomes provide novel insight into kelp biology. Nat. Commun. 6,
540
6986 (2015). 541
12. Nishitsuji, K. et al. A draft genome of the brown alga, Cladosiphon okamuranus , S-strain: a
542
platform for future studies of ‘mozuku’ biology. DNA Res. dsw039 (2016). 543
doi:10.1093/dnares/dsw039 544
13. Nishitsuji, K. et al. Draft genome of the brown alga, Nemacystus decipiens, Onna-1 strain:
545
Fusion of genes involved in the sulfated fucan biosynthesis pathway. Sci. Rep. 9, 4607 546
(2019). 547
14. Montecinos, A. E. et al. Species delimitation and phylogeographic analyses in the Ectocarpus
548
subgroup siliculosi (Ectocarpales, Phaeophyceae). J. Phycol. 53, 17–31 (2017). 549
15. Harvey, W. H. Phycologia britannica, or, a history of British sea-weeds: containing coloured 550
figures, generic and specific characters, synonymes, and descriptions of all the species of
551
algae inhabiting the shores of the British Islands. (Reeve & Benham, 1848).
552
16. Kützing, F. T. Phycologia generalis oder Anatomie, Physiologie und Systemkunde der Tange.
553
(F.A. Brockhaus, 1843). 554
17. Bolton, J. J. Ecoclinal variation in Ectocarpus siliculosus (Phaeophyceae) with respect to 555
temperature growth optima and survival limits. Mar. Biol. 73, 131–138 (1983). 556
18. West, J. & Kraft, G. Ectocarpus siliculosus (Dillwyn) Lyngb. from Hopkins River Falls, 557
Victoria - the first record of a freshwater brown alga in Australia. Muelleria 9, 29–33 (1996). 558
19. Dittami, S. M., Heesch, S., Olsen, J. L. & Collén, J. Transitions between marine and 559
freshwater environments provide new clues about the origins of multicellular plants and 560
algae. J. Phycol. 53, 731–745 (2017). 561
20. Oh, D.-H., Dassanayake, M., Bohnert, H. J. & Cheeseman, J. M. Life at the extreme: lessons 562
from the genome. Genome Biol. 13, 241 (2012). 563
21. Dittami, S. M. & Tonon, T. Genomes of extremophile crucifers: new platforms for 564
comparative genomics and beyond. Genome Biol. 13, 166 (2012). 565
22. Dassanayake, M. et al. The genome of the extremophile crucifer Thellungiella parvula. Nat.
566
Genet. 43, 913–918 (2011).
567
23. Amtmann, A. Learning from evolution: Thellungiella generates new knowledge on essential 568
and critical components of abiotic stress tolerance in plants. Mol. Plant 2, 3–12 (2009). 569
24. Ma, T. et al. Genomic insights into salt adaptation in a desert poplar. Nat. Commun. 4, 2797
570
(2013). 571
25. Zeng, X. et al. The draft genome of Tibetan hulless barley reveals adaptive patterns to the
572
high stressful Tibetan Plateau. Proc. Natl. Acad. Sci. U. S. A. 112, 1095–100 (2015). 573
26. Gruber, A., Rocap, G., Kroth, P. G., Armbrust, E. V. & Mock, T. Plastid proteome prediction 574
for diatoms and other algae with secondary plastids of the red lineage. Plant J. 81, 519–28 575
(2015). 576
27. Simão, F. A., Waterhouse, R. M., Ioannidis, P., Kriventseva, E. V. & Zdobnov, E. M. 577
BUSCO: assessing genome assembly and annotation completeness with single-copy 578
orthologs. Bioinformatics 31, 3210–3212 (2015). 579
28. Prigent, S. et al. The genome-scale metabolic network of Ectocarpus siliculosus (EctoGEM):
580
a resource to study brown algal physiology and beyond. Plant J. 80, 367–381 (2014). 581
29. Dittami, S. M. et al. Towards deciphering dynamic changes and evolutionary mechanisms 582
involved in the adaptation to low salinities in Ectocarpus (brown algae). Plant J. 71, 366–377 583
(2012). 584
30. Gualtieri, T., Ragni, E., Mizzi, L., Fascio, U. & Popolo, L. The cell wall sensor Wsc1p is 585
involved in reorganization of actin cytoskeleton in response to hypo-osmotic shock in 586
Saccharomyces cerevisiae. Yeast 21, 1107–1120 (2004).
587
31. Dong, H.-P. et al. High light stress triggers distinct proteomic responses in the marine diatom
588
Thalassiosira pseudonana. BMC Genomics 17, 994 (2016).
589
32. Zhu, S.-H. & Green, B. R. Photoprotection in the diatom Thalassiosira pseudonana: Role of 590
LI818-like proteins in response to high light stress. Biochim. Biophys. Acta - Bioenerg. 1797, 591
1449–1457 (2010). 592
33. Dittami, S. M. et al. Global expression analysis of the brown alga Ectocarpus siliculosus 593
(Phaeophyceae) reveals large-scale reprogramming of the transcriptome in response to 594
abiotic stress. Genome Biol. 10, R66 (2009). 595
34. Wu, H.-J. et al. Insights into salt tolerance from the genome of Thellungiella salsuginea.
596
Proc. Natl. Acad. Sci. U. S. A. 109, 12219–24 (2012).
597
35. de Boer, J. G., Yazawa, R., Davidson, W. S. & Koop, B. F. Bursts and horizontal evolution 598
of DNA transposons in the speciation of pseudotetraploid salmonids. BMC Genomics 8, 422 599
(2007). 600
36. Hu, T. T. et al. The Arabidopsis lyrata genome sequence and the basis of rapid genome size
601
change. Nat. Genet. 43, 476–81 (2011). 602
37. Tan, S. et al. LTR-mediated retroposition as a mechanism of RNA-based duplication in
603
metazoans. Genome Res. 26, 1663–1675 (2016). 604
38. Müller, D. G., Kapp, M. & Knippers, R. Viruses in marine brown algae. in 50, 49–67 605
(Academic Press, 1998). 606
39. Delaroque, N. et al. The complete DNA sequence of the Ectocarpus siliculosus virus EsV-1
607
genome. Virology 287, 112–132 (2001). 608
40. Dittami, S. M. et al. Microarray estimation of genomic inter-strain variability in the genus 609
Ectocarpus (Phaeophyceae). BMC Mol. Biol. 12, 2 (2011).
610
41. Liu, M.-J. et al. The complex jujube genome provides insights into fruit tree biology. Nat.
611
Commun. 5, 5315 (2014).
612
42. Kloareg, B. & Quatrano, R. S. Structure of the cell-walls of marine-algae and 613
ecophysiological functions of the matrix polysaccharides. Ocean. Mar Biol 26, 259–315 614
(1988). 615
43. Popper, Z. A. et al. Evolution and diversity of plant cell walls: from algae to flowering plants.
616
Annu. Rev. Plant Biol. 62, 567–90 (2011).
617
44. Torode, T. A. et al. Monoclonal antibodies directed to fucoidan preparations from brown
618
algae. PLoS One 10, e0118366 (2015). 619
45. Rao, A. Q. et al. Genomics of salinity tolerance in plants. in Plant Genomics (ed.
620
Abdurakhmonov, I. Y.) 273–299 (InTech, 2016). doi:10.5772/63361 621
46. Avia, K. et al. High-density genetic map and identification of QTLs for responses to
622
temperature and salinity stresses in the model brown alga Ectocarpus. Sci. Rep. 7, 43241 623
(2017). 624
47. Mosavi, L. K., Cammett, T. J., Desrosiers, D. C. & Peng, Z. The ankyrin repeat as molecular 625
architecture for protein recognition. Protein Sci. 13, 1435–1448 (2004). 626
48. Lipinska, A. P., Van Damme, E. J. M. & De Clerck, O. Molecular evolution of candidate 627
male reproductive genes in the brown algal model Ectocarpus. BMC Evol. Biol. 16, 5 (2016). 628
49. Yoon, H. S., Hackett, J. D., Ciniglia, C., Pinto, G. & Bhattacharya, D. A molecular timeline 629
for the origin of photosynthetic eukaryotes. Mol. Biol. Evol. 21, 809–18 (2004). 630
50. Charrier, B. et al. Development and physiology of the brown alga Ectocarpus siliculosus:
631
two centuries of research. New Phytol. 177, 319–32 (2008). 632
51. Tautz, D. & Domazet-Lošo, T. The evolutionary origin of orphan genes. Nat. Rev. Genet. 12, 633
692–702 (2011). 634
52. Khalturin, K., Hemmrich, G., Fraune, S., Augustin, R. & Bosch, T. C. G. More than just 635
orphans: are taxonomically-restricted genes important in evolution? Trends Genet. 25, 404– 636
413 (2009). 637
53. Ritter, A. et al. Transcriptomic and metabolomic analysis of copper stress acclimation in
638
Ectocarpus siliculosus highlights signaling and tolerance mechanisms in brown algae. BMC
639
Plant Biol. 14, 116 (2014).
640
54. Starr, R. C. & Zeikus, J. A. Utex - the culture collection of algae at the University of Texas at 641
Austin: 1993 list of cultures. J. Phycol. 29, 1–106 (1993). 642
55. Bothwell, J. H., Marie, D., Peters, A. F., Cock, J. M. & Coelho, S. M. Role of 643
endoreduplication and apomeiosis during parthenogenetic reproduction in the model brown 644
alga Ectocarpus. New Phytol. 188, 111–21 (2010). 645
56. Le Bail, A. et al. Normalisation genes for expression analyses in the brown alga model
646
Ectocarpus siliculosus. BMC Mol. Biol. 9, 75 (2008).
647
57. Rival, A. et al. Variations in genomic DNA methylation during the long-term in vitro
648
proliferation of oil palm embryogenic suspension cultures. Plant Cell Rep. 32, 359–368 649
(2013). 650
58. Luo, R. et al. SOAPdenovo2: an empirically improved memory-efficient short-read de novo
651
assembler. Gigascience 1, 18 (2012). 652
59. Boetzer, M., Henkel, C. V, Jansen, H. J., Butler, D. & Pirovano, W. Scaffolding pre-653
assembled contigs using SSPACE. Bioinformatics 27, 578–9 (2011). 654
60. Cabanettes, F. & Klopp, C. D-GENIES: dot plot large genomes in an interactive, efficient 655
and simple way. PeerJ 6, e4958 (2018). 656
61. Bosi, E. et al. MeDuSa: a multi-draft based scaffolder. Bioinformatics 31, 2443–2451 (2015).
657
62. Tang, H. et al. ALLMAPS: robust scaffold ordering based on multiple maps. Genome Biol.
658
16, 3 (2015).
659
63. Dittami, S. M. & Corre, E. Detection of bacterial contaminants and hybrid sequences in the 660
genome of the kelp Saccharina japonica using Taxoblast. PeerJ 5, e4073 (2017). 661
64. Eren, A. M. et al. Anvi’o: an advanced analysis and visualization platform for ‘omics data.
662
PeerJ 3, e1319 (2015).
663
65. Meyer, F. et al. The metagenomics RAST server - a public resource for the automatic
664
phylogenetic and functional analysis of metagenomes. BMC Bioinformatics 9, 386 (2008). 665
66. Ellinghaus, D., Kurtz, S. & Willhoeft, U. LTRharvest, an efficient and flexible software for 666
de novo detection of LTR retrotransposons. BMC Bioinformatics 9, 18 (2008). 667
67. Flutre, T., Duprat, E., Feuillet, C. & Quesneville, H. Considering transposable element 668
diversification in de novo annotation approaches. PLoS One 6, e16526 (2011). 669
68. Goff, S. A. et al. The iPlant collaborative: cyberinfrastructure for plant biology. Front. Plant
670
Sci. 2, 34 (2011).
671
69. Delage, L. et al. In silico survey of the mitochondrial protein uptake and maturation systems
672
in the brown alga Ectocarpus siliculosus. PLoS One 6, e19540 (2011). 673
70. Le Corguillé, G. et al. Plastid genomes of two brown algae, Ectocarpus siliculosus and Fucus
674
vesiculosus: further insights on the evolution of red-algal derived plastids. BMC Evol. Biol. 9,
675
253 (2009). 676
71. Lagesen, K. et al. RNAmmer: consistent and rapid annotation of ribosomal RNA genes.
677
Nucleic Acids Res. 35, 3100–8 (2007).
678
72. Bernt, M. et al. MITOS: improved de novo metazoan mitochondrial genome annotation. Mol.
679
Phylogenet. Evol. 69, 313–9 (2013).
680
73. Laslett, D. & Canback, B. ARAGORN, a program to detect tRNA genes and tmRNA genes 681
in nucleotide sequences. Nucleic Acids Res. 32, 11–6 (2004). 682
74. Schattner, P., Brooks, A. N. & Lowe, T. M. The tRNAscan-SE, snoscan and snoGPS web 683
servers for the detection of tRNAs and snoRNAs. Nucleic Acids Res. 33, W686-9 (2005). 684
75. Foissac, S. et al. Genome annotation in plants and fungi: EuGene as a model platform. Curr.
Bioinform. 3, 11 (2008).
686
76. Nguyen, V. H. & Lavenier, D. PLAST: parallel local alignment search tool for database 687
comparison. BMC Bioinformatics 10, 329 (2009). 688
77. Nielsen, H. Predicting Secretory Proteins with SignalP. in Protein Function Prediction (ed. 689
Daisuke Kihara) 59–73 (Springer, 2017). doi:10.1007/978-1-4939-7015-5_6 690
78. Götz, S. et al. High-throughput functional annotation and data mining with the Blast2GO
691
suite. Nucleic Acids Res. 36, 3420–35 (2008). 692
79. Lee, E. et al. Web Apollo: a web-based genomic annotation editing platform. Genome Biol.
693
14, R93 (2013).
694
80. Dunn, N. et al. GMOD/Apollo: Apollo2.0.8(JB#d3827c). Zenodo (2017).
695
doi:10.5281/ZENODO.1063658 696
81. Karp, P. D. et al. Pathway Tools version 19.0 update: software for pathway/genome 697
informatics and systems biology. Brief. Bioinform. 17, 877–890 (2016). 698
82. de Oliveira Dal’Molin, C. G., Quek, L.-E., Palfreyman, R. W., Brumbley, S. M. & Nielsen, 699
L. K. AraGEM, a genome-scale reconstruction of the primary metabolic network in 700
Arabidopsis. Plant Physiol. 152, 579–89 (2010). 701
83. Loira, N., Zhukova, A. & Sherman, D. J. Pantograph: A template-based method for genome-702
scale metabolic model reconstruction. J. Bioinform. Comput. Biol. 13, 1550006 (2015). 703
84. Prigent, S. et al. Meneco, a Topology-Based Gap-Filling Tool Applicable to Degraded
704
Genome-Wide Metabolic Networks. PLOS Comput. Biol. 13, e1005276 (2017). 705
85. Aite, M. et al. Traceability, reproducibility and wiki-exploration for “à-la-carte”
706
reconstructions of genome-scale metabolic models. PLOS Comput. Biol. 14, e1006146 707
(2018). 708
86. Cormier, A. et al. Re-annotation, improved large-scale assembly and establishment of a
709
catalogue of noncoding loci for the genome of the model brown alga Ectocarpus. New 710
Phytol. 214, 219–232 (2017).
711
87. Emms, D. M. & Kelly, S. OrthoFinder: solving fundamental biases in whole genome 712
comparisons dramatically improves orthogroup inference accuracy. Genome Biol. 16, 157 713
(2015). 714
88. Lipinska, A. P. et al. Rapid turnover of life-cycle-related genes in the brown algae. Genome
715
Biol. 20, 35 (2019).
716
89. Di Tommaso, P. et al. T-Coffee: a web server for the multiple sequence alignment of protein 717
and RNA sequences using structural information and homology extension. Nucleic Acids Res. 718
39, W13-7 (2011).
719
90. Suyama, M., Torrents, D. & Bork, P. PAL2NAL: robust conversion of protein sequence 720
alignments into the corresponding codon alignments. Nucleic Acids Res. 34, W609-12 721
(2006). 722
91. Talavera, G. & Castresana, J. Improvement of phylogenies after removing divergent and 723
ambiguously aligned blocks from protein sequence alignments. Syst. Biol. 56, 564–77 (2007). 724
92. Yang, Z. PAML 4: phylogenetic analysis by maximum likelihood. Mol. Biol. Evol. 24, 1586– 725
91 (2007). 726
93. Dittami, S. M., Michel, G., Collén, J., Boyen, C. & Tonon, T. Chlorophyll-binding proteins 727
revisited--a multigenic family of light-harvesting and stress proteins from a brown algal 728
perspective. BMC Evol. Biol. 10, 365 (2010). 729
94. Katoh, K., Misawa, K., Kuma, K. & Miyata, T. MAFFT: a novel method for rapid multiple 730
sequence alignment based on fast Fourier transform. Nucleic Acids Res. 30, 3059–66 (2002). 731
95. Waterhouse, A. M., Procter, J. B., Martin, D. M. A., Clamp, M. & Barton, G. J. Jalview 732
Version 2--a multiple sequence alignment editor and analysis workbench. Bioinformatics 25, 733
1189–91 (2009). 734
96. Guindon, S. & Gascuel, O. A simple, fast, and accurate algorithm to estimate large 735
phylogenies by maximum likelihood. Syst. Biol. 52, 696–704 (2003). 736
97. Kumar, S., Stecher, G. & Tamura, K. MEGA7: Molecular Evolutionary Genetics Analysis 737
Version 7.0 for Bigger Datasets. Mol. Biol. Evol. 33, 1870–1874 (2016). 738
98. Dainat, J. & Gourlé, H. NBISweden/EMBLmyGFF3: EMBLmyGFF3-1.2.2. Zenodo (2018). 739
doi:10.5281/ZENODO.1208446 740
99. Skinner, M. E., Uzilov, A. V, Stein, L. D., Mungall, C. J. & Holmes, I. H. JBrowse: a next-741
generation genome browser. Genome Res. 19, 1630–8 (2009). 742
743
Figures
744
745
Figure 1: Repeated elements identified within the genome of E. subulatus Bft15b. A) Number of
746
transposons detected in the different superfamilies; B) Boxplot of sequence identity levels for the 747
detected superfamilies; and C) Distribution of sequence identities in all and the 20 most abundant 748
transposon families. 749