HAL Id: hal-00993952
https://hal.archives-ouvertes.fr/hal-00993952
Submitted on 20 May 2014HAL is a multi-disciplinary open access archive for the deposit and dissemination of sci-entific research documents, whether they are pub-lished or not. The documents may come from teaching and research institutions in France or abroad, or from public or private research centers.
L’archive ouverte pluridisciplinaire HAL, est destinée au dépôt et à la diffusion de documents scientifiques de niveau recherche, publiés ou non, émanant des établissements d’enseignement et de recherche français ou étrangers, des laboratoires publics ou privés.
The Significance of Energy Storage for Renewable
Energy Generation and the Role of Instrumentation and
Measurement
Boris Berseneff, Marion Perrin, T. Tran-Quoc, Pascal Brault, N. Mermilliod,
Nouredine Hadjsaid, T. Delaplagne, Nicolas Martin, B. Crouzevialle
To cite this version:
Boris Berseneff, Marion Perrin, T. Tran-Quoc, Pascal Brault, N. Mermilliod, et al.. The Significance of Energy Storage for Renewable Energy Generation and the Role of Instrumentation and Measurement. IEEE Instrumentation and Measurement Magazine, Institute of Electrical and Electronics Engineers, 2014, 17, pp.34-40. �hal-00993952�
The significance of energy storage for renewable energy generation and the role of instrumentation and measurement.
B. Berseneff, M. Perrin, T. Tran-Quoc, Senior Member, IEEE, P. Brault, N. Mermilliod, N. Hadjsaid, Senior Member, IEEE, T. Delaplagne, N. Martin, B. Crouzevialle, Contact:
Boris Berseneff, CEA, LITEN, INES, F-38054 Grenoble, France.
boris.berseneff@cea.fr
Mail address: Boris Berseneff
CEA INES 50, av. du Lac Léman - BP 332 F-73375 Le Bourget-du-Lac Cedex France
CEA: Atomic Energy and Alternative Energies Commission INES: National Institute For Solar Energy
ENERGY STORAGE: FROM PRESENT TO EMERGING TECHNOLOGIES
Energy storage is not a new concept but is currently getting increasing importance in the context of energy transition paradigm. Indeed, it is expected to play a key role as an enabling technology for lowering the carbon footprint of the electric power system. In fact, the growing development of renewable energy resources and their increasing share in the energy mix, are introducing significant challenges to the existing power grid due to the high variability of these sources/loads. In particular, maintaining the generation-consumption balance of the electric power in real time, as well as the overall power system security, when these special energy sources/loads are present at a significant scale is a major concern. With competitive energy storage, it will be possible to introduce more flexibility in the electrical system thus helping it to better manage the overall energy balance with better system response in case of severe contingencies.
Energy storage technologies were historically used for managing the load curve while observing generation dynamic constraints. The most well-known storage technology is the pumped hydro storage where the energy is stored in a hydraulic form (water potential energy). With the event of open access and the corresponding unbundling of electric power industry segments, valorizing energy storage options under market conditions has become tricky. The major present barriers for deploying energy storage systems (ESS) are high cost, competitive economic value, efficiency and energy density, together with energy policies.
The new energy paradigm has put a new emphasis on energy storage, and many research roadmaps have pointed out the need for overcoming the current barriers. The decision makers’ awareness of the importance of energy storage is also on the rise. However, adequate incentives for encouraging massive deployment of ESS and storage technology within the electric power system are still lacking. Currently, most of the effort is dedicated to in situ
demonstration projects in striving for smarter grids and support of innovations with the corresponding proofs of concept and feedback experience.
Additionally, different grid applications are assessed for both centralized to decentralized uses. Various energy storage applications for frequency regulation, voltage support, investment optimization, or peak shaving are under consideration.
In this article, some of the main energy storage technologies will be reviewed according to their main application domains. That will be followed by a focus on battery energy storage. Some key elements of battery management system (BMS) technologies and ESS architecture and characterization will be addressed. Then some aspects of ESS protection will be presented and the key trends and indications of emerging concepts for energy storage will be identified.
EMERGING TECHNOLOGIES FOR ELECTRICITY STORAGE AT ALL SCALES
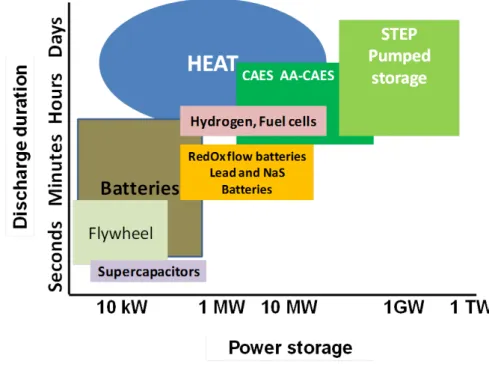
The continuous increase of electricity storage capabilities is parallel to the massive (above 10%) introduction of variable renewable energies such as wind and photovoltaic into the electricity grids. Figure 1 displays the various scales of the discharge duration versus the various scales of the power delivered for different storage systems.
Figure 1: Discharge duration versus stored power of various kinds of electric storage systems.
Beside large scale storage such as pump hydropower storage or compressed air electricity storage (CAES) which are continuously developed and modernized, especially with the promising coupling of CAES to thermal storage, there are new emerging technologies with
more flexibility and adaptation to the various scales, intermittency and randomness of some renewable energy.
The main technological progresses are currently driven from one side by electrochemical storage for nomadic applications and on the other side by transportation applications (electric vehicles). They will apply to stationary applications such as grid services.
Main research and development effort is concentrated on Li-ion battery components (electrodes and electrolytes), packaging and management, having in mind to increase both their lifetime and safety. The efforts are also oriented towards weight reduction either by a new concept as Li-polymers and Li-air batteries, but also by new design of the systems [1]. The use of batteries in stationary applications in the grid for shaving the production and load peaks is emerging with advanced Li-ion batteries of high capacities. Many projects are now deployed worldwide, from utility scale to transmission grid.
Other technologies are also under test and demonstration, such as flow batteries that are theoretically able to operate up to 10000 cycles versus a few hundred cycles for high power rechargeable lead batteries [2]
Flywheel systems connected renewable energy systems [3], are increasingly considered as a challenging efficient storage system. It is able to span a large range of power delivery and duration. Basically excess energy is used to rotate the flywheel and on demand, the flywheel is slowing down and is powering a generator. The faster a flywheel is rotating the more energy is stored. Low speed flywheel (6000 rpm) has specific energy around 5 Wh/kg. High-speed flywheels (50000 rpm) using advanced composite materials for the rotor with ultra-low friction bearing assemblies can achieve specific energy of 100 Wh/kg. The main advantages of flywheel storage systems are their high charge and discharge rates with up to 105 to 107 operating cycles, and a robustness of 20 years. Their present main disadvantages are high-costs and the relatively high self-discharges losses. Because of these self-discharge losses flywheels are better appropriate to provide a reliable standby power than for long-term energy storage.
Conversion to hydrogen is also an emerging approach for storing excess energy from renewable sources through water electrolysis. The produced hydrogen can either be stored and used to generate electricity via fuel cells or it can be injected in hydrogen or natural gas grids, or it can be transformed to methane by a catalytic reaction with CO2. The interest in hydrogen
production is its ability to operate at various scales and from mobile to stationary application. Its high energy density properties are well suited for this large range of potential and actual applications: the highest mass energy density (kWh/kg) and the lowest volumetric energy density (kWh/L).
DC Characterization
Electrochemical storage is a series and parallel assembly in of single electrochemical cells. Each cell consists of a positive electrode and a negative electrode that are plunged in an electrolyte which is an ionic conductor. The two electrodes are electrically insulated from each other by a separator. An ionic conductive membrane can also play the role of both separator and ionic conductor. Since ionic conduction is a necessity, two properties are inherent to any electrochemical storage:
• Ambient temperature fluctuations impact the ionic conductivity of the electrolyte leading to variation of the battery capacity depending on the charge/discharge rate. The smaller the ion, the lower the temperature impact. The figure 2 shows the discharged energy at different temperatures. In the case of a lithium ion battery with an iron phosphate positive electrode, for a discharge within 1 hour (1 C), the capacity varies by 12 % between a discharge at 20 °C and a discharge at 0 °C.
• The discharge current impacts the value of the battery capacity. This is due to the fact that at higher discharge rate, a larger number of ions must be displaced in the same fraction of time and must reach reaction sites on the opposite electrode. The smaller the ion the lower the current rate impact because of a higher mobility of the ions. The Figure 3 also shows the discharged energy at different discharge rates (2 C stand for 2 times the 1 h rated current i.e. approximately a discharge within 30 min).
Figure 2: Discharge capacity of a li-ion battery at different rates and different temperatures.
These particular properties imply that in order to be reproducible and comparable, battery characterization need to be carried out with an accurate control of both the ambient temperature and the applied current. The temperature control can be performed using water
bathes for aqueous technologies such as lead-acid batteries, or using climatic chambers for lithium-ion technologies.
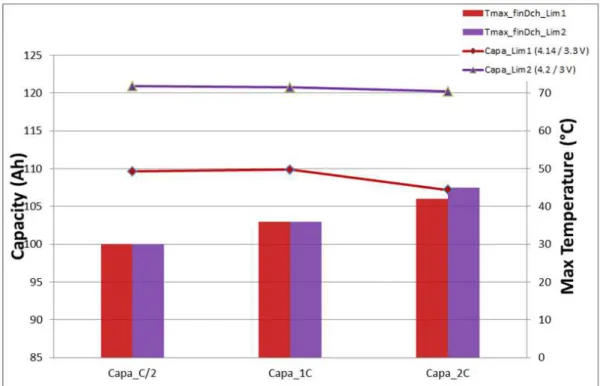
When mastering these two parameters of current and temperature, the capacity of a single cell can be measured quite easily. But when addressing a full battery, the single cells are associated to an electronic board that protects the battery against misuse, balances cells between them, and finally prevents aging it, the so called BMS (battery management system). In lithium-ion batteries, the BMS generally limits the discharge based on the lowest cell voltage and the charge based on the highest cell voltage. It also limits the use of the battery based on a highest measured temperature in the battery pack and maximum power available which depends on state of charge and temperature of the battery. Measurements performed on a battery pack from a Renault Twizy car with and without the BMS limitations are shown in Figure 3.
Figure 3: Discharge capacity of a Renault Twizy battery pack with (Lim1) and without (Lim2) BMS limitation.
Measurements Necessary for Determining Energy Storage Indicators
For energy storage (ES) management, it is necessary to have certain knowledge of the state of the energy storage system (ESS) and its components. Two indicators are widely used, the state of charge (SOC) and the state of health (SOH). SOC refers to the actual remaining capacity of a given battery with respect to its full capacity at the same instant. SOH refers to the present capacity of the battery when at 100% state of charge with respect to its full capacity at the beginning of life. The information on hand in order to estimate these indicators is generally a time series of the current, the voltage, and the skin temperature of a battery.
Since the capacity of a battery varies with its temperature and discharge rate, having a precise estimation of the state of charge is no trivial issue. A frequently used technique for SOC estimation of lithium-ion batteries is to read the voltage value at a given discharge current and a given temperature. Such indicator is e.g. used in mobile phones. Nevertheless, the accuracy of the voltage measurement needed in order to have a satisfying indicator can differ widely from one lithium-ion technology to the other.
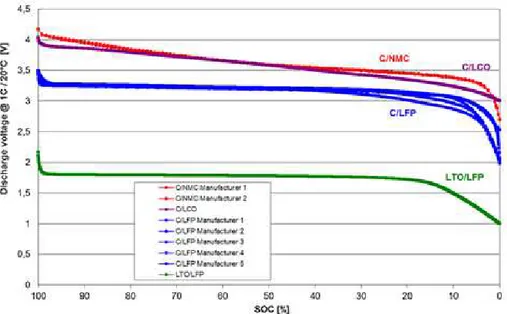
As shown in Figure 4, for a manufacturer of a technology based on graphite/lithiated cobalt oxide (C/LCO in figure 4), a technology generally used in mobile phones, in a range from 15% to 95% SOC the voltage variation for one point of SOC is over 7 mV/%, for a manufacturer of titanate/lithiated iron phosphate (LTO/LFP in figure 4), in a range from 25% to 95% SOC, the voltages varies of less than 0.7mV for each 1% of SOC. In that case (LTO/LFP), a precise measurement of the current needs to be added to the voltage measurement in order to have a correct SOC indication. It is important to notice, that even for a same battery technology, performances of battery may differ from one manufacturer to another, as design and fabrication processes vary.
Figure 4: Voltage evolution during constant current discharge for various lithium-ion technologies and manufacturers.
The use of ESS for power grid applications require accurate measurements as most of them are critical for stability and security of both local (utility scale) and whole (transmission scale) power system. For instance frequency regulation needs precise measures of the grid frequency coupled with a chain of command (BMS and actuators) fast enough to respond to frequency variations. Other applications like voltage control, load following, and generation shifting required accurate measure of voltage and current.
Energy type applications and revenue metering are also very sensitive to accuracy of measures as energy is calculated by integrating electrical power (i.e.: current and voltage) over a long period of time. Therefore a small measurement error of current and voltage, can lead to a significant error in the value of energy read after a long period of time (hours or
days, for example). Energy measurements depend also on the time reference. Most of the grid-connected ESS use centralized time reference systems based on internet network time protocols (NTP) or more accurate GPS systems.
Revenue metering is usually done on the AC side of ESS, at the grid connection point but conditions of metering changes from a project to another as well as billing practices and involved organizations (utilities, owner of installation, regulators). The last call for atender of the French Energy Regulation Commission (CRE) for PV installations over 250 kW peak, states that, for instance, time step between two measurements of installation performance must be 100 ms. Penalties for not following the production plan are calculated based on a 1 s sliding mean of these measures. Measurement of the installation should then satisfy those requirements.
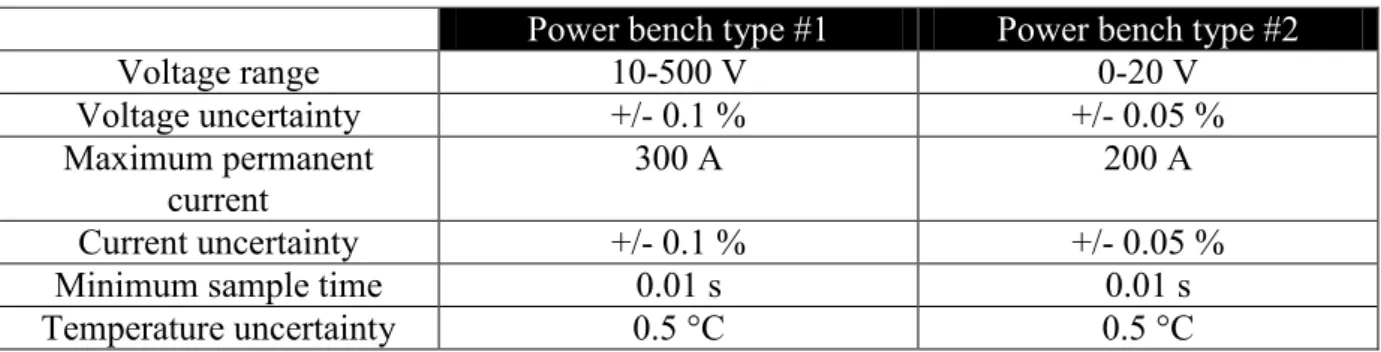
Table 1 and 2 give some characteristics of commonly used battery testing infrastructures. Power benches are used to characterize batteries assemblies (packs and modules). Electrochemistry benches are used to characterize cells. These data are a good illustration of minimum measurement requirements needed for ESS characterization.
For an ESS of 1 MW DC, typical DC voltage range is 600 V to 700 V whereas current range is 0 to 200 A. The voltage and current measurement uncertainties should be below 1%. At the battery level, for a 45 Ah Li-ion battery, a typical value for voltage range is 2 V to 4 V whereas measurement uncertainty must be below 1 mV to avoid charge imbalance between cells. The current range depends on the rate of charge/discharge. A typical value is 1C whereas the measurement uncertainty should be below 1%.
Table 1: Common power test bench characteristics
Power bench type #1 Power bench type #2
Voltage range 10-500 V 0-20 V Voltage uncertainty +/- 0.1 % +/- 0.05 % Maximum permanent current 300 A 200 A Current uncertainty +/- 0.1 % +/- 0.05 %
Minimum sample time 0.01 s 0.01 s
Temperature uncertainty 0.5 °C 0.5 °C
Table 2: Common electrochemistry test bench characteristics Electrochemistry bench type
#1
Electrochemistry bench type #2 Voltage range 0.5-5 V +/- 20 V Voltage uncertainty 0.1 % 5 µV Maximum permanent current 10 A 400 mA Current uncertainty 0.1 % 0.1 %
AC Characterization
DC characterization of most ESS allows accurate modeling of cells behavior. However most ESS are connected to AC power grid and require DC/AC inverters and several auxiliary systems. Therefore it is important to perform AC characterization of the Electric Storage System (ESS) to get a real model of the whole system (batteries, BMS, inverters, Electric Management System (EMS) and auxiliaries) and a good understanding of actual available power and energy. AC characterization, joined with ageing mechanisms modeling, allow optimal economic sizing of ESS.
Typical ESS AC architecture: NaNiCl2 ESS exemple
Figure 5 shows the simplified architecture of an actual ESS installed in one of CEA experimental platforms dedicated to smart grids researches. This platform is located at INES facilities. The ESS (140 kVA / 140 kWh) is based on based on NaNiCl2 batteries technologies
(also called ZEBRA batteries). It serves as community storage at utility scale and is connected to PV field (up to 100 kW) and local loads (buildings).
This electrical architecture is common in most ESS. Batteries are connected to grid through a DC/AC inverter. Auxiliary systems (HVAC, Energy Management Systems, Battery Management Systems, protections, sensors, automates…) are powered in DC or AC. One can see that location of electrical sensors (voltage, current and power) is a major issue. Taking into account or not some of auxiliary system will change the overall system efficiency calculation, as well as the accuracy of indicators, models and sizing.
Figure 5: Simplified electrical architecture of Fiamm NaNiCl2 ESS
On NaNiCl2 ESS, measurements are made on several locations. On AC side, current, voltage,
power and energy are measured before and after auxiliaries. On DC side measurement are done at batteries DC outputs. Some measurements (voltage and current) are also done inside the inverter in order to avoid CEM issues and latencies that would disturb the inverter control and therefore the overall efficiency of conversion. Characteristics of sensors are given in table 3.
Table 3: Characteristics of sensors of Fiamm NaNiCl2 ESS
Voltage class 0.5 Current class 0.5 Power class 1
Energy class 2
Temperature Type Pt100
Dynamic response of ESS
One of the challenging issues regarding implementation of ESS is to keep the response time as low as possible. Best example is self-consumption ESS. They consist of solar panels coupled with a storage system and an energy management system. They allow a better local use of solar energy via the storage so that the daily ratio of electrical energy used locally over the one produced locally tends to its maximum value, 100%.
Experiments undertook at INES facilities by CEA teams shows that response time of power regulation must be as low as possible in order to maximize the self-consumption ratio. Considering self-consumption system (10 kW peak) and a thermic load switching off and on every 20 seconds, the response time of the ESS is around 300 W/S. In this particular case, the self-consumption ratio should be around its maximum value of 100% but considering the actual response time, this ratio is only 77%. Considering a real system this drop of ratio can significantly reduce the efficiency of the self-consumption system. Therefore systems instrumentation and command must be design very carefully.
Among other example, Redox batteries are also a good illustration. Actual measures of the response of a 10 kW / 100 kWh system installed within INES facilities show that the delay between setpoint sending and actual response can be up 5 seconds. This can be a drawback for fast demanding application like frequency regulation.
AC modeling of ESS: State Of Available Power (SOAP)
Despite the fact that energy, power and efficiency are very common indicators in energy systems, battery storage systems do not usually provide this information to the user or to the EMS. In this context a novel indicator called State of Available Power (SOAP) bridges the gap between electrochemists (who describe batteries with their capacity and impedance) and storage systems operators (who describe all components looking at their power, energy and efficiency). This indicator is a good illustration of the need for accurate modeling of ESS coupled with efficient measure.
Main objectives of this indicator are:
• to provide the user a maximum power value according to the actual state of operation; • to allow the EMS to use this indicator as a model for energy planning.
This indicator allows considering ESS with an overall approach: SOAP takes not only into account individual cells performances but also the whole system including cells arrangement, battery management system and converters. Figures 6 show normalized results of a SAFT
VL45E lithium battery pack. Power is expressed in W per kWh. Power is expressed in W per kWh. These results show for instance that:
• charging power is more constrained that discharge power;
• temperature has only a minor influence on power available in normal range of operating temperature (10°C to 30°C);
• available power at extreme temperature is dramatically reduced; • SOC has a strong impact on SOAP in charge, for high SOC values.
A detailed analysis of values of current/voltage couple obtained during SOAP calculation shows that the power is mainly limited by the maximum current (except at high SOC in charge) and not by the minimum and maximum voltage, considering the SAFT VL45E technology.
Figure 6: Normalized charge SOAP for SAFT VL45E technology
ESS PROTECTION
Instrumentation and measurement are also used for the protection ESS, to ensure their operation in a safe, reliable, and economical manner. Here, the protective function of the inverter, the battery and the flywheel ESS is summarized.
There are two areas of concern when discussing the protection of the ESS: first, protection of the ESS system itself, second, removing the ESS from the system in case of external faults [4].
ESS inverter protection
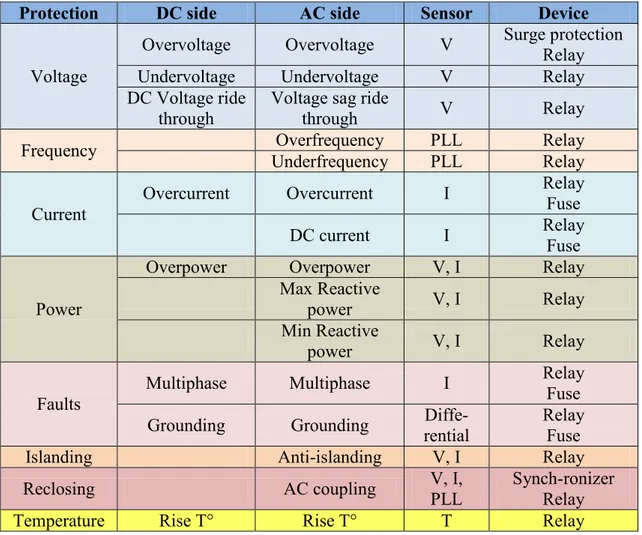
The ESS inverters for grid interconnection have a function for performing output control and safely disconnecting and stopping of the inverter if any abnormality in the system or at the utility grid side occurs. Table 4 presents different protective functions of ESS inverters.
Table 4: Protections in ESS inverters
Protection DC side AC side Sensor Device
Voltage
Overvoltage Overvoltage V Surge protection Relay
Undervoltage Undervoltage V Relay
DC Voltage ride through
Voltage sag ride
through V Relay
Frequency Overfrequency PLL Relay
Underfrequency PLL Relay
Current
Overcurrent Overcurrent I Relay
Fuse
DC current I Relay
Fuse
Power
Overpower Overpower V, I Relay
Max Reactive
power V, I Relay
Min Reactive
power V, I Relay
Faults
Multiphase Multiphase I Relay
Fuse Grounding Grounding Diffe-
rential
Relay Fuse
Islanding Anti-islanding V, I Relay
Reclosing AC coupling V, I,
PLL
Synch-ronizer Relay
Temperature Rise T° Rise T° T Relay
These functions are performed using detection results of voltage and current in the control circuit, and information from various kinds of sensors, and protection is performed integrally with the control circuit [5]. Sensors The frequency is obtained by PLL (phase-looked loop) in the control circuit. These protections are accompanied by operation of the inverter system, and protection against lightning and surge voltage is required separately. These transient overvoltage protections are performed by a surge arrester (zinc oxide element etc.) and a varistor, both at DC and AC sides, in some cases a filter is used at the AC side. A combination of high speed semiconductor fuses, relays, and dc and ac breakers can be used
for ESS protection. Voltage and current sensors used for protections within CEA ESS are LEM sensors LV25-P for voltage and LA25-NP for current. Class is the same as the one given in table 3.
The IEEE 1547 [6] can be applied for ESS protection requirements.
Battery protection
A battery is constructed from a string of series and parallel cells. Each series cell, or group of paralleled cells require protection from overcharge, over discharge and short circuit conditions.
Each of the batteries is controlled by a Control unit (Battery Management System or BMS). For batteries, it is necessary to monitor the charge/discharge voltage and current for the protection system [7].
The battery modules are protected by a DC breaker, contactor, or a fuse. Flywheel ESS protection
A flywheel is coupled to an induction or synchronous machine. The power electronic interface consists of two voltage sourced converters (VSC) connected through a common DC link. The protection of power electronic interface is presented in the preceding part.
This part presents protection requirements of induction or synchronous machine. All protection requirements [8, 9] for induction and synchronous machine are applied such as the over/under voltage, overcurrent, overload protection... For this system, the speed protection and thermal protection must be considered. The measurement of vibration is necessary to protect this system.
This system is protected by a breaker, contactor, or a fuse.
CONCLUSIONS AND PERSPECTIVES
A major challenge for the coming years all over the world is the integration of variable renewable electric sources in the grid. Low cost and efficient storage systems may meet this challenge and transform variable REN sources in “semi-base” electric sources. Furthermore storage can bring other services to the grid such as frequency and voltage control.
Many different electric storage technologies have been evoked in this paper that have to be developed in parallel because they have different specificities (capacity, power, charging kinetic, etc…) and can thus answer to different applications and environments: mass storage or distributed one, fast response or long term storage, deep cyclings and/or highly frequent ones, …
For most of those technologies a large increase in the R&D effort is still necessary to lower the production costs and increase the yields and life time of both electric storage components and systems so that they come close to realistic market conditions (<0.10€/stored kWh). As an example, besides the reduction cost of the components of the electrochemical batteries, it is possible to develop a smart control of each cell to produce AC currents and thus replace the inverter.
Market perspectives for storage are good as well for mass storage (wind and PV farms) as for disseminated households applications associated to PV, µ-wind mill or µ-CHP: for example, IHS research (2013) forecast a 6GW cumulative market for storage associated to grid-tied residential and commercial PV. But smart and easy plug & play storage systems must be developed for those applications.
As one million EV and HEV represent about 10TWh, it will also become worth developing the “Car to Grid” interactions. This means the development of a user-friendly and grid-friendly interface (at the charging station), both from a technical and an economical point of view (retribution of the battery owner for the service brought to the grid that might have a consequence on the battery life time).
As already mentioned earlier in this paper energy storage should not be limited to electricity storage. An excess and/or fatal production of electricity might sometimes be better stored and used by transforming it into other energy vectors such as hydrogen, heat or methane. This is also a large field for further research and development to increase overall yields and lower the costs.
However the market growth for energy storage is presently limited by the lack of a clear business model: the flexibility brought to the grid by the storage system must be remunerated, as well as the other services that electric storage can bring such as frequency or voltage adaptation. This means that adequate regulations and incentives will be necessary to initiate this market and start the mass production and use of storage systems.
References
[1]: Weber, A. Z., Mench, M. M., Meyers, J. P., Ross, P. N., Gostick, J. T., & Liu, Q., “Redox flow batteries: a review”. Journal Of Applied Electrochemistry, issue 10, vol. 41, pp.1137-1165, 2011
[2]: J.-M. Tarascon and M. Armand, “Issues and challenges facing rechargeable lithium batteries,” Nature, vol. 414, pp. 359, 2001.
[3]: I. Hadjipaschalis, A. Poullikkas and V. Efthimiou, “Overview of current and future energy storage technologies for electric power applications,” Renewable and Sustainable
[4]: Hedding, R.; Hayes, P., "Protection of battery energy storage systems," Protective Relay
Engineers, 2011 64th Annual Conference for, vol., no., pp.155,159, 11-14 April 2011
[5]: Tadao ISHIKAWA, “Grid-connected photovoltaic power systems: survey of inverter and related protection equipments”, Report IEA PVPS T5-05: 2002, December 2002
[6]: IEEE 1547 –2003, “Standard for Interconnecting Distributed Resources with Electric Power Systems”
[7]: “Battery protection IC for n-cell pack”, available on-line at www.sii-ic.com,
[8]: Bill Schulz, Thet Myint, Pat Deibel, “Protective relaying: Induction motor protection”, May 2003.