Cell Reports
Supplemental Information
Amino Acids Stimulate TORC1 through Lst4-Lst7,
a GTPase-Activating Protein Complex
for the Rag Family GTPase Gtr2
Marie-Pierre Péli-Gulli, Alessandro Sardu, Nicolas Panchaud, Serena Raucci, and Claudio De Virgilio
Supplemental Figures
Figure S1. Loss of Lst4 and/or Lst7 Causes Rapamycin-Sensitivity and a Mild Defect in Recovery from a Rapamycin-Induced Growth Arrest, Related to Figure 1
Wild-type and isogenic mutant cells (genotypes indicated) were grown exponentially in YPD (standard rich medium with 2% glucose) and spotted as 10-fold serial dilutions on YPD plates containing no rapamycin (vehicle) or 10 ng ml-1 rapamycin (RAP). To assay the ability of cells to recover from a rapamycin-induced
growth arrest, exponentially growing cells were treated for 6 h with rapamycin (200 ng ml-1), washed twice, and then spotted as 10-fold serial dilutions on YPD plates (RAP Recovery).
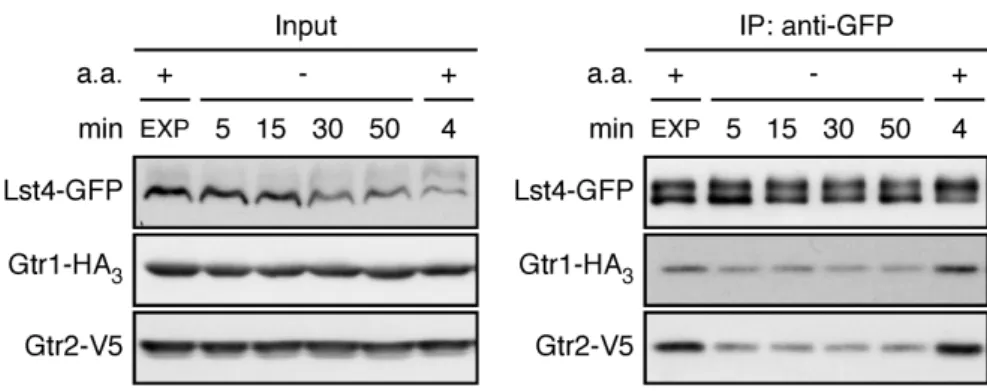
Figure S2. Short or Prolonged Amino Acid Starvation and Subsequent Refeeding Reduces and Re-Stimulates, Respectively, the Interaction Between Lst4 and Gtr1-Gtr2, Related to Figure 2
Lst4-GFP was IP-ed in extracts from cells that co-expressed Gtr1-HA3 and Gtr2-V5. Cells were grown as in
Figure 2E, but were harvested following 5, 15, 30, and 50 min of amino acid starvation (a.a.; -), and after 4 min of amino acid refeeding (a.a.; +; 4 min) to 50 min-starved cells.
Figure S3. Amino Acids Such as Glutamine Stimulate TORC1 in an Lst4-, Lst7-, and Gtr1/2-Dependent Manner, Related to Figure 4
(A) Glutamine (Gln), aspartate (Asp), asparagine (Asn), methionine (Met), and cysteine (Cys) are highly competent in displacing Lst4-GFP from the vacuolar membrane. Lst4-GFP-expressing cells were starved for 5 min for all amino acids, re-stimulated for 12 min with individual amino acids (3 mM) or NH4+ (37.7
mM), and then analyzed for Lst4-GFP localization. One representative image is shown for each condition and the quantification data are presented in Figure 4D. The scale bar (white; top left panel) represents 5 µm and applies to all panels.
(B and C) Glutamine stimulates TORC1 activity in amino acid-starved cells in an Lst4-, Lst7- and Gtr1/2-dependent manner. In (B), TORC1 activity (i.e. Sch9-pThr737/total Sch9) was assayed in exponentially growing cells with the indicated genotypes that were deprived for 5 min of all amino acids (Gln; -) and subsequently stimulated for 12 min with 3 mM glutamine (Gln; +). TORC1 activities (means ± SD from three independent experiments) were normalized to the value of glutamine-stimulated WT cells (set to 100%). The respective glutamine (Gln) -mediated fold-increase in TORC1 activity (i.e. the ratio of the TORC1 values between glutamine-stimulated and amino acid-starved cells) for each strain is shown in (C). Significance was estimated by Student's t-test (**P < 0.01).
Supplemental Tables
Table S1. Strains Used in This Study
Strain Genotype Source Figure
YL515 [BY4741/2] MATα; his3∆1, leu2∆0, ura3∆0 (Binda et al., 2009) 1A-D; S1
MP347-4A [YL515] MATα; lst4∆::KanMX This study 1A-D; S1
MP348-3C [YL515] MATα; lst7∆::KanMX This study 1A-D; S1
MP354-9A [YL515] MATα; lst4∆::KanMX, lst7∆::KanMX This study 1A-C; S1
MB36-4B [YL515] MATα; gtr1∆::kanMX This study 1A-C; S1
MB33 [YL515] MATa; gtr2∆::kanMX (Binda et al., 2009) 1A-C; S1
NP04-C4 [YL515] MATα; iml1∆::KanMX (Panchaud et al., 2013b) 1A-C; S1
MP06-8B [YL515] MATα; gtr1∆::kanMX, gtr2∆::kanMX (Binda et al., 2009) 1C
MB27 [YL515] MATα; gtr1∆::HIS3 (Binda et al., 2009) 1D
MP359-5A [YL515] MATα; lst4∆::KanMX gtr1∆::HIS3 This study 1D
MP360-2C [YL515] MATα; lst7∆::KanMX gtr1∆::HIS3 This study 1D
MB28 [YL515] MATα; gtr2∆::HIS3 (Binda et al., 2009) 1D
MP361-7D [YL515] MATα; lst4∆::KanMX gtr2∆::HIS3 This study 1D
MP362-4A [YL515] MATα; lst7∆::KanMX gtr2∆::HIS3 This study 1D
KT1961 MATa; his3, leu2, ura3-52, trp1 (Pedruzzi et al., 2003) S3B, C
KP09 [KT1961] MATa; lst4∆::KanMX This study S3B, C
KP10 [KT1961] MATa; lst7∆::KanMX This study 2A; S3B, C
MP409-2A [KT1961] MATa; LST4-GFP::HIS3MX This study 2B, D; 4D,
E; S3A
MP410-5B [KT1961] MATa; LST7-GFP::HIS3MX This study 2B
MP374-1C [KT1961] MATa; LST4-GFP::HIS3MX, lst7∆::KanMX This study 2A, C
MP372-2D [KT1961] MATa; LST7-GFP::HIS3MX, lst4∆::KanMX This study 2C
MP406-8A [KT1961] MATa; LST4-GFP::HIS3MX, gtr1∆::natMX,
gtr2∆::natMX
This study 2E; 4A-C,
F; S2
MP405-3D [KT1961] MATa; LST7-GFP::HIS3MX, gtr1∆::natMX,
gtr2∆::natMX
This study 2F; 4F
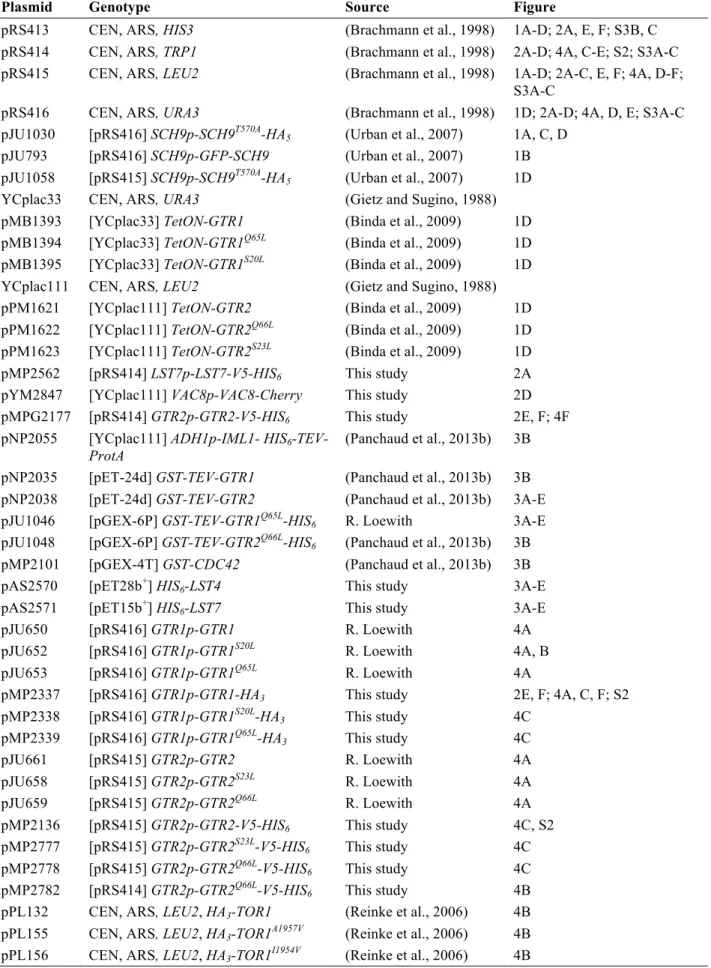
Table S2. Plasmids Used in This Study
Plasmid Genotype Source Figure
pRS413 CEN, ARS, HIS3 (Brachmann et al., 1998) 1A-D; 2A, E, F; S3B, C
pRS414 CEN, ARS, TRP1 (Brachmann et al., 1998) 2A-D; 4A, C-E; S2; S3A-C
pRS415 CEN, ARS, LEU2 (Brachmann et al., 1998) 1A-D; 2A-C, E, F; 4A, D-F;
S3A-C
pRS416 CEN, ARS, URA3 (Brachmann et al., 1998) 1D; 2A-D; 4A, D, E; S3A-C
pJU1030 [pRS416] SCH9p-SCH9T570A-HA
5 (Urban et al., 2007) 1A, C, D
pJU793 [pRS416] SCH9p-GFP-SCH9 (Urban et al., 2007) 1B
pJU1058 [pRS415] SCH9p-SCH9T570A-HA
5 (Urban et al., 2007) 1D
YCplac33 CEN, ARS, URA3 (Gietz and Sugino, 1988)
pMB1393 [YCplac33] TetON-GTR1 (Binda et al., 2009) 1D
pMB1394 [YCplac33] TetON-GTR1Q65L (Binda et al., 2009) 1D
pMB1395 [YCplac33] TetON-GTR1S20L (Binda et al., 2009) 1D
YCplac111 CEN, ARS, LEU2 (Gietz and Sugino, 1988)
pPM1621 [YCplac111] TetON-GTR2 (Binda et al., 2009) 1D
pPM1622 [YCplac111] TetON-GTR2Q66L (Binda et al., 2009) 1D
pPM1623 [YCplac111] TetON-GTR2S23L (Binda et al., 2009) 1D
pMP2562 [pRS414] LST7p-LST7-V5-HIS6 This study 2A
pYM2847 [YCplac111] VAC8p-VAC8-Cherry This study 2D
pMPG2177 [pRS414] GTR2p-GTR2-V5-HIS6 This study 2E, F; 4F
pNP2055 [YCplac111] ADH1p-IML1- HIS6
-TEV-ProtA
(Panchaud et al., 2013b) 3B
pNP2035 [pET-24d] GST-TEV-GTR1 (Panchaud et al., 2013b) 3B
pNP2038 [pET-24d] GST-TEV-GTR2 (Panchaud et al., 2013b) 3A-E
pJU1046 [pGEX-6P] GST-TEV-GTR1Q65L-HIS
6 R. Loewith 3A-E
pJU1048 [pGEX-6P] GST-TEV-GTR2Q66L-HIS
6 (Panchaud et al., 2013b) 3B
pMP2101 [pGEX-4T] GST-CDC42 (Panchaud et al., 2013b) 3B
pAS2570 [pET28b+] HIS6-LST4 This study 3A-E
pAS2571 [pET15b+] HIS
6-LST7 This study 3A-E
pJU650 [pRS416] GTR1p-GTR1 R. Loewith 4A
pJU652 [pRS416] GTR1p-GTR1S20L R. Loewith 4A, B
pJU653 [pRS416] GTR1p-GTR1Q65L R. Loewith 4A
pMP2337 [pRS416] GTR1p-GTR1-HA3 This study 2E, F; 4A, C, F; S2
pMP2338 [pRS416] GTR1p-GTR1S20L-HA
3 This study 4C
pMP2339 [pRS416] GTR1p-GTR1Q65L-HA3 This study 4C
pJU661 [pRS415] GTR2p-GTR2 R. Loewith 4A
pJU658 [pRS415] GTR2p-GTR2S23L R. Loewith 4A
pJU659 [pRS415] GTR2p-GTR2Q66L R. Loewith 4A
pMP2136 [pRS415] GTR2p-GTR2-V5-HIS6 This study 4C, S2
pMP2777 [pRS415] GTR2p-GTR2S23L-V5-HIS6 This study 4C
pMP2778 [pRS415] GTR2p-GTR2Q66L-V5-HIS
6 This study 4C
pMP2782 [pRS414] GTR2p-GTR2Q66L-V5-HIS
6 This study 4B
pPL132 CEN, ARS, LEU2, HA3-TOR1 (Reinke et al., 2006) 4B
pPL155 CEN, ARS, LEU2, HA3-TOR1A1957V (Reinke et al., 2006) 4B
Supplemental Experimental Procedures
CoimmunoprecipitationYeast cells expressing the indicated fusion proteins were harvested by filtration. Filters were immediately snap-frozen in liquid nitrogen and stored at -80°C. Cells were then resupended in lysis buffer (50 mM Tris HCl, pH 7.5, 150 mM NaCl, 10 mM MgCl2, 0.1% NP-40, and 1x protease and phosphatase inhibitor
cocktails [Roche]) and lysed with glass beads using the Precellys cell disruptor. Lysates were clarified by two successive centrifugations for 10 min at 13'000 rpm. For input samples, aliquots of cleared lysates were concentrated by precipitation with ice-cold methanol, resuspended in 6x concentrated loading buffer, and denatured for 10 min at 65°C. For coimmunoprecipitations, cleared lysates were incubated for 2 hours at 4°C with prewashed GFP-Trap® Magnetic-Agarose beads (Chromotek). After three washes with the lysis buffer, beads were resuspended in 6x concentrated loading buffer and denatured for 10 min at 65°C. Inputs and pull-down samples were analyzed by SDS-PAGE immunoblot with anti-GFP (Roche), anti-HA (HA.11; SantaCruz), and anti-V5 (Lubio).
Fluorescence microscopy and image quantification
Images were captured with an inverted Spinning Disk Confocal Microscope (VisiScope CSU-W1) equipped with an Evolve 512 (Photometrics) EM-CCD camera and a 100x 1.3 NA oil immersion Nikon CFI series objective. Quantification of the signal intensity at the vacuolar membrane was performed using the ImageJ software as follows: For each cell the median intensity value of the total GFP-signal was measured and subtracted from the respective median intensity value of the GFP-signal at the vacuolar membrane. Quantifications were performed on three independent experiments (with at least 9 cells analyzed in each experiment).
Protein purification
Iml1-His6 was purified from Saccharomyces cerevisiae as previously described (Panchaud et al., 2013b).
GST-Gtr2, GST-Gtr1Q65L-His6/Gtr2-His6, Gtr1-His6/GST-Gtr2Q66L-His6, GST-Cdc42 and His6-Lst4/His6
-Lst7 were produced in the Escherichia coli Rosetta strain (Novagen) after induction with 0.5 mM IPTG during 5 hours at 18°C (GST-Gtr2, GST-Gtr1Q65L-His6/Gtr2-His6, Gtr1-His6/GST-Gtr2Q66L-His6), or at 37°C
(GST-Cdc42) or overnight at 16°C (His6-Lst4/His6-Lst7). Cells were collected by centrifugation and lysed
with a microfluidizer in the appropriate buffer. Purification of GST-tagged proteins was done using Glutathione-Sepharose beads (GE Healthcare) in Buffer A (50 mM Tris-HCl, pH 7.5, 200 mM NaCl, 1.5 mM MgCl2, 5% glycerol, 1 mM DTT, 0.1% NP40, and 0.1 mM GDP) and proteins were finally eluted with
Buffer A + 10 mM reduced glutathione. His6 purification (His6-Lst4/His6-Lst7) was performed using
Ni-NTA agarose beads (Qiagen) in Buffer B (50 mM NaH2PO4 pH 8.0, 300 mM NaCl, 0.1% NP40, and 50
Supplemental References
Binda, M., Péli-Gulli, M.P., Bonfils, G., Panchaud, N., Urban, J., Sturgill, T.W., Loewith, R., and De Virgilio, C. (2009). The Vam6 GEF controls TORC1 by activating the EGO complex. Mol. Cell 35, 563-573.
Brachmann, C.B., Davies, A., Cost, G.J., Caputo, E., Li, J., Hieter, P., and Boeke, J.D. (1998). Designer deletion strains derived from Saccharomyces cerevisiae S288C: a useful set of strains and plasmids for PCR-mediated gene disruption and other applications. Yeast 14, 115-132.
Gietz, R.D., and Sugino, A. (1988). New yeast-Escherichia coli shuttle vectors constructed with in vitro mutagenized yeast genes lacking six-base pair restriction sites. Gene 74, 527-534.
Panchaud, N., Péli-Gulli, M.P., and De Virgilio, C. (2013b). Amino acid deprivation inhibits TORC1 through a GTPase-activating protein complex for the Rag family GTPase Gtr1. Sci. Signal. 6, ra42. Pedruzzi, I., Dubouloz, F., Cameroni, E., Wanke, V., Roosen, J., Winderickx, J., and De Virgilio, C. (2003). TOR and PKA signaling pathways converge on the protein kinase Rim15 to control entry into G0.
Mol. Cell 12, 1607-1613.
Reinke, A., Chen, J.C., Aronova, S., and Powers, T. (2006). Caffeine targets TOR complex I and provides evidence for a regulatory link between the FRB and kinase domains of Tor1p. J. Biol. Chem. 281, 31616-31626.
Urban, J., Soulard, A., Huber, A., Lippman, S., Mukhopadhyay, D., Deloche, O., Wanke, V., Anrather, D., Ammerer, G., Riezman, H., et al. (2007). Sch9 is a major target of TORC1 in Saccharomyces cerevisiae. Mol. Cell 26, 663-674.