B
Estimation of snowfall limit for the Kashmir Valley, Indian
Himalayas, with TRMM PR Bright Band information
S. Schauwecker1,2∗, M. Rohrer1, M. Schwarb1, C. Huggel2, A.P. Dimri3and N. Salzmann4 1Meteodat GmbH, Technoparkstrasse 1, 8005 Zurich, Switzerland
2Department of Geography, University of Zurich – Irchel, Winterthurerstr. 190, 8057 Zurich, Switzerland 3School of Environmental Sciences, Jawaharlal Nehru University, New Delhi, India
4Department of Geosciences, University of Fribourg, Chemin du Musée 4, 1700 Fribourg, Switzerland (Manuscript received September 3, 2015; in revised form February 26, 2016; accepted March 6, 2016)
Abstract
Knowing the height of the snowfall limit during precipitation events is crucial for better understanding a number of hydro-climatic processes, for instance glacier-climate interactions or runoff from high mountain catchments. However, knowledge on heights of the phase change during precipitation events is limited by the small number of meteorological measurements available at high altitudes, such as the Himalayas. The bright band (BB) of satellite based radar data may be a promising proxy for the snow/rain transition during particular stratiform precipitation events over high mountain regions. The BB is a horizontal layer of stronger radar reflectivity caused by the melting of hydrometeors at the level where solid precipitation turns into rain. Here, we present BB heights detected by the Tropical Rainfall Measuring Mission (TRMM) Precipitation Radar (PR) 2A23 algorithm over a mountainous area. To assess the performance of BB heights, we have compared a 17-year data set of BB estimations of the TRMM PR with radiosonde observations and meteorological station data from Srinagar, Kashmir Valley, India. During March to November, the BB lies mostly about 200 to 800 m below the freezing level (FL) recorded by radiosondes. The correlation between BB and FL heights extrapolated from a ground-based station is smaller and depends on the timing of the air temperature measurement – an important finding for applying extrapolation techniques in data sparse regions. Further on, we found a strong seasonal and monthly variability of the BB height, e.g. extending in summer months from about 2700 m to almost 6000 m asl. Comparison with near surface rain intensity from the TRMM PR product 2A25 indicates that – during intense monsoonal summer precipitation events – the BB height is concentrated between about 3500 and 4000 m asl. We can conclude that TRMM PR BB data deliver valuable complementary information for regional or seasonal variability in snow/rain transition in data sparse regions and, further on, BB data from surrounding lowlands could be used to validate extrapolation approaches to assess snowfall limit for mainly stratiform precipitation events where stations at high elevations are missing.
Keywords: Bright band, TRMM PR 2A23, snow/rain transition, freezing level, snowfall limit, melting layer
Abbreviations
BB Bright band
FL Freezing level
GANAL Global Analysis data
GPM Global Precipitation Measurement IMD India Meteorological Department JAXA Japanese Aerospace Exploration NASA National Aeronautics and Space
Administration
NCEP National Centers for Environmental Prediction
PR Precipitation Radar
SDC Swiss Agency for Development and
Cooperation
∗Corresponding author: Simone Schauwecker, Physical Geography
Divi-sion, Department of Geography, University of Zurich – Irchel, Winterthur-erstr. 190, 8057 Zurich, Switzerland, Meteodat GmbH, Technoparkstrasse 1, 8005 Zürich, Switzerland, e-mail: [email protected]
TRMM Tropical Rainfall Measuring Mission VPR Vertical Profile of Reflectivity
1
Introduction
The height of the snowfall limit, being the altitude where the transition from snow to rain occurs, is a critical vari-able to understand fundamental glacier-hydro-climatic processes. In modelling mass balance of seasonal snow cover and glaciers, snowfall limit is a decisive variable since solid precipitation is contributing to accumulation and rain is contributing to runoff and additionally en-hancing ablation via higher albedo and other processes. Further on, variations in the snowline altitude on glaciers (defined as the line separating snow surfaces from ice or firn surfaces) and related albedo effects, are among the most crucial factors to explain for instance differences in annual energy balance and thus glacier mass balance (e.g. Benn and Lehmkuhl, 2000;Bolch et al., 2012) or to model runoff processes (Immerzeel et al., 2009;
© 2016 The authors DOI 10.1127/metz/2016/0738 Gebrüder Borntraeger Science Publishers, Stuttgart,www.borntraeger-cramer.com
Rohrer et al., 2013). Nevertheless, the related informa-tion is typically lacking in many mountainous regions due to missing in-situ measurements. Remote sensing data are thus promising information sources to fill these gaps. Here, we assess the applicability of bright band (BB) height estimations from space for its use as a proxy for the snow/rain transition height, as suggested byRohrer et al. (2013).
The BB is a zone of enhanced radar reflectivity, which is commonly observed in precipitation radar (PR) images during precipitation events. This zone of intensi-fied echoes is caused by a horizontal melting layer in the atmosphere, at the height where ice or snow particles are transformed into liquid raindrops (e.g. Battan, 1973). Above this layer, precipitation is mostly solid and does not much attenuate radar signals. The enhanced reflec-tivity may lead to large positive biases in precipitation estimates from PR. The identification of the BB is there-fore an important step in correcting precipitation data (Kitchen 1997; Pfaff et al., 2014). Since the magni-tude of the BB peak in the reflectivity profile is depen-dent on the precipitation type, it can also be used for rain-type classification (Awaka et al., 2007).
While numerous studies have been published about BB from ground based precipitation radars (e.g.Austin
and Bemis, 1950; Cluckie et al., 2000; Fabry and Zawadzki, 1995; Klaassen 1988;Pfaff et al., 2014;
Smith, 1986; Smyth and Illingworth, 1998) an in-creasing number of studies recently also presented BB heights from the space-borne PR of the Tropical Rain Measuring Mission (TRMM) by the National Aeronau-tics and Space Administration (NASA) and the Japanese Aerospace Exploration Agency (JAXA). The TRMM precipitation radar (PR) was the first weather radar to estimate precipitation over the tropics and subtropics from space. Launched in 1997, TRMM produced over 17 years of scientific data, until the satellite was turned off in April 2015. Some studies have shown the perfor-mance and statistical properties of the BB measured by the TRMM PR at a global scale (Awaka et al., 2009;
Harris et al., 2000; Shin et al., 2000; Thurai et al.,
2005). Wen et al. (2013) incorporated TRMM 3D re-flectivity structures from five overpasses to correct for the vertical profile of reflectivity (VPR) in a mountain-ous region with complex terrain, where a reliable esti-mation of surface precipitation from ground-based radar is difficult. Das et al., (2011)used monthly mean melt-ing layer heights from the data product 3A25 over the Indian region and found that the height of the BB ob-served by TRMM and a ground-based vertically looking Micro Rain Radar are in good agreement. They further-more suggest that TRMM 3A25 5× 5 degree grid data can be a good information source for average melting layer characteristics where local data are scarce. Despite numerous studies evaluating TRMM melting layer infor-mation over large areas, to our knowledge, the specific potential and applicability of TRMM PR BB estimations in high mountain regions have not been further evaluated so far.
In the following we i) analyse the spatial and tem-poral availability of TRMM PR BB data in a high mountain region in Kashmir, India; ii) compare BB data to freezing level (FL) data derived from radiosonde records and from extrapolated ground-station data; and iii) present seasonal and monthly variability in snowfall limits (TRMM PR product 2A23) and its relation to near surface rain intensity (TRMM PR product 2A25).
2
Study site and data
For this study, we focus on the region of Kashmir valley in the Indian state of Jammu and Kashmir, a broad, open valley located between the central Himalayan ranges in the north and the Pir Panjal in the south-west (cf. Fig.1a for an overview) The study area meets the criteria to be representative for a mountainous region with a complex terrain on the one hand, and disposes of long-term me-teorological station and radiosonde data (Srinagar) for comparison with the TRMM BB data on the other hand. Mountainous regions with higher data availability as for instance the European Alps lie outside the TRMM ex-tent.
The average altitude of the Kashmir valley is 1600 m asl. and the surrounding mountains rise higher than 4000 m asl. (cf. Fig.1b, which shows the topography of the study area). The climate of Kashmir Valley is tem-perate and characterized by wet and cold winters (mean air temperatures of 2 to 4 °C in December to Febru-ary at the meteorological station in Srinagar) and rel-atively dry and moderate hot monsoon seasons (mean air temperatures of about 21 °C in July and August at the meteorological station in Srinagar). On average, a total annual precipitation sum of about 710 mm was recorded between 2008 and 2014 at the meteorologi-cal station in Srinagar at 1587 m asl. The relatively high amount of rain and snowfall in winter (about 40 % of to-tal precipitation falling between December and March) is due to the western disturbances, while summer pre-cipitation events are caused by the southwestern mon-soon (Kumar and Jain, 2010). The FL height in Sri-nagar varies strongly during a year. Radiosonde obser-vations show that the 0 °C isotherm ranges from 2300 to 5500 m asl. during monsoon and from 250 to 1600 m asl. during winter (Mondal and Sarkar, 2003).
Radiosonde and meteorological station data from Srinagar, India (34.08 ° N, 74.83 ° E, 1587 m asl.), are operated by the India Meteorological Department (IMD). Radiosonde data are released normally twice a day at 0 and 12 UTC. The meteorological station is recording in 3-hour intervals.
Fig.2schematically shows vertical profiles of reflec-tivity air temperature and melting rate during a precip-itation event. The BB appears as a layer of enhanced reflectivity where the phase changes from solid to liq-uid precipitation (Fig. 2a). Melting particles have an effect on electromagnetic wave propagation, because of the strongly changing dielectric properties during
(a) (b) (c) Srinagar No. of measurements Elevation (m asl.) 75°E 35°N 34°N 33°N N 0 1 20 50 100 150 200 220 500 1000 1500 2000 2500 3000 3500 4000 4500 5000
Figure 1: (a) Overview map with the location of the Kashmir valley; (b) Topographic map of the Kashmir valley; (c) Number of
measurements of TRMM PR BB during the 17-years of measurements on a 0.1× 0.1 ° grid. The black circle indicates the 20 km distance to Srinagar.
Figure 2: Schematic of vertical profiles of (a) reflectivity; (b) air
temperature; and (c) melting rate during a precipitation event (based onSzyrmer and Zawadzki, 1999).
the melting process. Melting starts when hydromete-ors fall into a zone of 0 °C (Fig.2b). A nearly isother-mal layer with a very sisother-mall lapse rate is formed close to the 0 °C zone down to the level of maximum melt-ing rate (Fig.2c,Szyrmer and Zawadzki, 1999). The peak of reflectivity is slightly below the bottom of this quasi-isothermal layer (Szyrmer and Zawadzki, 1999,
Willis and Heymsfield, 1989).
The BB data from TRMM are available for the 17 years (1997–2015) of active TRMM measurements. The orbit of the TRMM satellite ranges between 35° north and south. The satellite overflies a certain location on the Earth’s surface at a different local time each day. One orbit lasts a bit more than 90 minutes, resulting in about 16 orbits per day. Further on, the swath width is about 250 km with 49 rays, corresponding to a horizon-tal resolution (footprint) of about 4 to 5 km. The vertical resolution of the BB is 250 m at nadir. The BB can only be retrieved when precipitation is present at the time of the satellite overfly, which means that registered BB is variable in time and space. More details on the TRMM
satellite and PR can be found in e.g. Kummerow et al.
(1998)andKozu et al. (2001).
The BB (defined in meters above sea level) is de-tected by the algorithm 2A23, which uses a spatial fil-ter method (Awaka et al. 2007). This method searches for the BB peak, as a maximum reflectivity in a window defined by the FL±2.5 km. The FL is computed using the operational global analysis of the Global Analysis data (GANAL) from the Japan Meteorological Agency. The outputs of 2A23 are then used by another algo-rithm 2A25, which estimates rainfall rates (Iguchi et al.
2000). Additionally, the BB height information is used for the rain-type classification (Awaka et al., 2007). The echo from the surface (surface clutter) is determined by the TRMM PR 1B21 algorithm and given by a ground clutter flag of -88.88 in the 2A23 product. While the de-termination of the surface echo is relatively easy for flat terrain, it gets more difficult over mountainous areas, since the surface height smears within the footprint of a radar beam and broadens the peak shape of the surface clutter (Awaka et al. 2007).
For this study, we use the BB heights from the 2A23 product (“height of bright band”). Additionally, we took the rainfall rate and type from 2A25 product (“near surface rain”, “rain type flag”) for a comparison between the BB height and rainfall intensity as well as the vertical profiles of reflectivity (“corrected reflectivity factor Z”).
3
Results and discussion
3.1 Evaluation of available BB measurements
As recording and thus the availability of BB data by TRMM PR depends on various factors, in a first step, we examined the 17-years of BB records in view of the spatial and temporal data availability. Fig.1c shows the number of registered TRMM PR BB measurements closer than 4 km to every grid point for the entire record period. The data availability is considerably higher in the
0 10 20 30 40 50 13/09/2002 Reflectivity (dBZ) 0 1000 2000 3000 4000 5000 6000 7000 8000
Height (m above ground)
2000 3000 4000 5000 6000 7000 8000 9000 10000 Height (m asl.) 0 10 20 30 40 50 02/08/2003 Reflectivity (dBZ) 0 1000 2000 3000 4000 5000 6000 7000 8000
Height (m above ground)
2000 3000 4000 5000 6000 7000 8000 9000 10000 Height (m asl.)
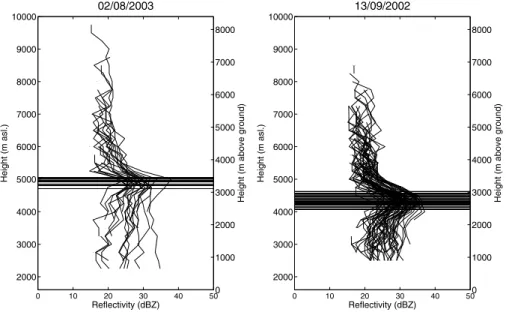
Figure 3: Vertical reflectivity profiles (2A25) for two precipitation events on 13 September 2002 and 2 August 2003 within 20 km distance
to Srinagar (black circle in Fig.1c). Horizontal lines represent BB heights (2A23) and do not relate to the x-axis. The right y-axes show BB height in m above ground (the ground being at 1600 m asl.).
valley compared to the surrounding mountain ranges. In the centre of the valley, data availability is highest with up to 220 measurements per grid cell during the 17 years of measurements. Over the mountain ranges, data availability is much lower with a maximum of only 20 records or even no data for some grid cells.
In the following, we analyse the BB measurements that were registered within a 20 km distance to Srinagar (Fig.1c, black circle). For the 17-year time record, there are 196 days with available measurements, with a total number of measurements is 3620. The reason for this high total amount of measurements is that the number of daily measurements for the area ranges between 1 to over 100 data points per day. One satellite overpass can take up to around 60 measurements within the 20 km distance to Srinagar but, in most cases, the number of measurements is relatively small (< 10 per day). Very high numbers of measurements (with more than 100 per day) are produced by two overlapping overpasses – with a time difference of about 96 to 98 minutes.
Fig. 3 shows two examples for vertical reflectivity profiles (2A25) and BB heights (2A23) for precipitation events on 13 September 2002 and 2 August 2003 within 20 km distance to Srinagar. The BB is clearly visible in the vertical profiles and seems to be detected well by the algorithm 2A23. From Fig. 3 we can also see that the ground clutter zone was masked out by the TRMM algorithms within the first 500 to 1500 m above ground (Fig.3, see right axis for height in meters above ground). It can be assumed that for mountain areas in the Himalayas, reflectivity values are masked out for considerably high elevations. Ground clutter masking is thus an important limitation for the BB detection over high elevation, mountainous regions.
The classification of the rain type is given in the TRMM PR product 2A25. For the available vertical pro-files within 20 km distance to Srinagar, 88 % are classi-fied as “certainly stratiform”, the other 12 % are “maybe stratiform”. No BB is available for convective precipita-tion events, which represents a limitaprecipita-tion for assessing snow/rain transition for this type of precipitation.
3.2 Bright band height versus freezing level
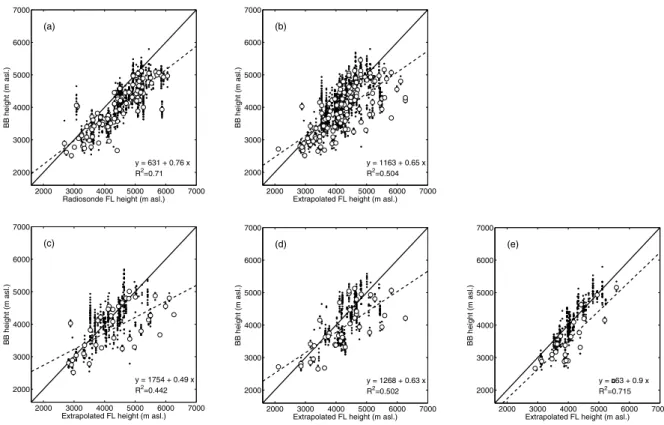
The relation between BB and FL height is important for using BB as a proxy for snow/rain transition. In a next step, we thus analysed the correlation between BB and radiosonde FL and FL extrapolated based on ground-based air temperature data from Srinagar. We only con-sidered radiosonde measurements that are separated by less than 6 hours from a TRMM satellite overflight. The extrapolated FL heights are from measurements one hour before, after or at the time of the TRMM overflight. We found that BB heights and radiosonde FL heights are clearly correlated, with a coefficient of determina-tion of R2= 0.71 (Fig.4a). Only in a few cases, the BB height is higher than the FL, mostly the BB height is be-low the FL by about 100–900 m. This finding is in line with a number of previous studies.Harris et al. (2000)
who found differences between TRMM PR BB height and NCEP (National Centers for Environmental Predic-tion) reanalysis FL to range typically between about 300 to 900 m for the tropics. AlsoAwaka et al. (2009)found that the BB height is on average about 500 m below the FL derived from NCEP reanalysis data, which is similar to 470 m from our analysis. Accordingly,Thurai et al.
(2003)found that BB heights typically occur 300 m be-low the FL heights with 90 % of the cases having differ-ences ranging within 0 to 600 m.
2000 3000 4000 5000 6000 7000 2000 3000 4000 5000 6000 7000
Radiosonde FL height (m asl.)
BB height (m asl.) y = 631 + 0.76 x R2=0.71 (a) 2000 3000 4000 5000 6000 7000 2000 3000 4000 5000 6000 7000
Extrapolated FL height (m asl.)
BB height (m asl.) y = 1163 + 0.65 x R2=0.504 (b) 2000 3000 4000 5000 6000 7000 2000 3000 4000 5000 6000 7000
Extrapolated FL height (m asl.)
BB height (m asl.) y = 1754 + 0.49 x R2=0.442 (c) 2000 3000 4000 5000 6000 7000 2000 3000 4000 5000 6000 7000
Extrapolated FL height (m asl.)
BB height (m asl.) y = 1268 + 0.63 x R2=0.502 (d) 2000 3000 4000 5000 6000 7000 2000 3000 4000 5000 6000 7000
Extrapolated FL height (m asl.)
BB height (m asl.)
y = 63 + 0.9 x R2=0.715
(e)
Figure 4: (a) TRMM BB height vs. radiosonde FL height. (b) TRMM BB height vs. extrapolated FL height from ground-based
meteorological station data in Srinagar. The three figures (c) to (e) show the same as (b), but separated into ground-based station data measured (c) one hour before, (d) at the time and (e) one hour after the TRMM BB height record. Black dots show single BB height records; white circles are mean BB values per event. Dashed lines are linear least squares regression fits to data points. The equations, regression lines and coefficients of determination R2are computed for the mean values (white circles).
Fig. 4b shows TRMM PR BB against extrapolated FL heights based on data from the meteorological sta-tion in Srinagar, using a lapse rate of 0.65 °C/100 m. The correlation is lower (R2 = 0.50) and, in some cases, the snowfall limit lies more than 1 km below the extrapo-lated FL. In order to identify these outliers, we compared the difference between BB and FL height to near surface rain intensity (TRMM PR product 2A25) and precipita-tion intensity measured at the meteorological staprecipita-tion in Srinagar. We found that the outliers in Fig.4b are not related to high precipitation rates. In contrast, large pre-cipitation intensities are generally related to small BB and FL differences. It can be thus suggested that the large differences between FL and BB heights may not be caused by valley effects, where latent heat required for melting falling snow particles is removed from the val-ley air until the snowline reaches the valval-ley bottom (de-scribed e.g.Unterstrasser and Zängl, 2006). Fig.4c,
4d and4e show that these outliers are rather related to precipitation events where air temperature was recorded 1 hour before (Fig.4c) or at the time of the TRMM over-flight (Fig.4d). In contrast, the correlation of BB and FL heights is higher when air temperature is measured 1 hour after the BB record (R2 = 0.72, Fig.4e). Interest-ingly, the time of the air temperature record seems cru-cial in estimating appropriately the melting layer with simple air temperature extrapolation techniques. If air
temperature is measured before e.g. frontal precipita-tion, relatively high air temperature records could lead to an overestimation of the FL during the following pre-cipitation event. In these cases the snowfall limit may be strongly overestimated. It also seems striking that the correlation is relatively high in Fig. 4a for the ra-diosonde FL heights, despite a larger time difference be-tween the satellite overflight and radiosonde records of up to 6 hours. Also this observation indicates that arte-facts of air temperature measurements (due to e.g. strong insolation) at the ground may lead to large uncertainties in estimating melting layers using temperature extrapo-lation techniques.
3.3 Seasonal and monthly variability
In a last step, we analysed the seasonal and monthly vari-ability of BB height for Srinagar. Fig.5shows monthly boxplots of the 17-year BB record and the radiosonde FL of the same dates. There is a clear seasonal vari-ability in the BB heights with maximum heights in Au-gust (Fig.5a). A similar seasonal variability is found in the radiosonde FL heights (Fig. 5b).Saikranthi et al.
(2013) detected similar monthly mean TRMM-derived BB heights for Patiala (around 430 km in the NNE), with the exception of some months of considerably higher BB heights in Patiala (June, July and October). Also
2000 3000 4000 5000 6000 1 2 3 4 5 6 7 8 9 10 11 12 BB height (m asl.) (a) 0 1000 2000 3000 4000 5000
BB height (m above ground)
1 2 3 4 5 6 7 8 9 10 11 12 0 200 400 600 800 Month Nr. of BB measurements (c) 2000 3000 4000 5000 6000 1 2 3 4 5 6 7 8 9 10 11 12 (b)
Radiosonde freezing level (m asl.)
0 1000 2000 3000 4000 5000
BB height (m above ground)
1 2 3 4 5 6 7 8 9 10 11 12 0 20 40 60 80 100 Month Nr. of radiosonde records (d)
Figure 5: (a) Monthly BB heights during the observation period 1998–2014; (b) Monthly radiosonde FL heights for days with BB data
available. Boxplots represent the 25th, 50th, and 75thpercentiles, whiskers represent 1.5 standard deviation and outliers are plotted with
crosses; (c) Available TRMM BB estimations per month (1997–2015); and (d) Available radiosonde records for days with TRMM BB estimations available. The right y-axes of plots (a) and (b) show BB height in m above ground (the ground being at 1600 m asl.).
monthly mean melting layer heights presented by Das
et al. (2011) based on the TRMM product 3A25 for the grid cell closest to Srinagar are similar to our results.
We found that a considerably larger number of BB data are recorded during summer (April to Septem-ber, Fig. 5c). The low number of data registered dur-ing winter (December to February) cannot be explained by fewer precipitation events only, because precipitation events are frequently observed during these months. A possible explanation for the low data availability in win-ter might be that the BB is not detected by the algorithm within the first 1000 m above ground, due to masked ground clutter. Fig.5a clearly shows that the BB is only available if it appears higher than about 1000 m above ground (corresponding to 2600 m asl.; see right axes in Fig. 5 a and b for BB and FL height in meters above ground). This means that the melting layer is probably close to the surface in winter in Srinagar, but not de-tected by the TRMM algorithm. This assumption stands in line with results by e.g.Saikranthi et al. (2013)who found BB heights lower than 2500 m asl. for Patiala around 430 km in the NNE at an elevation of 250 m asl. Due to the low altitude of Patiala, the ground clutter was only masked out up to approximately 1250 m asl., thus not affecting data availability of the BB heights.
Moreover, it can be seen from Fig.5a that the vari-ability of the BB height during a single month is con-siderably large. For example, in August, BB height ranges between 3700 to almost 6000 m. Fig.5a also in-dicates that the BB height may be low in March and April in some cases, with snowfalls at elevations below 3000 m asl. This finding is confirmed by daily snow-fall data collected from November to April by the Snow and Avalanche Study Establishment (SASE) at four lo-cations in the region of the Kashmir valley (Dimri and Mohanty, 1999).
3.4 Bright band height versus near surface rain intensity
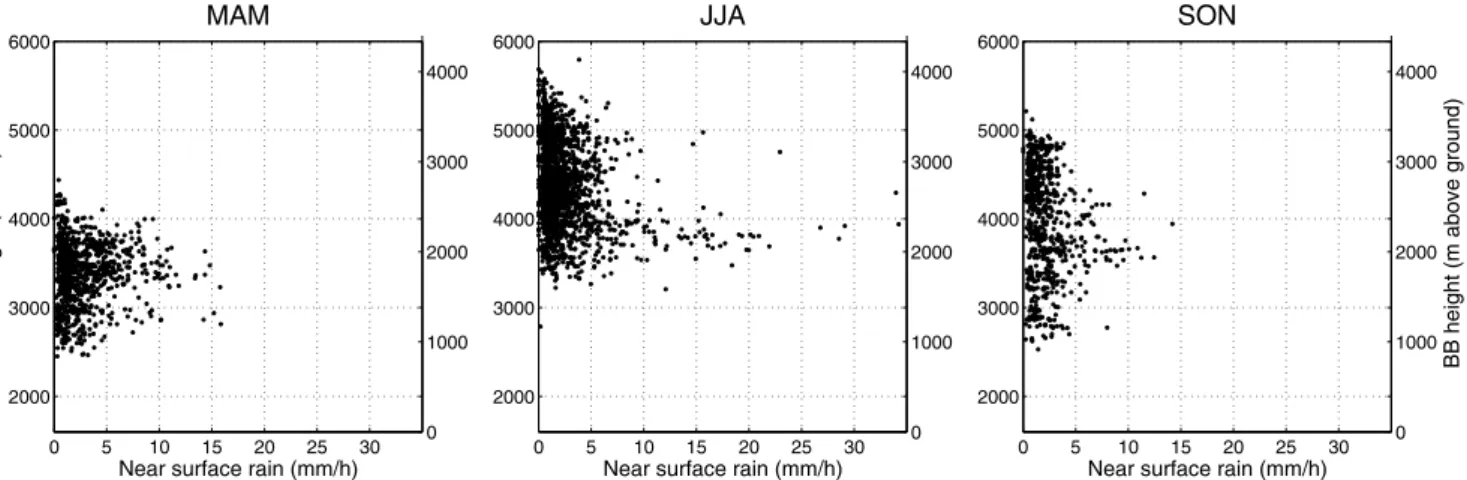
Fig. 6 shows BB heights against near surface rain in-tensity (from TRMM PR product 2A25) for the seasons MAM, JJA and SON. The winter season is not shown here, due to the low data availability (5 registered BB heights, see also Fig. 5c). As already shown in Fig.5, the BB climbs up during the summer months (JJA). While there is a large scatter of BB heights for low-to-medium rainfall intensities, relatively high rainfall in-tensities (> 15–20 mm/h) are predominantly related to relatively low BB heights of 3500 to 4000 m asl., and occur during summer. A similar pattern is observed in MAM and SON, where relatively large rainfall intensi-ties are also related to BB heights of around 3500 m asl. However, rainfall intensity from the TRMM 2A25 prod-uct is subject to considerable uncertainties, as evaluated by e.g.Kirstetter et al. (2013). Therefore, the absolute values of rainfall intensities should be evaluated care-fully when used for further analyses.
It is often mentioned in the literature that the thick-ness of BB strongly depends on precipitation intensity (e.g.Klaassen, 1988) Based on over 4000 radar scans in Southern France, the Swiss Alps and Iowa, USA
Wolfensberger et al. (2015) found that the thickness of the melting layer is strongly correlated with the in-tensity of the BB (reflectivity factor Zh), the vertical ve-locity of the hydrometeors and the presence of rimed particles (c.f. also Zawadzki et al., 2005for a detailed analysis and model). The presence of larger hydromete-ors was somewhat less correlated with the depth of the BB, but the relative importance of this correlation is also mentioned e.g. inBarthazy Meier (1998). Wolfens-berger et al. (2015)also indicate that an increased hy-drometeor concentration can lead to an increase in the
0 5 10 15 20 25 30 2000 3000 4000 5000 6000
Near surface rain (mm/h)
MAM BB height (m asl.) 0 1000 2000 3000 4000 0 5 10 15 20 25 30 2000 3000 4000 5000 6000
Near surface rain (mm/h)
JJA 0 1000 2000 3000 4000 0 5 10 15 20 25 30 2000 3000 4000 5000 6000
Near surface rain (mm/h)
SON 0 1000 2000 3000 4000
BB height (m above ground)
Figure 6: BB height against near surface rain intensity (mm/h) from the TRMM PR product 2A25 for the seasons MAM, JJA and SON.
The right y-axes show BB height in m above ground (the ground being at 1600 m asl.).
diabatic cooling of the surrounding air during the melt-ing process, which can increase the thickness of the melting layer, as particle melting takes more time. They did not find a significant correlation between the rain-fall intensity and the altitude of the BB. However, for tropical conditionsDurden et al. (1997)did find a clear dependence which is more in line with our findings for the summer season in India (Fig.6).
Our data suggest that the snowfall limit drops during intense large monsoonal precipitation events (> 10 mm/h) in summer. It seems that only during rel-atively low precipitation intensities, the snowfall limit rises above about 5000 m asl. The low snowfall limit during high intensity precipitation events has a large influence for instance on the hydrology and glacier mass balance in this region. This means, for example, that after intense precipitation events on Nanga Parbat (8126 m asl., located 130 km to the north of Srinagar) the snowline may lie clearly below the mean glacier eleva-tion (5140 and 4720 m asl. on the north and south side of the mountain, respectively,Shroder et al., 2000). A low snowline after a summer precipitation event has a posi-tive (or less negaposi-tive) effect on glacier mass balance due to both, increased accumulation and lower melt energy via albedo effects. The snowfall limit has also a large influence on runoff generation, since the height of the snowline determines the portion of precipitation leading to direct runoff – hence an important quantity for runoff prediction.
4
Conclusions
This study presents an evaluation of TRMM PR BB data and seasonal variability over a mountainous region in the Indian Himalaya. Moreover, BB heights were compared to radiosonde data as well as to extrapolated FL heights from a ground station in Srinagar, Kashmir Valley, India. Our study has shown that BB data availability in high mountain area may be limited. It requires that there is a stratiform precipitation event during the satellite over-pass and that the zone of the enhanced reflectivity is
high enough above the surface. Especially, BB data over mountainous regions and/or during winter are limited, since the snow/rain transition is relatively close to the surface. Despite the small number of data over high mountains, data from greater mountain valleys or the surrounding lowlands provide valuable information, po-tentially able to provide information on snowfall limit where in-situ data are sparse.
Our findings are basically in line with previous stud-ies showing that the TRMM PR BB height is strongly correlated to the FL from radiosonde data. The BB height does not directly correspond to the FL but in most cases rather lies around 200 to 800 m below the 0 °C line. The difference between the snowfall limit and the FL may depend on various factors like precipitation intensity, stability of the atmosphere, topographical in-fluences and others. Further on, we found that the BB altitude is less (but still well) correlated to the extrapo-lated FL from a ground station. Interestingly, the correla-tion depends on the time difference between the ground-based measurement and the TRMM PR overflight. This means that large uncertainties could appear when we ex-trapolate snowfall limit from ground-based air tempera-ture measurements, especially when the air temperatempera-ture is measured before the precipitation event. In conclu-sion, for a particular stratiform precipitation event where BB data are available, the extrapolation approach could be validated, and hopefully even be calibrated, and thus represents a promising application for data sparse re-gions.
The 17-year set of BB data could be used to as-sess statistical properties of e.g. seasonal or regional snow/rain transition. We found a strong seasonal and even monthly variability of the snowfall limit. Intense precipitation events are related to relatively low snow-fall limits during summer – an important finding in view of TRMM PR BB application for studies on e.g. glacier mass balance or mountain hydrology.
From our results we conclude that BB data from TRMM PR offer a valuable additional data source par-ticularly in combination with other data products. The
TRMM mission has come to an end in 2015, but the new Global Precipitation Measurement (GPM) was initiated in 2014 and is now operating. It is a joint mission be-tween JAXA and NASA, as well as other international space agencies, building upon the success of TRMM. A new core satellite carries a Dual-frequency Precipitation Radar (DPR,Kobayashi and Iguchi, 2003). Since the horizontal and vertical resolution of the GPM PR are similar, the here presented information of 17-year BB data for mountainous regions will be useful for further analyses of future BB data.
5
Acknowledgements
This study was funded by the Swiss Agency for Devel-opment and Cooperation (SDC) under the Indian Hi-malayas Climate Adaptation Programme (http://ihcap. in). We acknowledge the use of station and radiosonde data provided by the India Meteorological Department (IMD). TRMM PR 2A23 and 2A25 data are obtained from the Japan Aerospace Exploration Agency (JAXA) and the National Aeronautics and Space Administration (NASA). We are grateful for the comments by the editor and an anonymous reviever, who helped to substantially improve this paper.
References
Austin, P.M., A.C. Bemis, 1950: A quantitative study of the “bright band” in radar precipitation echoes. – J. Meteor. 7, 145–151.
Awaka, J., T. Iguchi, K. Okamoto, 2007: Rain Type Classifica-tion Algorithm TRMM PR 2A23 V6. – 2nd TRMM Interna-tional Science Conference, extended abstract.
Awaka, J., T. Iguchi, K. Okamoto, 2009: TRMM PR Stan-dard Algorithm 2A23 and its Performance on Bright Band Detection. – J. Meteor. Soc. Japan 87A, 31–52. DOI: 10.2151/jmsj.87A.31.
Barthazy Meier, E.J., 1998: Microphysical properties of the melting layer. – Diss. ETH Zurich No. 12687.
Battan, L.J., 1973: Radar observation of the atmo-sphere. – The Univ. of Chicago Press, 324 pp. DOI: 10.1002/qj.49709942229.
Benn, D.I., F. Lehmkuhl, 2000, Mass balance and equilibrium-line altitudes of glaciers in high-mountain environments. – Quat Int. 65, 15–29. DOI:10.1016/S1040-6182(99)00034-8. Bolch, T., A. Kulkarni, A. Kääb, C. Huggel, F. Paul,
J.G. Cogley, F. Frey, J.S. Kargel, K. Fujita, M. Scheel, S. Bajracharya, M. Stoffel, 2012: The State and Fate of Himalayan Glaciers. – Science 336, 310–314. DOI: 10.1126/science.1215828.
Cluckie, I.D., R.J. Griffith, A. Lane, K.A. Tilford, 2000: Radar hydrometeorology using a vertically point-ing radar. – Hydrol. Earth Syst. Sci. 4, 565–580. DOI: 10.5194/hess-4-565-2000.
Das, S., A. Maitra, A.K. Shukla, 2011: Melting layer charac-teristics at different climatic conditions in the Indian region: Ground based measurements and satellite observations. – At-mos. Res. 101, 78–83. DOI:10.1016/j.atmosres.2011.01.013. Dimri, A.P., U.C. Mohanty, 1999: Snowfall Statistics of Some
SASE Field Stations in J&K. – Defence Sci. J. 49, 437–445. DOI:10.14429/dsj.49.3858.
Durden, S.L., A. Kitiyakara, E. Im, A.B. Tanner, Z.S. Had-dad, F.K. Li, W.J. Wilson, 1997: ARMAR Observa-tions of the Melting Layer During TOGA COARE. – IEEE Trans. Geosci. Remote Sens. 35, 1453–1456. DOI: 10.1109/36.649800.
Fabry, F., I. Zawadzki, 1995: Long-Term Radar Ob-servations of the Melting Layer of Precipitation and Their Interpretation. – J. Atmos. Sci. 52, 838–851. DOI: 10.1175/1520-0469(1995)052<0838:LTROOT>2.0.CO;2. Harris, G.N., K.P. Bowman, D.-B. Shin, 2000:
Com-parison of Freezing-Level Altitudes from the NCEP Reanalysis with TRMM Precipitation Radar Bright-band Data. – Am. Meteor. Soc. 13 4137–4148. DOI: 10.1175/1520-0442(2000)013<4137:COFLAF>2.0.CO;2. Iguchi, T., T. Kozu, R. Meneghini, J. Awaka, K. Okamoto,
2000: Rain-Profiling Algorithm for the TRMM Precipi-tation Radar. – J. Appl. Meteor. 39, 2038–2052. DOI: 10.1175/1520-0450(2001)040<2038:RPAFTT>2.0.CO;2.
Immerzeel, W.W., P. Droogers, S.M. De Jong,
M.F.P. Bierkens, 2009: Large-scale monitoring of snow cover and runoff simulation in Himalayan river basins using remote sensing. – Remote Sens. Environ. 113, 40–49. DOI: 10.1016/j.rse.2008.08.010.
Kirstetter, P.-E., Y. Hong, J.J. Gourley, M. Schwaller, W. Petersen, J. Zhang, 2013: Comparison of TRMM 2A25 Products, Version 6 and Version 7, with NOAA/NSSL Ground Radar–Based National Mosaic QPE – J. Hydrometeorol. 14 661–669. DOI:10.1175/JHM-D-12-030.1.
Kitchen, M., 1997: Towards improved radar estimates of sur-face precipitation at long range. – Quart. J. Roy. Meteor. Soc.
123, 145–163. DOI:10.1002/qj.49712353706.
Klaassen, W., 1988: Radar Observations and
Sim-ulation of the Melting Layer of Precipitation. – J. Atmos. Sci. 45, 3741–3753. DOI:10.1175/ 1520-0469(1988)045<3741:ROASOT>2.0.CO;2.
Kobayashi, S., T. Iguchi, 2003: Variable Pulse Repetition Fre-quency for the Global Precipitation Measurement Project (GPM). – IEEE Trans. Geosci. Remote Sens. 41, 1714–1718. DOI:10.1109/TGRS.2003.813700.
Kozu, T., T. Kawanishi, H. Kuroiwa, M. Kojima, K. Oikawa, H. Kumagai, K. Okamoto, M. Okumura, H. Nakatsuka, K. Nishikawa, 2001: Development of Precipitation Radar Onboard the Tropical Rainfall Measuring Mission (TRMM) Satellite. – IEEE Trans. Geosci. Remote Sens. 39, 102–116. DOI:10.1109/36.898669.
Kumar, V., S.K. Jain, 2010: Trends in seasonal and annual rainfall and rainy days in Kashmir Valley in the last century. – Quat. Int. 212, 64–69. DOI:10.1016/j.quaint.2009.08.006.
Kummerow, C., W. Barnes, T. Kozu, J. Shiue,
J. Simpson, 1998: The Tropical Rainfall Measur-ing Mission (TRMM) Sensor Package. – J. Atmos. Ocean. Technol. 15, 809–817. DOI:10.1175/ 1520-0426(1998)015<0809:TTRMMT>2.0.CO;2.
Mondal, N.C., S.K. Sarkar, 2003: Rain height in relation to 0 °C isotherm height for satellite communication over the Indian Subcontinent. – Theor. Appl. Climatol. 76, 89–104. DOI:10.1007/s00704-003-0002-y.
Pfaff, T., A. Engelbrecht, J. Seidel, 2014: Detection of the bright band with a vertically pointing k-band radar. – Meteo-rol. Z. 23, 527–534. DOI:10.1127/metz/2014/0605.
Rohrer, M., N. Salzmann, M. Stoffel, A.V. Kulkar-ni, 2013: Missing (in-situ) snow cover data hampers climate change and runoff studies in the Greater Hi-malayas. – Sci. Total Env. 468–470 (Suppl) S60-S70. DOI: 10.1016/j.scitotenv.2013.09.056.
Saikranthi, K., T. Narayana Rao, B. Radhakrishna, S. Vijaya Bhaskara Rao, 2013: Impact of
Misrepre-sentation of Freezing-Level Height by the TRMM Algo-rithm on Shallow Rain Statistics over India and Adjoining Oceans. – J. Appl. Meteor. Climatol. 52, 2001–2008. DOI: 10.1175/JAMC-D-12-0298.1.
Shin, D.-B., G.R. North, K.P. Bowman, 2000: A Sum-mary of Reflectivity Profiles from the First Year of TRMM Radar Data. – J. Climate 13, 4072–4086. DOI: 10.1175/1520-0442(2000)013<4072:ASORPF>2.0.CO;2. Shroder, J.F., M.P. Bishop, L. Copland, V.F. Sloan, 2000:
Debris-covered Glaciers and Rock Glaciers in the Nanga Parbat Himalaya, Pakistan. – Geogr. Ann. 82, 17–31. DOI: 10.1111/j.0435-3676.2000.00108.x.
Smith, C.J., 1986: The Reduction of Errors Caused by Bright Bands in Quantitative Rainfall Measurements Made Using Radar. – J. Atmos. Ocean. Technol. 3 DOI: 10.1175/1520-0426(1986)003<0129:TROECB>2.0.CO;2. Smyth, T.J., A.J. Illingworth, 1998: Radar estimates of
rain-fall rates at the ground in bright band and non-bright band events. – Quart. J. Roy. Meteor. Soc. 124, 2417–2434. DOI: 10.1002/qj.49712455112.
Szyrmer, W., I. Zawadzki, 1999: Modeling of
the Melting Layer. Part I: Dynamics and Micro-physics. J. Atmos. Sci. 56, 3573–3592. DOI:10.1175/ 1520-0469(1999)056<3573:MOTMLP>2.0.CO;2.
Thurai, M., E. Deguchi, T. Iguchi, K. Okamoto, 2003: Freez-ing height distribution in the tropics. – Int. J. Satell. Commun. Network 21, 533–545. DOI:10.1002/sat.768.
Thurai, M., E. Deguchi, K. Okamoto, E. Salonen, 2005: Rain height variability in the Tropics.3 Microwaves, Antennas Propagation. – IEE Proc. 152, 17–23. DOI: 10.1049/ip-map:20041146.
Unterstrasser, S., G. Zängl, 2006: Cooling by melting pre-cipitation in Alpine valleys: An idealized numerical modelling study. – Quart J. Roy. Meteor. Soc. 132, 1489–1508. DOI: 10.1256/qj.05.158.
Wen, Y., Q. Cao, P.-E. Kirstetter, Y. Hong, J.J. Gour-ley, J. Zhang, G. Zhang, B. Yong, 2013: Incorporat-ing NASA Spaceborne Radar Data into NOAA National Mosaic QPE System for Improved Precipitation Measure-ment: A Physically Based VPR Identification and Enhance-ment Method. – J. Hydrometeorol. 14, 1293–1307. DOI: 10.1175/JHM-D-12-0106.1.
Willis, P.T., A.J. Heymsfield, 1989: Structure of the Melting Layer in Mesoscale Convective System Strati-form Precipitation. – J. Atmos. Sci. 46 2008–2025 DOI: 10.1175/1520-0469(1989)046<2008:SOTMLI>2.0.CO;2. Wolfensberger, D., D. Scipion, A. Berne, 2015: Detection
and characterization of the melting layer based on polarimetric radar scans. – Quart. J. Roy. Meteor. Soc., first published online: 4 NOV 2015, DOI:10.1002/qj.2672.
Zawadzki, I., W. Szyrmer, C. Bell, F. Fabry, 2005: Modeling of the Melting Layer. Part III: The Density Effect. – J. Atmos. Sci. 62, 3705–3723. DOI:10.1175/JAS3563.1.