HAL Id: inserm-01726565
https://www.hal.inserm.fr/inserm-01726565
Submitted on 8 Mar 2018HAL is a multi-disciplinary open access archive for the deposit and dissemination of sci-entific research documents, whether they are pub-lished or not. The documents may come from teaching and research institutions in France or abroad, or from public or private research centers.
L’archive ouverte pluridisciplinaire HAL, est destinée au dépôt et à la diffusion de documents scientifiques de niveau recherche, publiés ou non, émanant des établissements d’enseignement et de recherche français ou étrangers, des laboratoires publics ou privés.
Distinct interplay between atrophy and hypometabolism
in Alzheimer’s versus semantic dementia
Alexandre Bejanin, Renaud Joie, Brigitte Landeau, Serge Belliard, Vincent de
la Sayette, Francis Eustache, Béatrice Desgranges, Gaël Chételat
To cite this version:
Alexandre Bejanin, Renaud Joie, Brigitte Landeau, Serge Belliard, Vincent de la Sayette, et al.. Distinct interplay between atrophy and hypometabolism in Alzheimer’s versus semantic dementia. Cerebral Cortex, Oxford University Press (OUP), In press, Cerebral cortex, Epub ahead of print. �inserm-01726565�
1
Distinct interplay between atrophy and hypometabolism in Alzheimer’s versus semantic dementia
Alexandre Bejanin, PhD 12*, Renaud La Joie, PhD 1, Brigitte Landeau, Ms 12, Serge Belliard,
MD 13, Vincent de La Sayette, MD 14, Francis Eustache, PhD 1, Béatrice Desgranges, PhD 1
and Gaël Chételat, PhD12
1
Normandie Université, UNICAEN, PSL Research University, EPHE, Inserm, U1077, CHU de Caen, Neuropsychologie et Imagerie de la Mémoire Humaine, 14000 Caen, France
2
Inserm, Inserm UMR-S U1237, Université de Caen-Normandie, GIP Cyceron, Boulevard H. Becquerel, 14000 Caen
3
Service de Neurologie, CHU Pontchaillou, Rennes, France
4
Service de Neurologie, CHU de Caen, Caen, France
*Corresponding Author: Alexandre Bejanin Inserm UMR-S U1237
GIP Cyceron
Boulevard Henri Becquerel F-14074 Caen Cedex France
Phone: +33 (0)2 31 47 01 73 e-mail: bejanin@cyceron.fr
Additional Title Page: Atrophy - Hypometabolism Discrepancies
Number of characters in the title: 93 Number of characters in running head: 38 Number of words in the abstract: 148 Total word count (main text): 4374
Number of figures: 5 Color figures: 5 Tables: 1 Supplemental information: Yes - 5 figures.
2
Abstract
Multimodal neuroimaging analyses offer additional information beyond that provided by each neuroimaging modality. Thus, direct comparisons and correlations between neuroimaging modalities allow revealing disease-specific topographic relationships. Here, we compared the topographic discrepancies between atrophy and hypometabolism in two neurodegenerative diseases characterized by distinct pathological processes, namely Alzheimer’s disease (AD) versus semantic dementia (SD), to unravel their specific influence on local and global brain structure-function relationships. We found that inter-modality topographic discrepancies clearly distinguished the two patient groups: AD showed marked discrepancies between both alterations, with greater hypometabolism than atrophy in large posterior associative neocortical regions, while SD showed more topographic consistency between atrophy and hypometabolism across brain regions. These findings likely reflect the multiple pathologies versus the relatively unitary pathological process underlying AD versus SD respectively. Our results evidence that multimodal neuroimaging-derived indexes can provide clinically-relevant information to discriminate the two diseases, and potentially reveal distinct neuropathological processes.
Keywords: Alzheimer's Disease; FDG-PET; Multimodal neuroimaging; Neurodegeneration;
3
Introduction
Neurodegenerative disorders, such as Alzheimer’s or semantic dementia, are characterized by the presence of disease-specific protein aggregates in and around neuronal cells. Growing evidence supports the idea that these protein aggregates develop in a topographic pattern (e.g., (Braak and Braak, 1991; Thal et al., 2002)) and spread within pre-existing networks (Seeley et al., 2009). Despite the fact that different disease-specific protein abnormalities might spread in distinct brain networks, they may also overlap in certain brain regions. Thus, the neuropathology associated with semantic dementia, which consists of intraneuronal aggregates of TDP-43 Type C in most cases (Hodges et al., 2010), overlaps with the tau pathology observed in Alzheimer’s disease in different brain regions, such as medial and anterior temporal lobe regions (Braak and Braak, 1991; Davies et al., 2005, 2009). These lesions are associated with neurodegeneration, which is at least partly reflected in gray matter atrophy and glucose hypometabolism measured with structural MRI and positron emission tomography with 18F-fluorodeoxyglucose (18FDG-PET), respectively. The overlapping
alterations in Alzheimer’s disease and semantic dementia have been highlighted in previous neuroimaging studies showing common gray matter atrophy to both disorders in medial temporal lobe structures (e.g., hippocampus, amygdala, entorhinal and parahippocampal cortex), lateral temporal and orbitofrontal regions (Chan et al., 2001; Galton et al., 2001; Nestor et al., 2006; Schroeter and Neumann, 2011; La Joie et al., 2013, 2014; Bejanin et al., 2017). Similarly, both Alzheimer’s disease and semantic dementia harbored decreased metabolism in medial and lateral temporal regions (Nestor et al., 2006; Drzezga et al., 2008).
Despite these common regional injuries, there are striking differences between both diseases in the respective relationships between atrophy and hypometabolism patterns. Indeed, Alzheimer’s disease is characterized by strong pattern discrepancies, with predominant
4 atrophy in medial and lateral temporal areas versus predominant hypometabolism in posterior cingulate, precuneus and temporoparietal areas (Chételat et al., 2008; La Joie et al., 2012; Kljajevic et al., 2014; Grothe et al., 2016). By contrast, the few studies that examined both structural MRI and 18FDG-PET in semantic dementia revealed similar patterns of atrophy and
hypometabolism in the temporal lobe and orbitofrontal regions, even though decreased metabolism might be slightly more extended than gray matter loss (Desgranges et al., 2007; Acosta-Cabronero et al., 2011; Moodley et al., 2013). However, to our knowledge, no study to date compared these alterations statistically and/or explored their relationships across the whole gray matter in semantic dementia. Yet, direct comparisons between these modalities have allowed unraveling topographic discrepancies in Alzheimer’s disease (e.g., brain regions maintaining neuronal activity despite structural alterations versus regions presenting with excessive hypometabolism relative to atrophy) that pointed to specific pathological processes (Alsop et al., 2008; Chételat et al., 2008; La Joie et al., 2012). This includes potential synaptic compensatory mechanisms, hypometabolism-inducing factors, but also the differential sensitivity of neuroimaging modalities to pathological processes.
Here, we applied multimodal neuroimaging techniques specifically designed for between-modality comparisons and correlations to assess the effects of distinct pathological processes on the brain structure-function relationship. Specifically, we aimed at comparing the topographic discrepancies and relationships between gray matter atrophy and hypometabolism in patients with Alzheimer’s disease versus semantic dementia. We expected more pronounced regional discrepancy and weaker relationships between atrophy and hypometabolism in Alzheimer’s disease compared to semantic dementia, as a reflection of their distinct underlying pathological processes (i.e., less unitary in Alzheimer’s disease than semantic dementia).
5 To address this question, we first computed age-adjusted Z-scores maps of atrophy and hypometabolism for each patient and performed voxelwise between-modality comparisons to identify regions showing atrophy-hypometabolism discrepancy in each group. We then carried out between-group comparisons and statistical conjunctions to assess respectively differences and similarities between both disorders in their pattern of discrepancy. Finally, we used voxel-to-voxel correlations at the group and individual levels to test differences between Alzheimer’s disease and semantic dementia in the topographic consistency between atrophy and hypometabolism.
Materials and methods
Participants
Twenty-one patients with amnestic Alzheimer’s disease, 16 patients with semantic dementia and 39 healthy controls matched for age, sex and years of education were included in the present study (for details about demographic data, see Table 1). All participants were enrolled in the Imagerie Multimodale de la Maladie d’Alzheimer à un stade Précoce (IMAP+) or in the Troubles cognitifs et émotionnels dans la Sclérose Latérale Amyotrophique: Etude
neuropsychologique, en imagerie et neuropathologique (SLAMEM) studies (Caen, France).
Both studies were approved by a regional ethics committee (Comité de Protection des Personnes Nord-Ouest III) and are registered with http://clinicaltrials.gov (number NCT01638949 for IMAP+ and NCT01530438 for SLAMEM). All participants gave written informed consent to the study prior to the investigation.
6
Table
Table 1: Demographic data and neuropsychological features of patients with Alzheimer’s disease, patients with semantic dementia and normal controls.
Note: Unless otherwise indicated, values are mean ± standard deviation. Except for sex ratio (for which Fisher exact test was used), P values [Eta squared] refer to significant analyses of variance models, followed by post hoc pairwise comparisons with Bonferroni correction. AD: Alzheimer’s disease; MDRS: Mattis dementia rating scale; NC: Normal controls; ns: non-significant; SD: Semantic dementia.
a
Data missing for one subject. b Data missing for two subjects. c Data missing for three subjects.
Patients with AD Patients with SD Normal controls Group Comparison (P values)
Post hoc test
(P Values) AD vs NC SD vs NC SD vs AD N 21 16 39 Gender (Male/Female) 10/11 7/9 19/20 0.9 Age (years) 69.9 ± 9.1 67.3 ± 6 68.9 ± 7 0.6 [0.01] Education (years) 10.5 ± 3.7 11.5 ± 4.1 11.9 ± 3.9 0.4 [0.02] MDRS (/144) 115.8 ± 12.1c 117.7 ± 9.9 141.9 ± 2.7 <.001 [0.73] <.001 <.001 1
MDRS Episodic memory subscale (/25) 14.8 ± 3.2c 18.6 ± 4.2 24.5 ± 0.9 <.001 [0.73] <.001 <.001 <.001
MDRS Concept subscale (/39) 33 ± 6.4c 32 ± 3.5 38 ± 1.5 <.001 [0.36] <.001 <.001 1
Picture naming (/80) 74.5 ± 7b 34.1 ± 18.2 79.9 ± 0.3 <.001 [0.81] 0.1 <.001 <.001
Categorical fluency (animals – 2min) 14.3 ± 7.6 8.9 ± 4.3a 33.1 ± 8.4 <.001 [0.67] <.001 <.001 0.1
Phonemic fluency (“P” – 2 min) 13.1 ± 6.6 11 ± 4.3a 22.4 ± 6.8 <.001 [0.41] <.001 <.001 1
Copy of Rey-Osterrieth complex figure (/36) 25.5 ± 11.8c 35.1 ± 1.9 35.4 ± 1.2 <.001 [0.35] 1 <.001 <.001
7 Part of these subjects was included in previous publications from our laboratory (Duval, Bejanin, et al., 2012; Duval, Desgranges, et al., 2012; Arenaza-Urquijo et al., 2013; La Joie
et al., 2013, 2014). All participants had at least 7 years of education and did not present with
a history of alcoholism, drug abuse, head trauma, or psychiatric disorder. Healthy controls were recruited from the community and had normal performances in a range of neuropsychological tests assessing multiple domains of cognition (episodic and semantic memory, executive functions, visuospatial functions and praxis).
Patient diagnoses were made by senior neurologists in French expert centers (University Hospitals of Caen, Rennes, and Rouen) according to the core clinical criteria of the National Institute of Neurological and Communicative Disorders and Stroke, and the Alzheimer’s Disease and Related Disorders Association (NINCDS-ADRDA) workgroup for probable Alzheimer’s disease (McKhann et al., 1984) and the clinical diagnostic criteria for semantic variant of primary progressive aphasia (Gorno-Tempini et al., 2011). In order to maximize the homogeneity of the Alzheimer’s disease group, only patients with an amnestic presentation were selected in this study. Thus, patients with visual or language-predominant phenotypes of Alzheimer’s disease (i.e., posterior cortical atrophy and logopenic variant primary progressive aphasia respectively) were not included. Moreover, all Alzheimer’s disease patients had a Florbetapir-PET scan and were found to be amyloid-β-positive using previously published methods (La Joie et al., 2012), increasing the likelihood of Alzheimer’s disease etiology (McKhann et al., 2011).
All subjects underwent both a neuroimaging session and a standard neuropsychological battery (see Table 1). Between-group comparisons of neuropsychological performances revealed that both patient groups had a similar degree of global cognitive deficits (assessed with the Mattis Dementia Rating Scale, MDRS) but distinct profiles of cognitive impairment. Alzheimer’s disease patients showed more impairment than semantic dementia at the MDRS
8 episodic memory subtest and Copy of Rey-Osterrieth complex figure. In contrast, patients with semantic dementia had significantly worse performance than Alzheimer’s disease in the naming task and tended to have lower performance in the categorical fluency task.
Neuroimaging data acquisition
All participants were scanned on the same MRI (Philips Achieva 3.0 T scanner) and PET (Discovery RX VCT 64 PET-CT device, General Electric Healthcare) cameras at the CYCERON Centre (Caen, France). The interval time between the two acquisitions was on average of 17 ± 30 days. Further details on the acquisition procedures are provided in the Supplemental Material.
Neuroimaging data handling and transformation
PreprocessingNeuroimaging data processing was performed using the Statistical Parametric Mapping Version 8 (SPM8) software (Wellcome Department of Imaging Neuroscience, Institute of Neurology, London, England) implemented in MATLAB 7.4 (The MathWorks, Sherborn, MA). T1-MRI were segmented using the VBM8 toolbox and spatially normalized to a population template generated from the complete image set using a diffeomorphic registration algorithm (DARTEL; (Ashburner, 2007)). 18FDG-PET data were corrected for
partial volume effects (PMOD Technologies), coregistered onto their corresponding MRI, and normalized using the deformation parameters defined from the MRI procedure. Resultant images were quantitatively normalized using the cerebellar gray matter as the reference region. As 18FDG-PET and T1-weighted anatomical images did not have the same original
spatial resolution, a differential Gaussian kernel smoothing was applied to obtain an equivalent data effective smoothing of 10 mm FWHM (Chételat et al., 2008; Villain et al.,
9 2008; La Joie et al., 2012). Resultant images were finally masked to exclude non-gray matter voxels as well as the cerebellum from the analyses.
Generation of W-score maps
To obtain measurements of atrophy and hypometabolism in the same unit, we computed W-score maps for each patient and each imaging modality following a previously published method from our laboratory (La Joie et al., 2012). W-scores correspond to Z-scores adjusted for specific covariates; age (and TIV for MRI) in the present case. Briefly, to generate W-score maps, we first performed voxelwise regressions in SPM8 to estimate the effects of age (and TIV for MRI) on each imaging data in the control group. These analyses resulted in beta maps for age (and TIV for MRI) and residual maps for each control. These maps were then used to compute voxelwise maps of W-scores for each patient, using the following formula: W-score = [(patient’s raw value) - (patient’s expected value)]/standard deviation of the residuals in controls, where patient’s expected value corresponded to the predicted value in the control group for the patient’s age (and TIV for MRI).
Statistical analyses
Comparing local atrophy and hypometabolism
Individual W-score maps of atrophy and hypometabolism were entered into a voxelwise repeated measures analysis of variance (ANOVA) in SPM8 (flexible factorial design). First, comparisons between the two alterations were performed within each patient group. Between-group comparisons and statistical conjunctions were then carried out to highlight differences and similarities between both disorders in their pattern of atrophy-hypometabolism mismatch. The family-wise error (FWE) corrected threshold was set at
10
Relationships between atrophy and hypometabolism
The topographic consistency between patterns of atrophy and hypometabolism was assessed within each group using voxel-based correlation analyses (for a similar approach, see (Buckner et al., 2009). To do so, individual W-score maps of atrophy and hypometabolism were averaged across patients for each imaging modality and each patient group. Then, Pearson correlations were computed across all gray matter voxels between the group average value of atrophy and the group average value of hypometabolism (for illustration, see Figure 1A). The Pearson correlation coefficients of the two patient groups were then compared using the Fisher r-to-z transformation. The same Pearson correlation analyses between all gray matter voxels of atrophy and hypometabolism were also performed individually (i.e. from the W-score maps of each participant) in order to obtain one Pearson correlation coefficient per subject, reflecting individual consistency in the local degree of atrophy and hypometabolism (for illustration, see Figure 1B). Fisher r-to-z-transformed values of the two patient groups were then compared using a Student’s T-test. Finally, to assess the consistency in the local degree of atrophy and hypometabolism across different brain regions, the same procedure was repeated in each brain region of the Loni Atlas (Shattuck et al., 2008) separately, i.e. we computed one Pearson correlation coefficient per subject per region and compared the regional Fisher r-to-z-transformed values between the two patient groups with Student’s
12 Figure 1: Method used for the voxel-to-voxel correlation analyses.
(A) Within each group separately, Pearson correlations were computed across all gray matter voxels between the group average value of atrophy and the group average value of hypometabolism, i.e., the mean W-score maps of gray matter volume and metabolism. This method has been used for the analyses shown in Figure 4.
(B) Pearson correlations were computed for each individual across all gray matter voxels between the value of atrophy and hypometabolism, i.e., using the individual W-score maps of gray matter volume and metabolism. These values were then Fisher r-to-z-transformed and analyzed at the group-level using Student’s T-test. This method has been used for the analyses shown in Figure 5A.
(C) Using a similar procedure, Pearson correlations were computed for each individual between the value of atrophy and hypometabolism across all gray matter of each brain region of the Loni Atlas (Shattuck et al., 2008). The figure illustrates this scenario for the right precuneus. Pearson coefficients were then Fisher r-to-z-transformed and analyzed at the group-level using Student’s T-test (i.e., one model for each brain region). This method has been used for the analyses shown in Figure 5B-D.
13
Results
Patterns of gray matter atrophy and hypometabolism
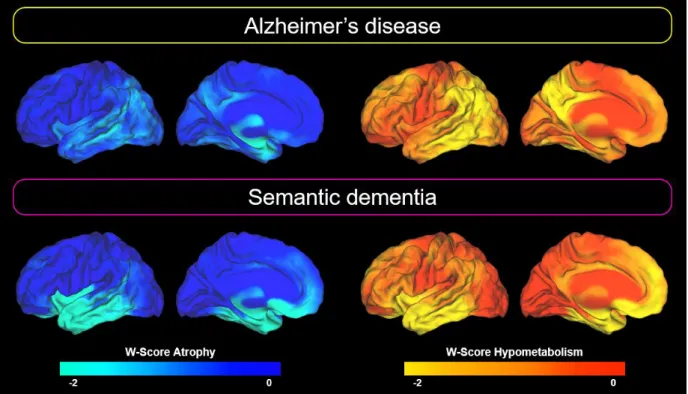
Averaged W-score maps for each imaging modality and each group are shown in Figure 2 (see also Supplementary Figure S1 for voxelwise one sample t-test results). Briefly, patients with Alzheimer’s disease showed atrophy in the medial and lateral temporal and inferior parietal cortices, and hypometabolism in the medial and lateral parietal, lateral tempo-occipital and dorsal prefrontal cortices. Patients with semantic dementia showed bilateral, albeit left-predominant, atrophy and hypometabolism in lateral and medial anterior temporal lobe, insula and orbitofrontal cortex.
Figure 2: Patterns of brain alteration in patients with Alzheimer’s disease and semantic dementia.
Regional degrees of alteration are expressed as mean W-score (as compared with the control group) in each gray matter voxel. For clarity, only the left hemisphere is represented here as results were sensibly similar on the contralateral hemisphere (with however less pronounced alterations in semantic dementia patients in the right than in the left hemisphere).
14
Voxelwise comparison between atrophy and hypometabolism
The degrees of atrophy and hypometabolism were then directly compared voxelwise within each clinical group. The results are displayed in Figure 3A. Atrophy significantly exceeded hypometabolism in the anterior part of the left medial temporal region including the amygdala in Alzheimer’s disease, and in the ventral temporal pole, amygdala and left hippocampus, insula, and putamen in semantic dementia. The direct comparison between groups showed no difference in the regions of higher atrophy than hypometabolism, while the statistical conjunction indicated that atrophy exceeded hypometabolism in both patient groups in the left medial temporal region (and more specifically the amygdala; Figure 3B).
The contrast assessing greater hypometabolism than atrophy revealed extended areas in Alzheimer’s disease mainly in the medial and lateral parietal, lateral temporal and dorsolateral prefrontal cortices (Figure 3A). The same comparison revealed less extended differences in semantic dementia, with only the left dorsal temporal pole and inferior frontal gyrus showing greater hypometabolism than atrophy. The between-group comparison indicated that the discrepancy was more pronounced in Alzheimer’s disease than semantic dementia in the medial and lateral parietal cortex (Figure 3C). No region showed more hypometabolism than atrophy in semantic dementia as compared to Alzheimer’s disease. The statistical conjunction did not show any common areas of greater hypometabolism than atrophy in both Alzheimer’s and semantic dementia.
15 Figure 3: Within- and between-group results of voxelwise comparisons between the local degrees of atrophy and hypometabolism.
(A) Voxelwise comparisons between the local degrees of atrophy and hypometabolism in patients with Alzheimer’s disease (top panel) and patients with semantic dementia (bottom panel).
(B) Voxelwise statistical conjunction showing regions with significantly more atrophy than hypometabolism in both patients with Alzheimer’s disease and patients with semantic dementia. (C) Voxelwise comparison showing brain regions where hypometabolism is higher than atrophy in patients with Alzheimer’s disease as compared to patients with semantic dementia. The boxplot represents the difference, in each group, between the mean W-scores of atrophy and hypometabolism within the significant clusters; the box represents the interquartile range, the band represents the median value, dots represent patient values and the dotted line represents an equal degree of atrophy and hypometabolism.
16
Relationship between gray matter atrophy and
hypometabolism
We then aimed at computing an index that would reflect, for each disease, the degree of topographical consistency between atrophy and hypometabolism, i.e. how much both patterns are similar and tend to co-occur in the same place and with the same degree. To do so, we averaged, for each group separately, patients’ W-score maps of atrophy on the one hand, and patients’ W-score maps of hypometabolism on the other. Then, we computed Pearson correlations across all gray matter voxels between the average value of atrophy and the average value of hypometabolism within each clinical group (for illustration of the method, see Figure 1A). The relationship was significantly lower (p<.001) in Alzheimer’s disease (r = 0.50) than in semantic dementia (r = 0.81), and the scatterplots (Figure 4) showed distinct patterns in the two diseases. The cloud of points was sparser, and the regression line was farther from the identity line (representing an equal degree of atrophy and hypometabolism; line in red on Figure 4) for Alzheimer’s disease than semantic dementia. More specifically, while the points are relatively homogeneously distributed along the regression line in semantic dementia, two distinct clusters could be identified in Alzheimer’s disease: one above the identity line (i.e. including voxels where hypometabolism exceeded atrophy), and one below the identity line (with voxels where atrophy exceeded hypometabolism). Tracking back the location of these voxels, we found out that the former mainly included temporoparietal areas while the latter was essentially located in the medial temporal region (see Figure 4).
18 Figure 4: Voxel-to-voxel correlations between atrophy and hypometabolism in Alzheimer’s disease and semantic dementia
Scatterplots showing the voxel-to-voxel correlations between the average value of hypometabolism (x-axis) and the average value of atrophy (y-axis) in Alzheimer’s disease and semantic dementia. The red line corresponds to the identity line (y=x), representing an equal degree of atrophy and hypometabolism. Colors on scatterplots represent the brain location of each voxel (i.e., orange: occipital cortex; fuschia: parietal cortex; yellow: frontal cortex; blue: temporal cortex; red: hippocampal region).
19
Individual relationship between gray matter atrophy and
hypometabolism
Because the previous correlations were computed from averaged atrophy and hypometabolism W-score maps across patients, the weaker topographic relationships found in Alzheimer’s disease might reflect the fact that this group is more heterogeneous than semantic dementia. We thus computed the same analyses but using individual W-score maps of atrophy and hypometabolism instead of group averaged maps (for illustration, see Figure 1B). This way, we obtained one Pearson correlation coefficient per patient, which reflected the individual relationship between atrophy and hypometabolism across all gray matter voxels. As shown in Figure 5A, the weaker relationships in Alzheimer’s disease was recovered at the individual level with most Alzheimer’s disease patients showing lower correlation coefficients than most semantic dementia patients. Between-group comparison of Fisher r-to-z-transformed correlation coefficients indicated that patients with Alzheimer’s disease (Z(r) = 0.50 ± 0.12) had a significantly lower correlation coefficient (t(35)=7.31, p<0.001) than patients with semantic dementia (Z(r) = 0.81 ± 0.14).
Regional relationship between gray matter atrophy and
hypometabolism
To further understand our findings, we computed the same individual correlation analyses but within separate brain regions instead of across all gray matter voxels (for illustration, see Figure 1C). We thus obtained one Pearson correlation coefficient per patient and per brain region. For both semantic dementia and Alzheimer’s disease, although to a lower extent in the latter, the relationship between the two alterations was higher in brain regions associated with neurodegeneration, i.e. in the temporal and medial prefrontal cortex in semantic dementia and
20 the lateral parietal and temporal cortex, and anterior cingulate gyrus in Alzheimer’s disease (Figure 5C and 5D, and Supplementary Figure S2). Regional between-group comparisons of Fisher r-to-z-transformed values showed stronger correlations in semantic dementia than Alzheimer’s disease in left more than right temporal and medial prefrontal regions (Figure 5B). Stronger correlations in Alzheimer’s disease than semantic dementia were found in the right precuneus and left superior occipital gyrus. Only the stronger correlations in semantic dementia than Alzheimer’s disease in the temporal lobe and left medial prefrontal cortex (shown in red in Figure 5B) survived Bonferroni correction for multiple comparisons (α=0.05, p<0.0009, 56 models considered).
21 Figure 5: Results of the global and regional voxel-to-voxel correlations between atrophy and hypometabolism.
(A) Boxplot showing, in Alzheimer’s disease and semantic dementia, the individual Fisher r-to-z transformed values of the voxel-to-voxel correlations between atrophy and hypometabolism. The box represents the interquartile range, the band represents the median value, and the dots represent patient Fisher r-to-z transformed values, which reflects the individual degree of topographical consistency between the atrophy and hypometabolism.
22 (B) Between-group differences in the regional voxel-to-voxel correlations between atrophy and hypometabolism. Note that only regions displayed in red survived Bonferroni correction for multiple comparisons (α=0.05, p<0.0009, 56 models considered).
(C and D) Averages and coefficient of variations (CV, standard deviation/mean) of the individual Fisher r-to-z transformed values of the voxel-to-voxel correlations between atrophy and hypometabolism in Alzheimer’s disease (C) and semantic dementia (D).
Results without partial volume effect correction
In our main analyses, PET images were corrected for partial volume effects related to the limited spatial resolution of the PET and allowing to correct the PET signal for gray matter atrophy. As we aimed at assessing the relationships between atrophy and hypometabolism in Alzheimer’s disease and semantic dementia patients, this correction seemed crucial. On the other hand, it might induce an artificial dependency between MRI and PET data. To ensure that our findings were not dramatically affected by this potential bias, we replicated all our analyses using PET images not corrected for partial volume effects. Our results remained essentially unchanged (Supplementary Figures S3-5 for details).
23
Discussion
Multimodal imaging provides a unique opportunity to investigate the topographical relationship between distinct brain alterations, and thus improve our understanding of pathophysiological interactions in vivo (Teipel, Drzezga, et al., 2015). In the present study, we aimed at comparing atrophy and hypometabolism discrepancies in Alzheimer’s disease versus semantic dementia to highlight both similarities and differences in the pathological processes. Our results showed (i) more atrophy than hypometabolism in the medial temporal lobe in both disorders; (ii) a more extended pattern of topographic mismatch between hypometabolism and atrophy in Alzheimer’s disease than in semantic dementia; (iii) a high correspondence between the degree of atrophy and hypometabolism in semantic dementia versus a more complex pattern in Alzheimer’s disease, with different relationships according to brain regions. We interpret these results as reflecting distinct neuropathological processes in both diseases with a relatively unitary process in semantic dementia contrasting with a multi-determined process in Alzheimer’s disease, likely sustained by multiple pathologies including tau, amyloid-β, and vascular brain injuries.
Our findings showed that Alzheimer’s disease patients present with more atrophy than hypometabolism in the medial temporal lobe. This result is consistent with previous investigations in Alzheimer’s disease showing a greater reduction of gray matter volume than metabolism (Caroli et al., 2010; La Joie et al., 2012; Grothe et al., 2016) or cerebral blood flow (Alsop et al., 2008) in medial temporal lobe structures. Moreover, we found that patients with semantic dementia similarly presented with more atrophy than hypometabolism in medial temporal areas, as confirmed by the statistical conjunction analysis. A similar pattern has also been reported in the behavioral variant of frontotemporal dementia (Buhour et al., 2016). Altogether, these findings suggest that the discrepancy in the medial temporal lobe is
24 not disease-specific and might not be underlain by a disease-specific pathophysiological process or protein aggregate. Instead, it might reflect a common process or phenomenon proper to this region, or topographic specificities of each neuroimaging modality (e.g., different local sensitivity). The relative preservation of metabolism faced to atrophy in the medial temporal lobe has been hypothesized to reflect the residual synaptic plasticity of surviving neurons (Caroli et al., 2010) or a disconnection from excitatory neurons (Alsop et
al., 2008). Beyond the medial temporal lobe, the striatum also showed more atrophy than
hypometabolism in semantic dementia in the present study, and in Alzheimer’s disease (Alsop et al., 2008) and behavioral variant of frontotemporal dementia (Buhour et al., 2016) in previous studies. As new neurons have been found in human medial temporal lobe and striatum (Ernst and Frisén, 2015), the discrepancy in these regions may reflect neurogenesis processes. Finally, it is interesting to note that this larger pattern of topographical discrepancy coincides with the paths of the major cerebral vessels and their first few branches (Alsop et al., 2008; for atlas of brain vessels, see also Viviani, 2016). It is thus also possible that the discrepancy between hypometabolism (low) and atrophy (high) is partly related with neurovascular phenomenon (Viviani et al., 2017).
Beyond this restricted similarity between Alzheimer’s and semantic dementia, our study revealed marked differences between both diseases, with more extended regions of greater hypometabolism than atrophy in Alzheimer’s disease versus semantic dementia. While the discrepancy was essentially restricted to the core regions of atrophy and hypometabolism in semantic dementia, greater hypometabolism than atrophy involved large clusters in the medial and lateral parietal, and lateral temporal lobe in Alzheimer’s disease. The difference was further highlighted in the correlation analyses showing that the relationship between atrophy and hypometabolism was not only stronger but also closer to an equal degree of alteration (i.e., closer to the identity line), and more homogeneous across brain regions, in semantic
25 dementia than in Alzheimer’s disease. These differences between both diseases may reflect the differential effect of the underlying pathologies associated with each disorder. While TDP-43 Type C pathology account for the vast majority (75-83%) of the cases with semantic dementia (Hodges et al., 2010; Rohrer et al., 2011; Spinelli et al., 2017), Alzheimer’s disease is characterized by two pathologies with different topography in the brain: amyloid-β and tau. Growing evidence suggests that both pathologies act in concert in synapse degeneration (Ittner and Götz, 2011; Spires-Jones and Hyman, 2014). It is thus possible that the brain regions where amyloid-β and tau overlap would show excessive hypometabolism (compared to atrophy) as a reflection of their pathological interaction on synaptic functioning. In accordance with this interpretation, the brain regions showing greater hypometabolism than atrophy (i.e., temporoparietal regions) are among the first areas showing aggregates of both amyloid-β and tau (Braak and Braak, 1991).
The differences between both diseases might also reflect distinct distant effects of the neuronal damage in the hippocampal complex. Across the Alzheimer’s disease spectrum, hypometabolism in posterior cingulate and temporoparietal areas was found to be partly due to hippocampal atrophy through disruption of connecting white matter fibers (Villain et al., 2008, 2010; Choo et al., 2010; Teipel, Grothe, et al., 2015). In semantic dementia, while the hippocampus is also atrophied, the metabolism of parietal regions is relatively preserved (Nestor et al., 2006; Desgranges et al., 2007; La Joie et al., 2013). A recent study demonstrated that atrophy in the same medial temporal area was associated with distinct white matter injury in Alzheimer’s versus semantic dementia, i.e., the cingulum and corpus callosum in the former versus anterior temporal white matter fibers in the latter (Bejanin et
al., 2017). Hence, distinct hypometabolism profiles might reflect the involvement of distinct
brain networks related to the medial temporal lobe in Alzheimer’s disease versus semantic dementia (La Joie et al., 2014; Bejanin et al., 2017).
26 The larger discrepancy in Alzheimer’s versus semantic dementia might also reflect a higher prevalence of co-pathologies in Alzheimer’s disease versus semantic dementia. Indeed, even though the literature on co-pathologies in semantic dementia is still scarce, autopsy studies revealed that pathologically-confirmed frontotemporal dementia cases with semantic dementia rarely present with co-pathologies such as extracellular amyloid-β (Tan et al., 2017) or Alzheimer’s disease pathology (Davies et al., 2005; Mesulam et al., 2014). Recent evidence from animal models even suggests that TDP-43 pathology is associated with reduced amyloid-β burden, possibly due to enhanced amyloid-β clearance (Paolicelli et al., 2017). TDP-43 thus appears to be the main protein aggregate driving the neurodegenerative process in semantic dementia. Conversely, most patients with a clinical diagnosis of Alzheimer’s disease have mixed pathologies including vascular and/or other pathologies (e.g., TDP-43, α-synuclein) together with Alzheimer’s disease pathology rather than Alzheimer’s disease pathology only (Kapasi et al., 2017). Besides, the odds of a clinical diagnosis of Alzheimer’s disease is significantly increased with macroscopic infarcts (Schneider et al., 2009), cerebral vessel pathology (Arvanitakis et al., 2016), hippocampal sclerosis (Nag et al., 2015), TDP-43 (Nag et al., 2015; James et al., 2016) and Lewy bodies (Schneider et al., 2009).
Interestingly, when using individual values of atrophy-hypometabolism consistency instead of group averages our findings remained essentially unchanged. This suggests that the lower consistency observed in Alzheimer’s disease was not reflecting a greater heterogeneity, i.e. more variance in Alzheimer’s disease than semantic dementia in term of topography of the lesions and/or disease stage. Instead, we propose that the interaction between tau and amyloid-β, and/or the presence of and interaction with other co-pathologies, modify the relationship between atrophy and hypometabolism, and explain part of the difference between Alzheimer’s and semantic dementia patients. Further studies with neuropathological data are
27 required to provide a deeper understanding of the relationship between pathological processes and the individual correlations between atrophy and hypometabolism.
This study has limitations. First, our sample of patients was relatively small and studies with larger cohort may find additional differences between gray matter atrophy and hypometabolism, especially within the semantic dementia group. However, we used a stringent threshold corrected for multiple comparisons to ensure the robustness of our results. In addition, as this is a monocentric study, we used homogeneous neuroimaging data, which is particularly relevant when performing complex multimodal neuroimaging comparisons. Second, we used cross-sectional measurements of atrophy, which are influenced by intra-individual variability. Longitudinal studies might therefore be helpful to provide a more accurate assessment of pathology-related atrophy-hypometabolism consistency. Finally, while our interpretation of the results relies on the presumed pathology of the patients based on clinicopathological studies, we lacked neuropathological confirmation of the pathological diagnosis. Nevertheless, all Alzheimer’s disease patients had a positive Florbetapir-PET scan, which increased their likelihood of Alzheimer’s disease etiology, and semantic dementia is a very homogenous clinical syndrome in term of underlying neuropathology (Hodges et al., 2010; Rohrer et al., 2011; Spinelli et al., 2017).
In summary, our results showed that multimodal neuroimaging-derived indexes, such as the individual correlations between atrophy and hypometabolism, differentiated Alzheimer’s disease from semantic dementia. These indexes might also be specifically related to the underlying pathological processes, and we proposed that the greater inter-modality discrepancy found in Alzheimer’s disease compared to semantic dementia reflects the separate and/or synergic effects of tau, amyloid-β and other neuropathologies on brain structure-function relationships. Hence, our study emphasizes the interest of multimodal
28 neuroimaging analyses to unravel between-modality relationships that are disease-specific and thought to reflect specific underlying pathological processes.
29
Acknowledgments
This work was supported by the French Ministry of Health (PHRCI 2008-A01150-55; PHRCN 2011 A01493-38; PHRCN 2012 12-006-0347), Agence Nationale de la Recherche (ANR, 07LVIE 006), Fondation Plan Alzheimer (Alzheimer Plan 2008–2012), Association France Alzheimer et maladies apparentées (AAP 2013), Fondation pour la Recherche Médicale (FRM), Conseil Régional de Normandie and Institut National de la Santé et de la Recherche Médicale (INSERM). The authors are grateful to Dr. J. Dayan, S. Egret, Dr R. De Flores, Dr M. Fouquet, Dr J. Gonneaud, Dr M. Leblond, Dr K. Mevel, F Mezenge, Dr J. Mutlu, Dr A Perrotin, Dr A. Quillard, Dr C. Schupp, C. Tomadesso, Dr N. Villain and the Cyceron MRI-PET staff members for their help with the neuropsychological and imaging examination of the patients. We thank A. Pélerin (Caen University Hospital) and C. Merck (Rennes University Hospital) for their help with recruiting the patients, and Dr. E. Arenaza-Urquijo for her scientific inputs.
Author Contributions
A.B. study design, analysis, and interpretation of data, drafting the manuscript. R.L.J. analysis and interpretation of the data, revising the manuscript for content. B.L. analysis of the data. S.B. study concept. V.d.L.S. study concept. F.E. study concept. B.D. study concept and design. G.C. study design, interpretation of data, revising the manuscript for content.
30
Competing Interests
Alexandre Bejanin – Declare no competing interests Renaud La Joie – Declare no competing interests Brigitte Landeau – Declare no competing interests Serge Belliard – Declare no competing interests
Vincent de La Sayette – Declare no competing interests Francis Eustache – Declare no competing interests Béatrice Desgranges – Declare no competing interests Gaël Chételat – Declare no competing interests
31
References
Acosta-Cabronero J, Patterson K, Fryer TD, Hodges JR, Pengas G, Williams GB, et al. Atrophy, hypometabolism and white matter abnormalities in semantic dementia tell a coherent story. Brain 2011; 134: 2025–2035.
Alsop DC, Casement M, de Bazelaire C, Fong T, Press DZ. Hippocampal hyperperfusion in Alzheimer’s disease. Neuroimage 2008; 42: 1267–1274.
Arenaza-Urquijo EM, Landeau B, La Joie R, Mevel K, Mézenge F, Perrotin A, et al. Relationships between years of education and gray matter volume, metabolism and functional connectivity in healthy elders. Neuroimage 2013; 83: 450–457.
Arvanitakis Z, Capuano AW, Leurgans SE, Bennett DA, Schneider JA. Relation of cerebral vessel disease to Alzheimer’s disease dementia and cognitive function in elderly people: a cross-sectional study. Lancet Neurol 2016; 15: 934–943.
Ashburner J. A fast diffeomorphic image registration algorithm. Neuroimage 2007; 38: 95– 113.
Bejanin A, Desgranges B, La Joie R, Landeau B, Perrotin A, Mézenge F, et al. Distinct white matter injury associated with medial temporal lobe atrophy in Alzheimer’s versus semantic dementia. Hum Brain Mapp 2017; 38: 1791–1800.
Braak H, Braak E. Neuropathological stageing of Alzheimer-related changes. Acta Neuropathol 1991; 82: 239–259.
Buckner RL, Sepulcre J, Talukdar T, Krienen FM, Liu H, Hedden T, et al. Cortical hubs revealed by intrinsic functional connectivity: mapping, assessment of stability, and relation to Alzheimer’s disease. J. Neurosci. 2009; 29: 1860–1873.
Buhour M-S, Doidy F, Laisney M, Pitel AL, de La Sayette V, Viader F, et al. Pathophysiology of the behavioral variant of frontotemporal lobar degeneration: A study combining MRI and FDG-PET. Brain Imaging Behav 2016
Caroli A, Lorenzi M, Geroldi C, Nobili F, Paghera B, Bonetti M, et al. Metabolic compensation and depression in Alzheimer’s disease. Dement Geriatr Cogn Disord 2010; 29: 37–45.
Chan D, Fox NC, Scahill RI, Crum WR, Whitwell JL, Leschziner G, et al. Patterns of temporal lobe atrophy in semantic dementia and Alzheimer’s disease. Ann. Neurol 2001; 49: 433–442.
Chételat G, Desgranges B, Landeau B, Mézenge F, Poline JB, de la Sayette V, et al. Direct voxel-based comparison between grey matter hypometabolism and atrophy in Alzheimer’s disease. Brain 2008; 131: 60–71.
Choo IH, Lee DY, Oh JS, Lee JS, Lee DS, Song IC, et al. Posterior cingulate cortex atrophy and regional cingulum disruption in mild cognitive impairment and Alzheimer’s disease. Neurobiol. Aging 2010; 31: 772–779.
32 Davies RR, Halliday GM, Xuereb JH, Kril JJ, Hodges JR. The neural basis of semantic memory: evidence from semantic dementia. Neurobiol. Aging 2009; 30: 2043–2052.
Davies RR, Hodges JR, Kril JJ, Patterson K, Halliday GM, Xuereb JH. The pathological basis of semantic dementia. Brain 2005; 128: 1984–1995.
Desgranges B, Matuszewski V, Piolino P, Chételat G, Mézenge F, Landeau B, et al. Anatomical and functional alterations in semantic dementia: a voxel-based MRI and PET study. Neurobiol Aging 2007; 28: 1904–1913.
Drzezga A, Grimmer T, Henriksen G, Stangier I, Perneczky R, Diehl-Schmid J, et al. Imaging of amyloid plaques and cerebral glucose metabolism in semantic dementia and Alzheimer’s disease. Neuroimage 2008; 39: 619–633.
Duval C, Bejanin A, Piolino P, Laisney M, de La Sayette V, Belliard S, et al. Theory of mind impairments in patients with semantic dementia. Brain 2012; 135: 228–241.
Duval C, Desgranges B, de La Sayette V, Belliard S, Eustache F, Piolino P. What happens to personal identity when semantic knowledge degrades? A study of the self and autobiographical memory in semantic dementia. Neuropsychologia 2012; 50: 254–265.
Ernst A, Frisén J. Adult neurogenesis in humans- common and unique traits in mammals. PLoS Biol. 2015; 13: e1002045.
Galton CJ, Patterson K, Graham K, Lambon-Ralph MA, Williams G, Antoun N, et al. Differing patterns of temporal atrophy in Alzheimer’s disease and semantic dementia. Neurology 2001; 57: 216–225.
Gorno-Tempini ML, Hillis AE, Weintraub S, Kertesz A, Mendez M, Cappa SF, et al. Classification of primary progressive aphasia and its variants. Neurology 2011; 76: 1006– 1014.
Grothe MJ, Teipel SJ, Alzheimer’s Disease Neuroimaging Initiative. Spatial patterns of atrophy, hypometabolism, and amyloid deposition in Alzheimer’s disease correspond to dissociable functional brain networks. Hum Brain Mapp 2016; 37: 35–53.
Hodges JR, Mitchell J, Dawson K, Spillantini MG, Xuereb JH, McMonagle P, et al. Semantic dementia: demography, familial factors and survival in a consecutive series of 100 cases. Brain 2010; 133: 300–306.
Ittner LM, Götz J. Amyloid-β and tau--a toxic pas de deux in Alzheimer’s disease. Nat. Rev. Neurosci. 2011; 12: 65–72.
James BD, Wilson RS, Boyle PA, Trojanowski JQ, Bennett DA, Schneider JA. TDP-43 stage, mixed pathologies, and clinical Alzheimer’s-type dementia. Brain 2016
Kapasi A, DeCarli C, Schneider JA. Impact of multiple pathologies on the threshold for clinically overt dementia. Acta Neuropathol 2017; 134: 171–186.
Kljajevic V, Grothe MJ, Ewers M, Teipel S. Distinct pattern of hypometabolism and atrophy in preclinical and predementia Alzheimer’s disease. Neurobiology of Aging 2014; 35: 1973– 1981.
33 La Joie R, Landeau B, Perrotin A, Bejanin A, Egret S, Pélerin A, et al. Intrinsic connectivity identifies the hippocampus as a main crossroad between Alzheimer’s and semantic dementia-targeted networks. Neuron 2014; 81: 1417–1428.
La Joie R, Perrotin A, Barré L, Hommet C, Mézenge F, Ibazizene M, et al. Region-specific hierarchy between atrophy, hypometabolism, and β-amyloid (Aβ) load in Alzheimer’s disease dementia. J. Neurosci. 2012; 32: 16265–16273.
La Joie R, Perrotin A, De La Sayette V, Egret S, Doeuvre L, Belliard S, et al. Hippocampal subfield volumetry in mild cognitive impairment, Alzheimer’s disease and semantic dementia. Neuroimage Clin 2013; 3: 155–162.
McKhann G, Drachman D, Folstein M, Katzman R, Price D, Stadlan EM. Clinical diagnosis of Alzheimer’s disease: report of the NINCDS-ADRDA Work Group under the auspices of Department of Health and Human Services Task Force on Alzheimer’s Disease. Neurology 1984; 34: 939–944.
McKhann GM, Knopman DS, Chertkow H, Hyman BT, Jack CR Jr, Kawas CH, et al. The diagnosis of dementia due to Alzheimer’s disease: recommendations from the National Institute on Aging-Alzheimer’s Association workgroups on diagnostic guidelines for Alzheimer’s disease. Alzheimers Dement 2011; 7: 263–269.
Mesulam M-M, Weintraub S, Rogalski EJ, Wieneke C, Geula C, Bigio EH. Asymmetry and heterogeneity of Alzheimer’s and frontotemporal pathology in primary progressive aphasia. Brain 2014; 137: 1176–1192.
Moodley KK, Minati L, Barnes A, Dickson JC, Ell PJ, Chan D. Simultaneous PET/MRI in frontotemporal dementia. Eur. J. Nucl. Med. Mol. Imaging 2013; 40: 468–469.
Nag S, Yu L, Capuano AW, Wilson RS, Leurgans SE, Bennett DA, et al. Hippocampal sclerosis and TDP-43 pathology in aging and Alzheimer disease. Ann. Neurol. 2015; 77: 942– 952.
Nestor PJ, Fryer TD, Hodges JR. Declarative memory impairments in Alzheimer’s disease and semantic dementia. Neuroimage 2006; 30: 1010–1020.
Paolicelli RC, Jawaid A, Henstridge CM, Valeri A, Merlini M, Robinson JL, et al. TDP-43 Depletion in Microglia Promotes Amyloid Clearance but Also Induces Synapse Loss. Neuron 2017; 95: 297–308.e6.
Rohrer JD, Lashley T, Schott JM, Warren JE, Mead S, Isaacs AM, et al. Clinical and neuroanatomical signatures of tissue pathology in frontotemporal lobar degeneration. Brain 2011; 134: 2565–2581.
Schneider JA, Arvanitakis Z, Leurgans SE, Bennett DA. The neuropathology of probable Alzheimer disease and mild cognitive impairment. Ann. Neurol. 2009; 66: 200–208.
Schroeter ML, Neumann J. Combined Imaging Markers Dissociate Alzheimer’s Disease and Frontotemporal Lobar Degeneration - An ALE Meta-Analysis. Front Aging Neurosci 2011; 3: 10.
34 Seeley WW, Crawford RK, Zhou J, Miller BL, Greicius MD. Neurodegenerative diseases target large-scale human brain networks. Neuron 2009; 62: 42–52.
Shattuck DW, Mirza M, Adisetiyo V, Hojatkashani C, Salamon G, Narr KL, et al. Construction of a 3D Probabilistic Atlas of Human Cortical Structures. Neuroimage 2008; 39: 1064–1080.
Spinelli EG, Mandelli ML, Miller ZA, Santos-Santos MA, Wilson SM, Agosta F, et al. Typical and atypical pathology in primary progressive aphasia variants. Ann. Neurol. 2017; 81: 430–443.
Spires-Jones TL, Hyman BT. The intersection of amyloid beta and tau at synapses in Alzheimer’s disease. Neuron 2014; 82: 756–771.
Tan RH, Kril JJ, Yang Y, Tom N, Hodges JR, Villemagne VL, et al. Assessment of amyloid β in pathologically confirmed frontotemporal dementia syndromes. Alzheimer’s & Dementia: Diagnosis, Assessment & Disease Monitoring 2017; 9: 10–20.
Teipel S, Drzezga A, Grothe MJ, Barthel H, Chételat G, Schuff N, et al. Multimodal imaging in Alzheimer’s disease: validity and usefulness for early detection. Lancet Neurol 2015
Teipel S, Grothe MJ, Alzheimer´s Disease Neuroimaging Initiative. Does posterior cingulate hypometabolism result from disconnection or local pathology across preclinical and clinical stages of Alzheimer’s disease? Eur. J. Nucl. Med. Mol. Imaging 2015
Thal DR, Rüb U, Orantes M, Braak H. Phases of A beta-deposition in the human brain and its relevance for the development of AD. Neurology 2002; 58: 1791–1800.
Villain N, Desgranges B, Viader F, de la Sayette V, Mézenge F, Landeau B, et al. Relationships between hippocampal atrophy, white matter disruption, and gray matter hypometabolism in Alzheimer’s disease. J. Neurosci. 2008; 28: 6174–6181.
Villain N, Fouquet M, Baron J-C, Mézenge F, Landeau B, de La Sayette V, et al. Sequential relationships between grey matter and white matter atrophy and brain metabolic abnormalities in early Alzheimer’s disease. Brain 2010; 133: 3301–3314.
Viviani R. A Digital Atlas of Middle to Large Brain Vessels and Their Relation to Cortical and Subcortical Structures. Front Neuroanat 2016; 10.
Viviani R, Pracht ED, Brenner D, Beschoner P, Stingl JC, Stöcker T. Multimodal MEMPRAGE, FLAIR, and R2* Segmentation to Resolve Dura and Vessels from Cortical Gray Matter. Front Neurosci 2017; 11.
35
Supplementary Material
Acquisition procedures
MRI data. Each subject underwent a high-resolution T1-weighted anatomical image (Philips
Achieva 3.0 T scanner), using a 3D fast field echo sequence (3D-T1-FFE sagittal, SENSE factor = 2, time of repetition (TR) = 20 ms, time of echo (TE) = 4.6 ms, flip angle = 10°, 180 slices, no gap, slice thickness = 1 mm, field of view (FOV) = 256 × 256 mm2, in-plane resolution = 1 × 1 mm2).
PET data. 18FDG-PET scans were acquired on a Discovery RX VCT 64 PET-CT device (GE Healthcare) with a resolution of 3.76 × 3.76 × 4.9 mm (axial FOV 157 mm). Forty-seven planes were obtained with a voxel size of 2.7 × 2.7 × 3.27 mm. Subjects had fasted for at least six hours before scanning. The head was positioned on a headrest relative to the canthomeatal line and gently restrained with straps. 18FDG-PET uptake was measured in the resting condition, with eyes closed, in a quiet and dark environment. Subjects were told to avoid focusing on any specific mental process during scanning. After a 30 min resting period, ~ 180 MBq of 18FDG was intravenously injected as a bolus. A 10 min PET acquisition scan began 50 min after injection.
Supplementary Figures
Figure S1 shows the pattern of gray matter atrophy and hypometabolism in Alzheimer’s disease and semantic dementia.
Figure S2 shows the individual Fisher r-to-z-transformed values of the voxel-to-voxel correlations between atrophy and hypometabolism in each brain region of the Loni Atlas. Figure S3-5 display the results using PET data not corrected for partial volume effects. Note that the cluster threshold has been lowered to 1350 mm3 (k=400 voxels) to better emphasize the similarities with the results obtained using PET data corrected for partial volume effects.
36
Figure S1: Voxelwise one-sample t-test results in Alzheimer’s disease (left panel) and
semantic dementia (right panel) showing the pattern of gray matter atrophy (top panel) and hypometabolism (bottom panel). Results are presented using thresholds of FWE-corrected p<0.05 and cluster extent k > 1500 mm3.
37
Figure S2: Boxplots showing, in Alzheimer’s disease (yellow) and semantic dementia (pink),
the Fisher r-to-z-transformed values of the voxel-to-voxel correlations between atrophy and hypometabolism in each region of the Loni Atlas. Each dot represents the Fisher r-to-z-transformed value of one patient, which reflects the individual degree of topographical consistency between the patterns of atrophy and hypometabolism. The box represents the interquartile range, the band represents the median value, and the dotted line represents a Fisher r-to-z-transformed values equal to 0.
39
Figure S3: Within- and between-group results of voxelwise comparisons between the local
degrees of atrophy and hypometabolism using PET data corrected or not corrected for partial volume effects. Results are shown at p (FWE-corrected) <0.05 together with a cluster extent superior to 1350 mm3. Note PVEc: Partial volume effects correction.
Columns 1-2: voxelwise comparisons between the local degrees of atrophy and hypometabolism in patients with Alzheimer’s disease (first column) and semantic dementia (second column).
Column 3: voxelwise statistical conjunctions showing regions with significantly more atrophy than hypometabolism (top panel) or with more hypometabolism than atrophy (bottom panel) in both patients with Alzheimer’s disease and patients with semantic dementia
Column 4: voxelwise comparisons showing brain regions where atrophy is higher than hypometabolism (top panel) or where hypometabolism is higher than atrophy (bottom panel) in patients with Alzheimer’s disease as compared to patients with semantic dementia.
Column 5: voxelwise comparisons showing brain regions where atrophy is higher than hypometabolism (top panel) or where hypometabolism is higher than atrophy (bottom panel) in patients with semantic dementia as compared to patients with Alzheimer’s disease.
41
Figure S4: Scatterplots showing the voxel-to-voxel correlations between the average value of
hypometabolism (x-axis) and the average value of atrophy (y-axis) in Alzheimer’s disease and semantic dementia using PET data not corrected for partial volume effects.
The red line corresponds to the identity line (y=x), representing an equal degree of atrophy and hypometabolism. Colors on scatterplots represent the brain location of each voxel (i.e., orange: occipital cortex; fuschia: parietal cortex; yellow: frontal cortex; blue: temporal cortex; red: hippocampal region).
43
Figure S5: Results of the global and regional voxel-to-voxel correlations between atrophy
and hypometabolism (using PET data not corrected for partial volume effects).
(A) Boxplot showing, in Alzheimer’s disease and semantic dementia, the individual Fisher r-to-z transformed values of the voxel-to-voxel correlations between atrophy and hypometabolism. The box represents the interquartile range, the band represents the median value, and the dots represent patient Fisher r-to-z transformed values, which reflects the individual degree of topographical consistency between the atrophy and hypometabolism. (B) Between-group differences in the regional voxel-to-voxel correlations between atrophy and hypometabolism. Note that only regions displayed in red survived Bonferroni correction for multiple comparisons (α=0.05, p<0.0009, 56 models considered).
(C and D) Averages and coefficient of variations (CV, standard deviation/mean) of the individual Fisher r-to-z transformed values of the voxel-to-voxel correlations between atrophy and hypometabolism in Alzheimer’s disease (C) and semantic dementia (D).