HAL Id: inserm-00840252
https://www.hal.inserm.fr/inserm-00840252
Submitted on 2 Jul 2013
HAL is a multi-disciplinary open access
archive for the deposit and dissemination of
sci-entific research documents, whether they are
pub-lished or not. The documents may come from
teaching and research institutions in France or
abroad, or from public or private research centers.
L’archive ouverte pluridisciplinaire HAL, est
destinée au dépôt et à la diffusion de documents
scientifiques de niveau recherche, publiés ou non,
émanant des établissements d’enseignement et de
recherche français ou étrangers, des laboratoires
publics ou privés.
A Molecular Predictor Reassesses Classification of
Human Grade II/III Gliomas.
Thierry Rème, Jean-Philippe Hugnot, Ivan Bièche, Valérie Rigau, Fanny
Burel-Vandenbos, Vincent Prévot, Marc Baroncini, Denys Fontaine, Hugues
Chevassus, Sophie Vacher, et al.
To cite this version:
Thierry Rème, Jean-Philippe Hugnot, Ivan Bièche, Valérie Rigau, Fanny Burel-Vandenbos, et al.. A
Molecular Predictor Reassesses Classification of Human Grade II/III Gliomas.. PLoS ONE, Public
Library of Science, 2013, 8 (6), pp.e66574. �10.1371/journal.pone.0066574�. �inserm-00840252�
Grade II/III Gliomas
Thierry Re`me1*, Jean-Philippe Hugnot2., Ivan Bie`che3, Vale´rie Rigau4, Fanny Burel-Vandenbos5, Vincent Pre´vot6, Marc Baroncini6,7, Denys Fontaine8, Hugues Chevassus9, Sophie Vacher3, Rosette Lidereau3, Hugues Duffau10, Luc Bauchet10., Dominique Joubert11.
1 INSERM-UM1 U1040; CHRU Montpellier, Institute of Research in Biotherapy, Montpellier, France, 2 INSERM-UM1 U1051; CHRU Montpellier, Institute of Neuroscience of Montpellier; University of Montpellier 2, Montpellier, France,3 Oncogenetics, Institut Curie; Hoˆpital Rene´ Huguenin, Saint-Cloud, France, 4 Department of Pathology and Biobank, CHRU Montpellier, Montpellier, France, 5 Department of Pathology, CHRU Nice, Nice, France, 6 INSERM U837, JPARC, University of Lille, Lille, France, 7 Department of Neurosurgery, CHRU Lille, Lille, France, 8 Department of Neurosurgery, CHRU Nice, Nice, France, 9 INSERM CIC 1001 and CIC; CHRU Montpellier, Montpellier, France,10 INSERM-UM1 U1051; Institute of Neuroscience of Montpellier; Department of Neurosurgery, CHRU Montpellier, Montpellier, France, 11 CNRS UMR5203, INSERM U661, Institute of Functional Genomics, Montpellier, France
Abstract
Diffuse gliomas are incurable brain tumors divided in 3 WHO grades (II; III; IV) based on histological criteria. Grade II/III gliomas are clinically very heterogeneous and their prognosis somewhat unpredictable, preventing definition of appropriate treatment. On a cohort of 65 grade II/III glioma patients, a QPCR-based approach allowed selection of a biologically relevant gene list from which a gene signature significantly correlated to overall survival was extracted. This signature clustered the training cohort into two classes of low and high risk of progression and death, and similarly clustered two external independent test cohorts of 104 and 73 grade II/III patients. A 22-gene class predictor of the training clusters optimally distinguished poor from good prognosis patients (median survival of 13–20 months versus over 6 years) in the validation cohorts. This classification was stronger at predicting outcome than the WHO grade II/III classification (P#2.8E-10 versus 0.018). When compared to other prognosis factors (histological subtype and genetic abnormalities) in a multivariate analysis, the 22-gene predictor remained significantly associated with overall survival. Early prediction of high risk patients (3% of WHO grade II), and low risk patients (29% of WHO grade III) in clinical routine will allow the development of more appropriate follow-up and treatments.
Citation: Re`me T, Hugnot J-P, Bie`che I, Rigau V, Burel-Vandenbos F, et al. (2013) A Molecular Predictor Reassesses Classification of Human Grade II/III Gliomas. PLoS ONE 8(6): e66574. doi:10.1371/journal.pone.0066574
Editor: James Bradley Elder, The Ohio State University Medical Center, United States of America Received February 15, 2013; Accepted May 8, 2013; Published June 21, 2013
Copyright: ß 2013 Re`me et al. This is an open-access article distributed under the terms of the Creative Commons Attribution License, which permits unrestricted use, distribution, and reproduction in any medium, provided the original author and source are credited.
Funding: This work was supported by: INCA (www.e-cancer.fr) #PL06-073; CHU Montpellier (www.chu-montpellier.fr) #UF7745; and ARTC Sud (www.artc.asso. fr) ‘‘2008 Tumor Inventory.’’ The funders had no role in study design, data collection and analysis, decision to publish, or preparation of the manuscript. Competing Interests: The authors have declared that no competing interests exist.
* E-mail: thierry.reme@inserm.fr
.These authors contributed equally to this work.
Introduction
Gliomas are the most frequent primary tumors of the CNS (central nervous system) [1,2]. Half of gliomas are represented by glioblastoma multiforme (GBM, WHO grade IV), which are associated with a poor prognosis (median survival less than one year [3,4]). In contrast low grade diffuse gliomas (grade II) which represent approximately 15% of gliomas are slow-growing tumors (3–4 mm of mean diameter per year) [5]. However WHO grade II tumors will ineluctably evolve to anaplasia within 5–10 years (grade III and/or IV) which then rapidly compromise patient survival. The median overall survival (OS) for grade II glioma patients is approximately of 6–12 years [6] whereas this is reduced to 3 years (30–40 months) for grade III patients [7]. However important discrepancies exist between studies and no significant differences for the survival of grade II and III gliomas was recently reported in one study [8]. Heterogeneity of the tumor tissue and the lack of consistency in grading among neuropathologists [9] likely contribute to the difficulty to establish a reliable diagnosis. One important feature of grade II and III gliomas is their clinical
heterogeneity and unpredictable behavior at the individual level. Some tumors will expand quickly within months whereas others will expand at a low rate for years [10]. Identification of markers predicting the evolution of grade II and III gliomas is required for appropriate follow-up and treatment. Accordingly, oligodendro-gliomas which show frequent 1p19q co-deletions and mutations of the IDH1 gene are associated with a longer survival than astrocytomas [6]. In addition, various parameters derived from tumor imaging have been used to stratify grade II/III patients [11]. Finally, molecular markers [12–14] are another important source for the detection of patients with a high risk of rapid deterioration.
Over the past ten years, transcriptome profiling has largely been used in cancer to explore patient heterogeneity, define tumor subclasses and predict prognosis. Gene expression profiling of gliomas has been recognized to produce a more robust classifica-tion than the convenclassifica-tional histological diagnosis [15–18] and also to directly predict for survival [19–23]. Most of these studies have focused on high grade glioma, whereas to our knowledge no study has specifically addressed the prognosis stratification of grade II/
III patients. While developing complex technics will reveal more markers, like the ATRX gene detected by high-throughput sequencing in intermediate grade gliomas [24], widely-spread and inexpensive methods still allow a rapid and accurate prognostic evaluation. We thus set out to define a gene expression and outcome signature best describing a cohort of 65 grade II/III glioma patients. A QPCR-based approach was used to identify an outcome-significant signature able to distinguish, much better than the WHO classification, two classes of patients with low and high risk of rapid progression and death among grade II/II gliomas. The relevance of this signature was propagated to two indepen-dent grade II/III cohorts in building a 22-gene class predictor which remained robust when confronted to other prognosis factors. This predictor will allow an improved classification for any new grade II/III glioma patient.
Results
Selection of a Gene Signature for Overall Survival of Grade II/III Patients
The present study was initiated with a limited set of 365 genes susceptible to be implicated in tumorigenesis and prognosis relevance in various cancers (supplementary Table S1). This list includes genes expressed by stem cells, or coding for proteins involved in angiogenesis, adhesion, asymmetric division, chroma-tin remodeling, DNA methylation, epithelial-mesenchymal tran-sition, migration, proliferation and canonical pathways. Gene expression was measured using QPCR on a limited number of samples, allowing the selection of 38 representative genes (supplementary Table S2) reduced to 27 OS-significant genes on our cohort. Using these genes, the expression clustering map revealed two groups comprising 1/3 and 2/3 of patients respectively (Figure 1). The median survival of patients of the smallest group was 17.3 months, which included 75% of the deceased patients in the cohort. The larger group contained only 9% of deceased patients in the cohort (Table 1). The log-rank test comparing the overall survival of the two groups was highly significant (P#2.8E-10, Figure 2A). Using this signature, 3% of patients who were histologically classified as grade II fell into the poor prognosis category and inversely, 29% of grade III diagnosed patients were redefined as good prognosis patients in the MPL training cohort (Table 2). Patient stratification according to the WHO classification (43% grade II, 57% grade III) led to an inverse distribution compared to ours (69% good, 31% poor prognosis) and although this histological classification was significant in a log-rank test (P = 0.018), it was less efficient at distinguishing the short-surviving population revealed by our signature (Figure 2A). In a univariate proportional hazard Cox model analysis, the hazard ratio was six times higher for our classification compared to the WHO one (26.2 and 4.1 respec-tively, Table 3). When compared in a multivariate analysis, the WHO classification was no longer independent of our signature classification.
Building a Prediction Analysis for Microarrays (PAM) Predictor
A PAM predictor was readily built on the clusters delineated by the 27-gene signature in the training cohort and 10X cross-validation allowed selecting 22 genes of good (BMP2, DLL3, NRG3) and poor prognostic values (AURKA, BIRC5, BUB1, BUB1B, CHI3L1, COL1A1, DLG7, EZH2, FOXM1, HSPG2, IGFBP2, JAG1, KI67, NEK2, NKX6.1, PLK1, POSTN, TNC, VIM, Table 4, supplementary Figure S1D). This list contributed to differentiate samples in the training cohort (supplementary Figure
S1A, B) with a misclassification error rate lower than 5% (supplementary Figure S1C).
To validate our predictor, the NL and NIH datasets were used after normalizing and scaling to fit with QPCR expression level. Grade II gliomas represented a quarter of the NL cohort and half of the NIH cohort according to the WHO classification. This grouping almost superimposed the survival curves of patients with grade II/III for the NL cohort (Figure 2B) and separated the NIH patients comparably to the MPL cohort (P#.016).
Applying the predictor built on the training cohort to the independent NL and NIH cohorts separated two groups of patients in a proportion very similar to that obtained in clustering the training cohort (two thirds of good versus one third of poor prognosis). Seventeen out of the 22 predictive genes were individually significant for survival in the NL validation cohort. This model led to a staging with highly significant differential survival (P#5.4E-14, Table 1) as illustrated by Kaplan-Meier curves (Figure 2B). The poor prognosis group appeared very similar to the one delineated in the training cohort both for survival at 24 months (21%) and median survival (13.2 versus 17.3 months). The PAM prediction was able to separate very-short surviving patients from patients surviving more than 6 years (Table 1) despite a high number of deaths in the good prognosis group (80%) due to a long follow-up. Our predictor again separated the NIH validation cohort in similar 2/3 good versus 1/ 3 poor prognosis groups with a very significant differential survival (P#7.7E-05, Table 1) as illustrated by Kaplan-Meier curves (Figure 2C) and again a median survival of less than 2 years. The outcome relevance of the current WHO classification was not significant when assessed using a univariate Cox model for survival on the NL validation cohort, while the PAM classification was highly significant with a hazard ratio of almost 6 and 4 respectively for NL and NIH (Table 3). Finally, a large proportion (46%) of WHO grade III patients was found of better prognosis in the NL cohort (Table 2).
The ability of the prognosis signature to predict outcome of histopathological subtypes was estimated by the survival analysis of either pure astrocytomas (supplementary Figure S2B, F, J), mixed oligoastrocytomas (D, G, K) or pure oligodendrogliomas (C, H, L) separately grouped by the WHO grade II/III classification compared to the PAM one. Kaplan-Meier curves and log-rank tests clearly demonstrated that, except for the too low number of pure astrocytomas in the training cohort, the PAM classification significantly separated good from poor prognosis patients whatever the histology and the cohort, while the WHO classification was unable to distinguish a differential survival.
Fitting a regression model on the survival of training and validation cohorts and their combination for both classifications allowed to approximate the life expectancy of patients in high to low risk groups: 3.5 and less than 8 years for the WHO classification and 1.5 and more than 7 years for the PAM classification (Figure 2D, E).
PAM Prediction and Conventional Prognosis Factors for Grade II and III Gliomas
The dependency of our predictor classification to commonly used grade II/III glioma prognostic factors (1p19q loss of heterozygosity, IDH1 gene mutation and EGFR gene amplifica-tion) was analyzed using the NL validation cohort for which these molecular data were available. As expected, the absence of 1p19q codeletion or the amplification of EGFR presented a significant higher risk of poor survival in univariate analysis. In this cohort, the absence of IDH1 mutation was surprisingly not associated with a poor outcome. In multivariate analysis of each factor and the
PAM prediction, only EGFR amplification remained an indepen-dent prognostic factor (Table 3). Finally, when testing all prognostic factors together, only PAM classification remained significant.
Discussion
In this study, we used a QPCR-based gene expression approach to identify a 27 gene signature able to stratify grade II/III glioma patients into two classes with very different outcome. Patients of the higher risk class which represent approximately one third of grade II/III patients, have a median survival time of about 1.5 years in three independent patients’ cohorts whereas patients of the lower risk class present a median survival over 7 years. This mean life expectancy enforces the need for a clear identification method. The present risk classification based on gene expression profile predicts the overall patient survival much better than the WHO histological classification (P#2.8E-10 versus 0.018 respec-tively). Using the latter, grade III gliomas represented more than half of the patients in our training cohort, while our classification
showed that only one third was at risk of shorter survival. Thus the grade II/III WHO classification appears to overestimate the number of bad prognosis gliomas. This conclusion is substantiated in the larger validation cohorts, in which half to three-quarter of patients are classified by WHO as grade III while predicted classification only delineates one third of high risk patients. With the longer follow-up in the test populations, all uncensored patients have died by twenty years, but contrary to the WHO classification, PAM prediction was able to delineate a poor and a better prognosis group of gliomas (Figure 2). Besides predicting a better prognosis for many grade III gliomas, the signature was able to identify a few patients with grade II gliomas showing a rapid evolution. Additionally, individual outcome of astrocytomas or oligodendrogliomas was readily and equally well predicted by our method (supplementary Figure S2).
To easily propagate our classification to other cohorts or new patients, we built a class predictor for the 27-gene signature clusters. The 22-gene predictor obtained comprised 3 good and 19 poor prognosis genes. The functions of the proteins encoded by
Figure 1. Gene expression heatmap and overall survival of WHO grade II/III glioma patients. Map of the gene expression levels from the 27-gene list used to generate a classification clearly identifying a high risk cluster containing most of the deceased patients of the training cohort. doi:10.1371/journal.pone.0066574.g001
Table 1. Differential overall survival analysis of grade II and III gliomas in training and validation cohorts according to classifications. Cohort Prognosis group Number of patients % patients % deaths Log-rank p-value1 % Survival at 24 mo Median survival (mo) Training WHO grade II 28 43 11 0.018 95 NR2
MPL cohort WHO grade III 37 57 43 57 NR Cluster low risk 45 69 9 2.80E-10 94 NR Cluster high risk 20 31 75 21 17.3 Validation WHO grade II 24 23 67 NS3
(0.48) 65 45.2 NL cohort WHO grade III 80 77 90 60 37.9 PAM low risk 69 66 80 5.40E-14 81 72.5 PAM high risk 35 34 94 21 13.2 Validation WHO grade II 35 48 40 0.016 83 NR NIH cohort WHO grade III 38 52 66 58 34.9
PAM low risk 48 66 40 7.70E-05 85 NR PAM high risk 25 34 80 40 21.2
1
For one degree of freedom.
2
Not reached.
3
Not significant at a 5% risk. doi:10.1371/journal.pone.0066574.t001
Figure 2. Incidence on overall survival and comparison of WHO grade II/III versus gene expression-based PAM predictor classification methods. The WHO classification (dotted lines) and the gene expression-based clusters or predicted classes (solid lines) were compared in a Kaplan-Meier analysis of training (A) and validation (B, C) cohorts. For life expectancy comparison, the Kaplan-Meier curves for overall survival were superimposed for training, validation and mixed cohorts (D, E). A parametric regression model of the overall survival of mixed cohorts was superimposed assuming a Weibull-distributed fit.
doi:10.1371/journal.pone.0066574.g002
these genes have been documented in several types of cancer, including gliomas, and fit adequately with their contribution to glioma prognosis. BMP2 is typically expressed by glioma with a 1p19q codeletion [25]. In glioma, BMPs have been shown to reduce cell growth and to induce apoptosis [26], which may account for the long survival of patients highly expressing these proteins. The Notch pathway [27] is associated with tumor progression in glioma [28,29]. The high expression of DLL3, an
inhibitor of this pathway, may restrict its activation in good prognosis patients. NRG3 (neuregulin-3), is a member of a large subclass of ligands of the EGF family. Compared to control brain, NRG3 is underexpressed in high grade gliomas [30] and its sustained expression in good prognosis gliomas may reflect preservation of normal features by the tumor tissue. Among the poor prognosis genes, CHI3L1, IGFBP2 and POSTN were the most informative markers (Table 4). These genes are also highly expressed in GBM in which their expression is associated with tumor progression and poor patient survival [31–33]. IGFBP2 is a central modulator of the IGF pathway and is implicated in the control of many cellular processes, notably proliferation, metab-olism and migration. CHI3L1 is a secreted glycoprotein belonging to the family of mammalian chitinase-like proteins, which has a proliferative effect on many cell types and can confer radioresis-tance and increased invasion in normal astrocytes [34]. CHI3L1 expression is associated with the mesenchymal subtype of gliomas which has a poorer survival [34,35]. POSTN (periostin) is a secreted cell adhesion protein which plays an important role in tumor development and is upregulated in several types of cancers [36]. In glioma, its expression correlates with high FLAIR volumes and the mesenchymal subtypes of GBM. Further accuracy in the overall survival is provided by the overexpression of genes associated with proliferation (AURKA [37], BUB1 [38], BUB1B [38], DLG7/DLGAP5 [39], FOXM1 [40], KI67 [13], NEK2 [41], PLK1 [42]), apoptosis (BIRC5/SURVIVIN [12]) and vasculature (COL1A1 [43], HSPG2 [44], JAG1 [45], NKX6.1 [46], TNC [47]). Their overexpression in poor-prognosis patients is consistent with the fact that enhanced proliferation, apoptosis inhibition and Table 2. Cross-tabulation of WHO grades and predicted
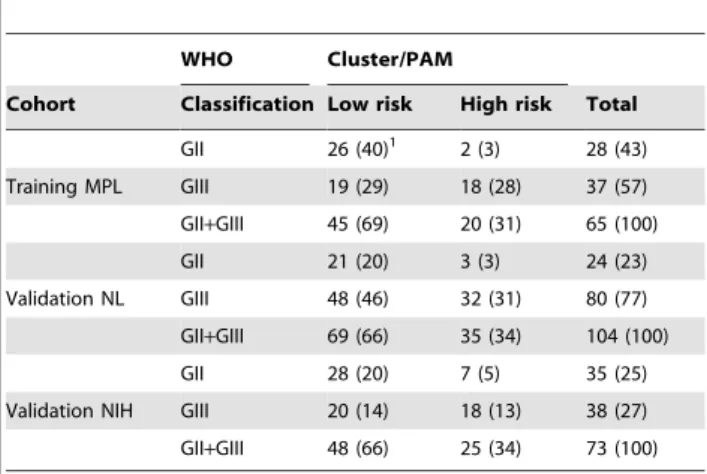
prognosis groups of grade II and III gliomas.
WHO Cluster/PAM
Cohort Classification Low risk High risk Total GII 26 (40)1 2 (3) 28 (43) Training MPL GIII 19 (29) 18 (28) 37 (57) GII+GIII 45 (69) 20 (31) 65 (100) GII 21 (20) 3 (3) 24 (23) Validation NL GIII 48 (46) 32 (31) 80 (77) GII+GIII 69 (66) 35 (34) 104 (100) GII 28 (20) 7 (5) 35 (25) Validation NIH GIII 20 (14) 18 (13) 38 (27) GII+GIII 48 (66) 25 (34) 73 (100)
1
Number (Percentage).
doi:10.1371/journal.pone.0066574.t002
Table 3. Uni- and multivariate Cox model analysis applied to prognosis groups for overall survival of grade II and III gliomas.
Cohort: Training MPL Validation NL Validation NIH
Score HR1
P-value HR P-value HR P-value Univariate Cox model
WHO 4.1 0.028 1.2 NS2
(0.48) 2.2 0.019 Clustering/PAM3
26.2 1.7E-05 5.6 4.7E-12 3.4 1.8E-04 1p19q no codeletion – – 1.9 0.015 – – IDH1 no mutation – – 1.1 NS (0.6) – – EGFR amplification – – 4.0 3.5E-04 – – Multivariate Cox model
Clustering/PAM 23.3 4.5E-05 5.8 1.0E-11 3.0 1.1 E-03 WHO 2.3 NS (0.21) 0.8 NS (0.55) 1.8 NS (0.1) PAM – – 10.0 3.7E-09 – – 1p19q no codeletion – – 1.5 NS (0.15) – – PAM – – 5.6 4.7E-09 – – IDH1 no mutation – – 0.8 NS (0.37) – – PAM – – 4.5 4.1E-06 – – EGFR amplification – – 2.8 0.014 – – PAM – – 13.4 8.5E-06 – – WHO – – 0.7 NS (0.4) – – 1p19q no codeletion – – 1.7 NS (0.17) – – IDH1 no mutation – – 1.1 NS (0.88) – – EGFR amplification – – 1.2 NS (0.82) – – 1 Hazard ratio. 2
Not significant at a 5% risk.
3
27-gene signature clustering on MPL and PAM predictor on NL and NIH cohorts. doi:10.1371/journal.pone.0066574.t003
angiogenesis are hallmarks of disease progression in many cancers [48]. In addition, poor-prognosis patient tumors may contain cells with profound epigenetic and phenotypic modifications as evidenced by the high level of EZH2 and VIM, two proteins involved respectively in histone modifications and epithelial-mesenchymal transition.
In this study, we found that grade II/III patients with a poor prognosis signature have an overall survival time similar to that of GBM-diagnosed patients. In addition, some of the poor-prognosis overexpressed genes such as IGFBP2 and CHI3L1 are hallmarks of GBM [49,50]. It is thus likely that due to its very high sensitivity, QPCR analysis can detect GBM well before typical histological features for this grade (notably necrosis and vascular cell proliferation) are noticeable by pathologists.
Several genetic alterations have been identified in grade II and III gliomas, which provide important information on patient prognosis. Chromosomal 1p19q codeletion, or the mutation of IDH1 gene represent good prognosis factors whereas the amplification of EGFR is associated with a poor overall survival. Using the NL validation cohort, a multivariate Cox model analysis showed that IDH1 and 1p19q status were not independent from our 22 gene predictor, in contrast to the EGFR amplification. But in a multivariate analysis combining the five prognostic factors, only the predictor remained significant for survival, thus highlighting its usefulness and robustness for routine patient classification.
Finally, in contrast to studies starting from large datasets, we deliberately chose here to identify a signature based on the expression of a few number of genes relevant to tumor genesis
which can be routinely measured by QPCR at a minimum cost in a hospital laboratory. Because of this limited number of genes, we diverted from development procedures for large scale clinically-relevant gene-based classifiers [51] in building a class predictor for the unsupervised gene-based clusters. However this signature can also be detected by microarray technology as we validated it using two external grade II/III cohorts with transcriptome data acquired through genome-wide methods. Application of the 22-genes predictor to the training cohort allowed to exactly retrieving the two originally selected clusters (data not shown). Therefore, any new patient could be assessed either by QPCR or microarray and the 22 normalized and scaled signals used to predict outcome. This allowed grouping the three normalized cohorts to demon-strate a much better selection of high risk patients by our predictor, with a predicted median survival of 1,5 years compared to 3,5 by the WHO classification (Figure 2C, D).
In conclusion, because WHO classification lacks reproducibility between pathologists and does not take into account the continuum between grade II and grade III gliomas, it appears important to move beyond the sole histology by integrating molecular biology data to increase the reliability and prognostic value of pathology investigations. Here, we report for the first time to our knowledge, in a cohort of grade II/III gliomas excluding GBM, a 22 gene predictor which allows an early identification of poor prognosis patients among grade II gliomas (few ‘‘false grade II’’) as well as an early detection of good prognosis patients among grade III gliomas (one third to half of ‘‘false grade III’’), with a significantly better predictive value than the WHO histological classification as evidenced by cross-tabulation (Table 2). Such a Table 4. Twenty-two genes in a class prediction analysis on the gene expression clusters of the training cohort.
Gene Class scores1
Probe set2
Banding Annotation2
CHI3L1 20.4426 0.9959 209396_s_at 1q32.1 chitinase 3-like 1 (cartilage glycoprotein-39) IGFBP2 20.3661 0.8237 202718_at 2q33-q34 insulin-like growth factor binding protein 2; 36kDa POSTN 20.2196 0.4941 210809_s_at 13q13.3 periostin; osteoblast specific factor
HSPG2 20.1447 0.3255 201655_s_at 1p36.1-p34 heparan sulfate proteoglycan 2 (perlecan) BMP2 0.1413 20.3179 205289_at 20p12 bone morphogenetic protein 2 COL1A1 20.1361 0.3062 1556499_s_at 17q21.3-q22.1 collagen; type I; alpha 1
NEK2 20.136 0.3061 204641_at 1q32.2-q41 NIMA (never in mitosis gene a)-related kinase 2 DLG7/DLGAP5 20.1245 0.2802 203764_at 14q22.3 discs; large homolog 7 (Drosophila)
FOXM1 20.113 0.2542 214148_at 12p13 Forkhead box M1
BIRC5 20.1081 0.2432 202095_s_at 17q25 baculoviral IAP repeat-containing 5 (survivin) PLK1 20.0646 0.1453 1555900_at 16p12.1 Polo-like kinase 1 (Drosophila)
NKX6–1 20.0551 0.124 221366_at 4q21.2-q22 NK6 transcription factor related; locus 1 (Drosophila) NRG3 0.0531 20.1195 229233_at 10q22-q23 neuregulin 3
BUB1B 20.0509 0.1146 203755_at 15q15 BUB1 budding uninhibited by benzimidazoles 1 homolog beta (yeast) VIM 20.0505 0.1137 201426_s_at 10p13 Vimentin
TNC 20.0479 0.1078 201645_at 9q33 tenascin C (hexabrachion) DLL3 0.0305 20.0685 219537_x_at 19q13 delta-like 3 (Drosophila) JAG1 20.0298 0.0671 209099_x_at 20p12.1-p11.23 jagged 1 (Alagille syndrome)
KI67/MKI67 20.0148 0.0334 212020_s_at 10q25-qter antigen identified by monoclonal antibody Ki-67 EZH2 20.0104 0.0235 203358_s_at 7q35-q36 enhancer of zeste homolog 2 (Drosophila)
BUB1 20.0029 0.0065 209642_at 2q14 BUB1 budding uninhibited by benzimidazoles 1 homolog (yeast) AURKA 20.0024 0.0053 208079_s_at 20q13.2-q13.3 serine/threonine kinase 6
1
PAM scores in low and high risk classes.
2
From AffymetrixH.
doi:10.1371/journal.pone.0066574.t004
new tool, easy to include in clinical routine, could represent a helpful marker to adapt an optimized and personalized manage-ment, both regarding the timing and the sequence of therapies with a better anticipation of the natural history of the disease at the individual level. It will also be useful for stratification of patients included in clinical trials.
Materials and Methods Patients
The ‘‘MPL’’ training cohort included 65 adult patients diagnosed with WHO grade II/III glioma undergoing surgery at Montpellier, Nice and Lille Hospitals during 2004–2007 without prior chemical or radiation therapy. All samples were processed in accordance with European bioethics laws regarding patient information: written consent was obtained from participants, tumor collection was accepted by the Center for Biological Collections of the Montpellier University Hospital (#AC-2009– 889) and the ethics committee CPP Sud-Me´diterrane´e IV approved this study (#CPP030601). Affymetrix U133 Plus 2.0 microarray data, histological staging and outcome for two validation cohorts of WHO grade II/III glioma patients (‘‘NL’’ [18], n = 104 and ‘‘NIH’’ [52,53], n = 73) were downloaded from the GEO database (GSE16011 and GSE4290). Clinical charac-teristics of patients are depicted in Table S3. Cohorts are assumed to be prospective.
Samples
At the time of resection, one sample for each tumor was immediately frozen and stored at 280uC and another sample was fixed in 4% formalin, embedded in paraffin, sectioned (3mm) and then stained with hematoxylin-eosin. The histopathological subtypes and grades of glioma were determined by two independent pathologists following the revised WHO 2007 classification [54] for both cohorts. Tumor subtypes consisting of grade II/III astrocytomas (n = 6), oligodendrogliomas (n = 43) and mixed oligoastrocytomas tumors (n = 16) were pooled in each grade as the distinction between subtypes can be inconsistent among pathologists due to subjective histological criteria and personal biases [55–57].
Gene Expression Profiling by QPCR
Quantitative real-time RT-PCR (QPCR) was performed as described previously [58]. Briefly, cDNA were made from total RNA extracted from frozen tissues. QPCRs were performed using the SYBR Green PCR Core Reagents Kit (Perkin-Elmer Applied Biosystems). The thermal cycling conditions comprised an initial denaturation step at 95uC for 10 min and 50 cycles at 95uC for 15 s and 65uC for 1 min. Experiments were performed in duplicates for each data point using primers described in supplementary Table S2. For each gene, mRNA expression was calculated relative to TBP (TATA Box Binding Protein) expres-sion. Results, expressed as n-fold differences in target gene expression relative to the TBP gene (termed Ntarget), were determined with the following formula: Ntarget = 2DCtsample, where the DCt value of the sample was determined by subtracting the average Ct value of the target gene from the average Ct value of the TBP gene. Missing values were replaced by the minimal value of the gene expression across the cohort, and expression signals were scaled positive as log2(Ntarget 61000).
Gene Expression Based Stratification
We first quantified the expression of a list of 365 preselected genes in 5 samples of grade II glioma (3 oligodendrogliomas and
two mixed tumors), 5 grade III gliomas (two oligodendrogliomas, two mixed tumors and one astrocytoma), 5 control brain tissues derived from epileptic resections and 5 GBM samples using QPCR as described above. Analysis of this quantification revealed 45 genes with a 2 fold increase between grade II and III gliomas while 47 genes displayed a 2 fold decrease. In addition, we performed Mann-Whitney tests between grade II and III for these 365 genes to identify those showing a minimal fold change but with a strong discrimination score between the two glioma grades. This allowed us to select 11 additional genes. From this first list of 103 (45+47+11) genes, we selected 33 of them based on their level of expression, their fold change and individual P-value, their QPCR reproducibility and their relevance to cancer and glioma. In addition, we included 5 genes (TIMELESS, SMO, BMP2, EGFR, NKX6.1) which displayed a strong variation of expression from one glioma sample to another within the same grade, suggesting that these genes could identify glioma subgroups. Expression of this 38-gene list was then analyzed by QPCR on the whole MPL cohort including the five grades II/III samples of the preliminary screening. Elimination of genes not significantly relevant to overall survival was achieved using a univariate Cox-model analysis of the expression of each of these genes on overall survival with multiple testing correction [59] at a 5% false discovery rate. A final list of 27 significant genes (Table S4) was obtained and subsequently used to classify the training cohort and to analyze the validation cohort.
Mathematical Analysis, Validation and Predictor Construction
Computations were performed using R (http://www.R-project. org) and Bioconductor [60].
Normalization and scaling of QPCR and microarray
expression signals. QPCR signals from the 38 gene list
expressed in the training cohort were centered using the scale function of the R base package. The Affymetrix raw ‘‘CEL’’ files from the patient samples of the NL validation cohort were first normalized together using the ‘‘gcrma’’ R-package [61] while recording processing parameters for further new sample normal-ization. Samples from the NIH validation cohorts were normalized one CEL file after the other with the previously-saved prepro-cessing parameters using incremental preproprepro-cessing from a modification [62] of the ‘‘docval’’ R-pakage [63]. For each QPCR gene the relevant probe set was extracted. The most variable of multiple probes for the same gene was selected when necessary. The expression signals were again scaled in the validation cohorts.
Building the classification on the training cohort. Batch-adjustment of microarray and QPCR-measured expression values was checked by a genewise one-way ANOVA using the ‘‘pamr’’ R-package [64]. Hierarchical clustering and subsequent expres-sion heatmap were performed using Euclidean distance. A shrunken centroid classifier (PAM) was built with adapted shrinkage thresholds by training on the two classes clustered in training MPL cohort. A 10-times cross-validation allowed selecting a threshold minimizing misclassification errors in both training and cross-validation confusion matrices.
Predicting the Glioma PAM Classification in the Validation Cohorts
The prognostic score was validated in two independent patient cohorts using the ‘‘pamr’’ algorithm and optimized parameters and threshold obtained on the training cohort.
Survival was analyzed using a Cox model applied to outcome and depicted using Kaplan-Meier curves and log-rank test.
Extrapolation of survival curves was performed using a parametric regression model assuming a Weibull distribution fit [65].
Supporting Information
Figure S1 Gene expression-based predictor
construc-tion using PAM. The PAM shrunken centroid method was used to select 22 genes. (A) Individual gene expression in the training cohort. (B and C) The optimal number of genes in the predictor corresponds to the minimum number of misclassification errors. (D) The class score of each selected centroid is plotted according to its class incidence. In all plots, the red color represents poor prognosis genes.
(PDF)
Figure S2 Incidence of histopathological subtypes of
gliomas on overall survival. Kaplan-Meier curves were designed and log-rank tests performed on both WHO and our PAM classifications for all cohorts either unseparated (A, E, I) or separated into their histological components, astrocytomas (B, F, J), mixed (D, G, K) or oligodendrogliomas (C, H, L).
(PDF)
Table S1 List of 365 initially selected genes with annotations. (XLS)
Table S2 Primers and expression of 38 genes in the training cohort. Values represent n-fold differences in target gene expression relative to the TBP reference gene.
(XLS)
Table S3 Clinical characteristics of patient cohorts. (PDF)
Table S4 Twenty-seven genes significant in univariate Cox model analysis of overall survival in training cohort after multiple testing correction.
(PDF)
Acknowledgments
We thank ARTC Sud (Association pour la Recherche sur les Tumeurs Ce´re´brales) for its help in this study. The authors are indebted to Pr Pim J. French, Rotterdam, Netherlands for available datasets of patients with glioma, Vanessa Gros for clinical management and the ‘‘Centre des Collections Biologiques Hospitalie`res’’, Montpellier University Hospital, France.
Author Contributions
Conceived and designed the experiments: DJ LB TR JPH. Performed the experiments: IB SV RL VR FBV. Analyzed the data: TR JPH DJ LB HD. Contributed reagents/materials/analysis tools: HD LB MB DF HC VP. Wrote the paper: TR JPH HD LB DJ. Contributed to manuscript revision: TR JPH IB VR FBV VP MB DF HC SV RL HD LB DJ.
References
1. Rigau V, Zouaoui S, Mathieu-Daude H, Darlix A, Maran A, et al. (2011) French brain tumor database: 5-year histological results on 25 756 cases. Brain Pathol 21: 633–644.
2. Jukich PJ, McCarthy BJ, Surawicz TS, Freels S, Davis FG (2001) Trends in incidence of primary brain tumors in the United States, 1985–1994. Neuro Oncol 3: 141–151.
3. Bauchet L, Mathieu-Daude H, Fabbro-Peray P, Rigau V, Fabbro M, et al. (2010) Oncological patterns of care and outcome for 952 patients with newly diagnosed glioblastoma in 2004. Neuro Oncol 12: 725–735.
4. CBTRUS (2012) CBTRUS Statistical Report: Primary Brain and Central Nervous System Tumors Diagnosed in the United States in 2004–2008 wwwcbtrusorg/2012-NPCR-SEER/CBTRUS_Report_2004–2008_3-23-2012pdf.
5. Mandonnet E, Delattre JY, Tanguy ML, Swanson KR, Carpentier AF, et al. (2003) Continuous growth of mean tumor diameter in a subset of grade II gliomas. Ann Neurol 53: 524–528.
6. Ricard D, Idbaih A, Ducray F, Lahutte M, Hoang-Xuan K, et al. (2012) Primary brain tumours in adults. Lancet 379: 1984–1996.
7. van den Bent MJ, Carpentier AF, Brandes AA, Sanson M, Taphoorn MJ, et al. (2006) Adjuvant procarbazine, lomustine, and vincristine improves progression-free survival but not overall survival in newly diagnosed anaplastic oligoden-drogliomas and oligoastrocytomas: a randomized European Organisation for Research and Treatment of Cancer phase III trial. J Clin Oncol 24: 2715–2722. 8. Shinohara C, Muragaki Y, Maruyama T, Shimizu S, Tanaka M, et al. (2008) Long-term prognostic assessment of 185 newly diagnosed gliomas: Grade III glioma showed prognosis comparable to that of Grade II glioma. Jpn J Clin Oncol 38: 730–733.
9. Prayson RA, Agamanolis DP, Cohen ML, Estes ML, Kleinschmidt-DeMasters BK, et al. (2000) Interobserver reproducibility among neuropathologists and surgical pathologists in fibrillary astrocytoma grading. J Neurol Sci 175: 33–39. 10. Pallud J, Mandonnet E, Duffau H, Kujas M, Guillevin R, et al. (2006) Prognostic value of initial magnetic resonance imaging growth rates for World Health Organization grade II gliomas. Ann Neurol 60: 380–383.
11. Price SJ (2010) Advances in imaging low-grade gliomas. Adv Tech Stand Neurosurg 35: 1–34.
12. Chakravarti A, Noll E, Black PM, Finkelstein DF, Finkelstein DM, et al. (2002) Quantitatively determined survivin expression levels are of prognostic value in human gliomas. J Clin Oncol 20: 1063–1068.
13. Heegaard S, Sommer HM, Broholm H, Broendstrup O (1995) Proliferating cell nuclear antigen and Ki-67 immunohistochemistry of oligodendrogliomas with special reference to prognosis. Cancer 76: 1809–1813.
14. Stemmer-Rachamimov AO, Louis DN (1997) Histopathologic and immunohis-tochemical prognostic factors in malignant gliomas. Curr Opin Oncol 9: 230– 234.
15. Shirahata M, Iwao-Koizumi K, Saito S, Ueno N, Oda M, et al. (2007) Gene expression-based molecular diagnostic system for malignant gliomas is superior to histological diagnosis. Clin Cancer Res 13: 7341–7356.
16. Nutt CL, Mani DR, Betensky RA, Tamayo P, Cairncross JG, et al. (2003) Gene expression-based classification of malignant gliomas correlates better with survival than histological classification. Cancer Res 63: 1602–1607.
17. Li A, Walling J, Ahn S, Kotliarov Y, Su Q, et al. (2009) Unsupervised analysis of transcriptomic profiles reveals six glioma subtypes. Cancer Res 69: 2091–2099. 18. Gravendeel LA, Kouwenhoven MC, Gevaert O, de Rooi JJ, Stubbs AP, et al. (2009) Intrinsic gene expression profiles of gliomas are a better predictor of survival than histology. Cancer Res 69: 9065–9072.
19. Freije WA, Castro-Vargas FE, Fang Z, Horvath S, Cloughesy T, et al. (2004) Gene Expression Profiling of Gliomas Strongly Predicts Survival. Cancer Research 64: 6503–6510.
20. Petalidis LP, Oulas A, Backlund M, Wayland MT, Liu L, et al. (2008) Improved grading and survival prediction of human astrocytic brain tumors by artificial neural network analysis of gene expression microarray data. Molecular Cancer Therapeutics 7: 1013–1024.
21. Cooper LAD, Gutman DA, Long Q, Johnson BA, Cholleti SR, et al. (2010) The Proneural Molecular Signature Is Enriched in Oligodendrogliomas and Predicts Improved Survival among Diffuse Gliomas. PLoS ONE 5: e12548.
22. de Tayrac M, Aubry M, Saı¨kali S, Etcheverry A, Surbled C, et al. (2011) A 4-Gene Signature Associated with Clinical Outcome in High-Grade Gliomas. Clinical Cancer Research 17: 317–327.
23. Re`me T, Hose D, Theillet C, Klein B (2013) Modeling Risk Stratification in Human Cancer. Bioinformatics 29: 1149–1157.
24. Kannan K, Inagaki A, Silber J, Gorovets D, Zhang J, et al. (2012) Whole-exome sequencing identifies ATRX mutation as a key molecular determinant in lower-grade glioma. Oncotarget 3: 1194–1203.
25. Ducray F, Idbaih A, de Reynies A, Bieche I, Thillet J, et al. (2008) Anaplastic oligodendrogliomas with 1p19q codeletion have a proneural gene expression profile. Mol Cancer 7: 41.
26. Piccirillo SG, Reynolds BA, Zanetti N, Lamorte G, Binda E, et al. (2006) Bone morphogenetic proteins inhibit the tumorigenic potential of human brain tumour-initiating cells. Nature 444: 761–765.
27. Ladi E, Nichols JT, Ge W, Miyamoto A, Yao C, et al. (2005) The divergent DSL ligand Dll3 does not activate Notch signaling but cell autonomously attenuates signaling induced by other DSL ligands. J Cell Biol 170: 983–992.
28. Jiang L, Wu J, Chen Q, Hu X, Li W, et al. (2011) Notch1 expression is upregulated in glioma and is associated with tumor progression. J Clin Neurosci 18: 387–390.
29. Li J, Cui Y, Gao G, Zhao Z, Zhang H, et al. (2011) Notch1 is an independent prognostic factor for patients with glioma. J Surg Oncol 103: 813–817. 30. Duhem-Tonnelle V, Bieche I, Vacher S, Loyens A, Maurage CA, et al. (2010)
Differential distribution of erbB receptors in human glioblastoma multiforme: expression of erbB3 in CD133-positive putative cancer stem cells. J Neuropathol Exp Neurol 69: 606–622.
31. Fuller GN, Rhee CH, Hess KR, Caskey LS, Wang R, et al. (1999) Reactivation of insulin-like growth factor binding protein 2 expression in glioblastoma
multiforme: a revelation by parallel gene expression profiling. Cancer Res 59: 4228–4232.
32. Tanwar MK, Gilbert MR, Holland EC (2002) Gene expression microarray analysis reveals YKL-40 to be a potential serum marker for malignant character in human glioma. Cancer Res 62: 4364–4368.
33. Zinn PO, Mahajan B, Sathyan P, Singh SK, Majumder S, et al. (2011) Radiogenomic mapping of edema/cellular invasion MRI-phenotypes in glioblastoma multiforme. PLoS One 6: e25451.
34. Nigro JM, Misra A, Zhang L, Smirnov I, Colman H, et al. (2005) Integrated array-comparative genomic hybridization and expression array profiles identify clinically relevant molecular subtypes of glioblastoma. Cancer Res 65: 1678– 1686.
35. Phillips HS, Kharbanda S, Chen R, Forrest WF, Soriano RH, et al. (2006) Molecular subclasses of high-grade glioma predict prognosis, delineate a pattern of disease progression, and resemble stages in neurogenesis. Cancer Cell 9: 157– 173.
36. Morra L, Moch H (2011) Periostin expression and epithelial-mesenchymal transition in cancer: a review and an update. Virchows Arch 459: 465–475. 37. Cooper LA, Gutman DA, Long Q, Johnson BA, Cholleti SR, et al. (2010) The
proneural molecular signature is enriched in oligodendrogliomas and predicts improved survival among diffuse gliomas. PLoS One 5: e12548.
38. Bie L, Zhao G, Cheng P, Rondeau G, Porwollik S, et al. (2011) The accuracy of survival time prediction for patients with glioma is improved by measuring mitotic spindle checkpoint gene expression. PLoS One 6: e25631.
39. Yu CT, Hsu JM, Lee YC, Tsou AP, Chou CK, et al. (2005) Phosphorylation and stabilization of HURP by Aurora-A: implication of HURP as a transforming target of Aurora-A. Mol Cell Biol 25: 5789–5800.
40. Kalin TV, Ustiyan V, Kalinichenko VV (2011) Multiple faces of FoxM1 transcription factor: lessons from transgenic mouse models. Cell Cycle 10: 396– 405.
41. Hayward DG, Fry AM (2006) Nek2 kinase in chromosome instability and cancer. Cancer Lett 237: 155–166.
42. Eckerdt F, Yuan J, Strebhardt K (2005) Polo-like kinases and oncogenesis. Oncogene 24: 267–276.
43. Liang Y, Diehn M, Watson N, Bollen AW, Aldape KD, et al. (2005) Gene expression profiling reveals molecularly and clinically distinct subtypes of glioblastoma multiforme. Proc Natl Acad Sci U S A 102: 5814–5819. 44. Zhou Z, Wang J, Cao R, Morita H, Soininen R, et al. (2004) Impaired
angiogenesis, delayed wound healing and retarded tumor growth in perlecan heparan sulfate-deficient mice. Cancer Res 64: 4699–4702.
45. Jubb AM, Browning L, Campo L, Turley H, Steers G, et al. (2012) Expression of vascular Notch ligands Delta-like 4 and Jagged-1 in glioblastoma. Histopathol-ogy 60: 740–747.
46. Mamaeva D, Ripoll C, Bony C, Teigell M, Perrin FE, et al. (2011) Isolation of mineralizing Nestin+ Nkx6.1+ vascular muscular cells from the adult human spinal cord. BMC Neurosci 12: 99.
47. Zagzag D, Friedlander DR, Dosik J, Chikramane S, Chan W, et al. (1996) Tenascin-C expression by angiogenic vessels in human astrocytomas and by human brain endothelial cells in vitro. Cancer Res 56: 182–189.
48. Hanahan D, Weinberg RA (2011) Hallmarks of cancer: the next generation. Cell 144: 646–674.
49. Elmlinger MW, Deininger MH, Schuett BS, Meyermann R, Duffner F, et al. (2001) In Vivo Expression of Insulin-Like Growth Factor-Binding Protein-2 in Human Gliomas Increases with the Tumor Grade. Endocrinology 142: 1652– 1658.
50. Nutt CL, Betensky RA, Brower MA, Batchelor TT, Louis DN, et al. (2005) YKL-40 is a differential diagnostic marker for histologic subtypes of high-grade gliomas. Clin Cancer Res 11: 2258–2264.
51. Simon R (2005) Roadmap for Developing and Validating Therapeutically Relevant Genomic Classifiers. Journal of Clinical Oncology 23: 7332–7341. 52. Madhavan S, Zenklusen JC, Kotliarov Y, Sahni H, Fine HA, et al. (2009)
Rembrandt: helping personalized medicine become a reality through integrative translational research. Mol Cancer Res 7: 157–167.
53. National Cancer Institute website. Available: https://caintegrator.nci.nih.gov/ rembrandt Accessed 2013 may 15.
54. Louis DN, Ohgaki H, Wiestler OD, Cavenee WK, Burger PC, et al. (2007) The 2007 WHO classification of tumours of the central nervous system. Acta Neuropathol 114: 97–109.
55. Perry A (2001) Oligodendroglial neoplasms: current concepts, misconceptions, and folklore. Adv Anat Pathol 8: 183–199.
56. Daumas-Duport C, Tucker ML, Kolles H, Cervera P, Beuvon F, et al. (1997) Oligodendrogliomas. Part II: A new grading system based on morphological and imaging criteria. J Neurooncol 34: 61–78.
57. Daumas-Duport C, Varlet P, Tucker ML, Beuvon F, Cervera P, et al. (1997) Oligodendrogliomas. Part I: Patterns of growth, histological diagnosis, clinical and imaging correlations: a study of 153 cases. J Neurooncol 34: 37–59. 58. Bieche I, Parfait B, Le Doussal V, Olivi M, Rio MC, et al. (2001) Identification
of CGA as a novel estrogen receptor-responsive gene in breast cancer: an outstanding candidate marker to predict the response to endocrine therapy. Cancer Res 61: 1652–1658.
59. Benjamini Y, Hochberg Y (1995) Controlling the False Discovery Rate: a practical and powerful approach to multiple testing. Journal of the Royal Statistical Society Series B 57: 289–300.
60. Gentleman RC, Carey VJ, Bates DM, Bolstad B, Dettling M, et al. (2004) Bioconductor: open software development for computational biology and bioinformatics. Genome Biol 5: R80.
61. Wu Z, Irizarry RA, Gentleman RC, Martinez-Murillo F, Spencer F (2004) A Model-Based Background Adjustment for Oligonucleotide Expression Arrays. Journal of the American Statistical Association 99: 909–917.
62. Meißner T, Seckinger A, Re`me T, Hielscher T, Mo¨hler T, et al. (2011) Gene Expression Profiling in Multiple Myeloma–Reporting of Entities, Risk, and Targets in Clinical Routine. Clinical Cancer Research 17: 7240–7247. 63. Kostka D, Spang R (2008) Microarray based diagnosis profits from better
documentation of gene expression signatures. PLoS Comput Biol 4: e22. 64. Tibshirani R, Hastie T, Narasimhan B, Chu G (2002) Diagnosis of multiple
cancer types by shrunken centroids of gene expression. Proceedings of the National Academy of Sciences 99: 6567–6572.
65. Therneau T, Grambsch P (2000) Modeling Survival Data: Extending the Cox Model: Springer-Verlag New York, Berlin, Heidelberg.