Abstract: Recently, we reported the extraction, purification and amino acid sequence of ansocalcin, the major goose eggshell matrix protein. In vitro studies showed that ansocalcin induces spherical calcite crystal aggregates. We designed two peptides using the unique features of the sequence of ansocalcin and the role of these peptides in CaCO3 crystallization was investigated. The peptides showed similar activities as compared to ansocalcin, but at a higher concentration. The full characterization of the peptides and a rational for the observed morphology for the calcite crystals are discussed in detail.
Key Words-Biomineralization, calcium carbonate, crystallization, oligopeptides
I. INTRODUCTION
Avian eggshells are excellent model systems for biomineralization. The eggshell formation takes place in an extracellular milieu containing mineralized and non-mineralized regions. The mineral deposition in eggshell (~ 5 g per day) is about 100 to 1000 times faster than in nacre (few grams per year) making it one of the fastest bioceramic produced.1,2 The mineral columns (calcite) grow from a predisposed nucleating sites and is stopped by contact with the adjacent column resulting in spherulite-type crystal lattice.3,4 Recently, we reported the amino acid sequence of ansocalcin, a major extracellular protein purified from goose eggshell matrix.5 One of the salient features of ansocalcin sequence is the existence of acidic and basic amino acid multiplets. Although such multiplets are present in other proteins extracted from calcium carbonate biominerals,6-9 their role in mineralization have not yet been fully understood. To understand the role of such multiplets, we designed two peptides and investigated their influence in CaCO3 crystallization (Table 1). The incorporation of proline residue in REWDP17 is intended to introduce a turn and to investigate the role of oligomerization of the peptide10 in biomineralziation. Here we discuss the full characterization of the primary and secondary structures of the peptides in solution and their role in biomineralization.
This work was supported by the Singapore-MIT Alliance, National University of Singapore, Singapore through research grants.
* To whom the correspondence should be addressed
1Singapore-MIT Alliance National University of Singapore, Singapore 119260.
2
Department of Chemistry, National University of Singapore, Singapore 117543
3
Department of Biological Sciences, National University of Singapore, Singapore 117543
II. RESULTS AND DISCUSSION
Both peptides were synthesized using a peptide synthesizer (Applied Biosystems) employing Fmoc-chemistry. The solubility of the peptide REWD16 was poor in water, especially at higher concentrations (>2 mg/mL) compared to the soluble peptide REWDP17. However both peptides were
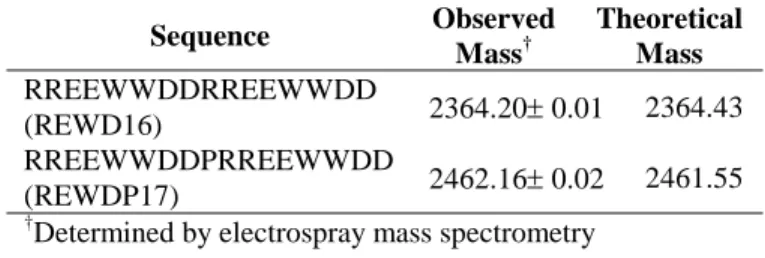
Table 1. Amino acid sequence, observed and theoretical masses of the synthetic peptides.
readily soluble in 7.5 mM CaCl2 solution. The peptides were dissolved in 7.5 mM CaCl2 solution and the crystallization experiments were performed using a previously reported procedure.11 A thorough investigation of the influence of ansocalcin in invitro nucleation of calcite crystal aggregate was reported elsewhere.5 The shape and morphology of CaCO3 crystals grown in presence of the synthetic peptides changed with the concentration. In the case of peptide REWD16, at low concentrations (0.050, 0.1, 0.25, 0.5 and 1 mg/mL), regular rhombohedral morphology of calcite crystals was observed. As the concentration was increased, the crystals exhibited macroscopic steps and aggregation properties (Fig. 1 B, C). At the highest concentration, 2 mg/mL, large crystal aggregates were observed (Fig. 1D). In presence of peptide REWDP17, up to 0.5 mg/mL, rhombohedral calcite crystals exhibiting screw dislocations were formed (Fig. 1E). The surfaces of the crystals were severely roughened and heavily corrugated as the concentration of the peptide was increased. As seen in the case of REWD16, at the highest concentration (2 mg/mL) of REWDP17, large crystal aggregates were formed (Fig. 1E). At 2 mg/mL, both peptides reduced the crystal aggregate size from ~38 ± 5 µm (0.5 mg/mL) to 17 ± 3 µm (2 mg/mL).
X-ray diffraction studies of the crystals showed a strong diffraction maximum at 2θ ≈ 30, which corresponds to {104}-faces of the rhombohedral calcite crystallites (Fig. 2 inset). In the powdered form, diffractions from all other calcite crystal
Designer peptides to understand the mineralization of calcium salts
Parayil Kumaran Ajikumar1, Rajamani Lakshminarayanan2, Suresh Valiyaveettil*1,2, R. Manjunatha Kini3
Sequence Observed Mass† Theoretical Mass RREEWWDDRREEWWDD (REWD16) 2364.20± 0.01 2364.43 RREEWWDDPRREEWWDD (REWDP17) 2462.16± 0.02 2461.55 †
planes were observed (Fig. 2). This shows that the crystal aggregates are truly single crystalline in nature.
Figure 1. Representative SEM images of the calcite crystals grown (A) in the absence of any protein or peptides (control), in presence of synthetic peptides REWD16 [B (0.05 mg/mL), C (0.5 mg/mL) and D D (2 mg/mL )] and REWDP17 [E (0.5 mg/mL )and F (2 mg/mL)]. The scale bar indicates 5 µm.
20 30 40 50 60 2θθθθ In tens it y (a .u .) (01 2 ) (104) (006 ) (110) (113) (202) (018 ) (024) (116) (211) (122 ) 20 40 60 20 30 40 50 60 2θθθθ In tens it y (a .u .) (01 2 ) (104) (006 ) (110) (113) (202) (018 ) (024) (116) (211) (122 ) 20 40 60
The Figure 2. XRD of the powdered (A) and single crystal (B) aggregates formed in presence of 2 mg/mL of the peptide REWD16.
The secondary structures of both peptides were studied using CD spectroscopy at 25° C in 7.5 mM CaCl2 solution (Fig. 3). Both the peptides exhibited strong changes in the secondary structures of both peptides were studied using CD spectroscopy at 25° C in 7.5 mM CaCl2 solution (Fig. 3). Both the peptides exhibited strong changes in the secondary structure with change in peptide concentration. For REWD16 peptide, a negative minimum around 216 nm and a positive maximum at 198 nm are indicative of high degree of β-sheet
conformation. As the concentration was increased the amplitude of the negative minimum and the positive maximum increases. Incorporation of proline into the sequence (i.e., REWDP17) resulted in appearance of negative band at 227 nm indicative of β-turn conformation.12,13
In the case of the peptide REWDP17 as the concentration was increased up to 0.5 mg/mL, intensity of negative minimum at 227 nm increases. Upon further increase in concentration of the peptide, the features of the CD spectrum changes significantly. The negative band around 227 nm shifted to 233 nm. This might be due to the tryptophan-tryptophan interactions caused by aggregation of the peptide.
-73 -33 7 190 210 230 250 Wavelength in nm CD in m illid eg re es 1 2 3 Wavelength in nm CD in m illid eg re es -4 6 16 190 210 230 250
A
1 2 3 -73 -33 7 190 210 230 250 Wavelength in nm CD in m illid eg re es 1 2 3 -73 -33 7 190 210 230 250 Wavelength in nm CD in m illid eg re es 1 2 3 Wavelength in nm CD in m illid eg re es -4 6 16 190 210 230 250A
1 2 3 Wavelength in nm CD in m illid eg re es -4 6 16 190 210 230 250A
1 2 3 -4 6 16 190 210 230 250A
1 2 3Figure 3. Circular dichroism of the synthetic peptides, REWD16 (A) and REWDP17 (B). The peptide concentration used are (1) 0.5 mg/mL; (2) 1 mg/mL; (3) 2 mg/mL in 7.5 mM CaCl2
In order to understand the self-assembly of the peptide and the changes around the tryptophan in native and aggregated state of the peptides, we carried out fluorescent emission studies Both peptides showed distinct emission characteristics The emission maximum for REWD16 was observed around 348 nm (Fig. 4). This was red shifted to 357 nm for the 17-mer peptide REWDP17 indicating that incorporation of proline exposes the Trp residues more strongly to outside environment. The emission spectra showed changes with change in peptide concentration. For REWD16, the fluorescence intensity increases with peptide concentration up to 0.25 mg/mL and decreases. The decrease was accompanied by blue shift in the emission maxima to 341 nm at the highest concentration of the peptide (2 mg/mL).
1 2 3 4 5 6 Emission Wavelength, nm In tens it y (a. u .)
Figure 4. Intrinsic tryptophan fluorescent emission spectrum of the synthetic peptides REWD16 (A) at various concentrations. The decrease in intensity is indicated by gray lines. (1) 0.05 mg/mL; (2) 0.1 mg/mL; (3) 0.25 g/mL; (4) 0.5 mg/mL; (5) 1 mg/mL (6) 2 mg/mL
D
E
C
F
A
B
For REWDP17, emission intensity increases up to 0.25 mg/mL, remained same at 0.5 mg/mL and decreases. The emission maximum was blue shifted to 347 nm at 2 mg/mL. For both peptides, a remarkable reduction (~ 85%) in emission intensity was observed at 2 mg/mL This large decrease may due to the quenching of the tryptophan by arginine residues, which were brought into close proximity by the aggregation of peptide molecules.14 Data collected from both CD and fluorescence studies confirmed the concentration dependant self aggregation of peptides. Moreover, calcium ions may also induce the self-assembly of the peptides.15 This was not the case with the parent protein, in which calcium ions had no effect on the aggregation Since such assembly of peptide encompass more molecules, it is reasonable to expect that they accelerate the nucleation of crystal aggregates and thereby reducing the overall size and increasing the nucleation density of the crystals. Thus the calcite crystal aggregates observed at higher concentration might be due to the self-assembly of peptides. Altogether, these observations confirm the important role played by the acidic and basic amino acid residues towards nucleating polycrystalline aggregates of calcite crystals. It is also remarkable that the activity of the peptides at higher concentration is comparable with the parent protein ansocalcin. As expected the effectiveness of the peptides is about 5 to 10 times lower. We are pursuing these studies and further details will be reported elsewhere
III. EXPERIMENTAL PROCEDURES
Synthesis and Characterization of the Peptides:
Fmoc-PAL-PEG-PS and all the Nα-Fmoc-L-amino acid pentafluorophenyl esters were purchased from Novabiochem, San Diego CA. The peptides were synthesized using The Pioneer peptide synthesizer (Applied Biosystems) using the Nα-Fmoc-L-amino acid pentafluorophenyl ester/HOBt coupling method. The peptides REWD16 and REWDP17 were assembled on an Fmoc-PAL-PEG-PS (0.18 mmole/g) resin. Both the peptides were synthesized on a 0.1 mmole scale using the extended cycle protocol. The completed peptides were deprotected and cleaved by treating with the cleavage cocktail (90% trifluoroacetic acid (TFA), 2.5% phenol, 2.5% water, 2.5% thioanizole, 2.5% ethanedithiol) for 3 hours at room temperature. The mixture was filtered and the filtrate was concentrated under reduced pressure. The peptide was precipitated from ice cooled diethylether. This precipitated peptide was centrifuged on an ultracentrifuge with repeated washing by ice cold ether to remove all contaminants. Finally the peptides were lyophilized with 10% acetic acid solution and obtained as white powder and were purified using the Phenominex (250 ×10 nm, 10µ) C18 reverse-phase column (on a BioCAD Workstation). The solvent system used for the purification is as follows: solvent A, 0.1%TFA and solvent B, 0.1% TFA in 80% acetonitrile. The linear gradient (flow rate 2 mL/min) 25%-50% B over 50 min was used. The peptide elution was monitored at 215 nm. The purity of the peptides was confirmed by analytical HPLC and ESI MS.
Circular Dichroism Experiments: Circular dichroism
experiments were done using Jasco J 715 spectropolarimeter. The CD spectra of the peptides (50 µg/mL - 2 mg/mL) in CaCl2 (7.5 mM) were collected at the wavelength range of 260 to 190 nm using 0.1 mm sample cell. The instrument optics was flushed with 30 L/min nitrogen gas. A total of three scans were recorded and averaged for each spectrum and baseline was subtracted.
Fluorescence Spectroscopy: The fluorescence emission
spectra were collected on a Shimadzu RF-5301PC spectrofluorophotometer, with the emission and excitation band passes set at 3 nm. The excitation wavelength was set at 295 nm and the spectra were recorded from 300 to 400 nm at a scan rate of 50 nm/min. Spectra of the peptides were recorded in 7.5 mM CaCl2 solution.
Crystal Growth Experiments: CaCO3 crystals were grown on glass cover slips placed inside the CaCl2 solution kept in a Nunc dish 4 × 6 wells. Typically, 1 mL of 7.5 mM CaCl2 solution was introduced into the wells containing the cover slips and the whole set up was covered with aluminum foil with a few pinholes on the top. To study the role of synthetic peptides in the CaCO3 crystallization, aliquots of peptides (50 µg/mL - 2 mg/mL) dissolved in 7.5 mM CaCl2 solution was introduced into each well containing the cover slips. Crystals were grown inside a closed desiccator for 2 days by slow diffusion of gases from the decomposition of ammonium carbonate placed at the bottom of the desiccator. After 2 days, the slides were carefully lifted from the crystallization wells, rinsed gently with Millipore water, air dried at room temperature, glued to copper stubs and used for further analysis.
Scanning Electron Microscopy (SEM): SEM studies on the
CaCO3 crystals were carried out using JEOL 2200 scanning electron microscope at 15/20 kV after sputter coating with gold to increase the conductivity.
X-ray Diffraction Studies: Powder and single crystal X-ray
diffraction studies on the crystals were carried out using D5005 X-ray diffractometer with Cu-Kα radiation at 40 kV and 40 mA multisampler system. For the X-ray investigation, the samples were slightly crushed using a mortar, placed on a plastic holder and wetted with a drop of ethanol to form continuous film. Similarly the crystals grown on glass plates were mounted on the plastic holder and carried out the experiments.
ACKNOWLEDGMENT
P. K. A. thanks SMA for the research fellowship; R.L.N acknowledge the Singapore Millennium Foundation for a fellowship. We acknowledge the financial support from SMA and technical support from Department of Chemistry and Department of Biological Sciences.
REFERENCES
[2] A. H. Heuer, D. J. Fink, V. J. Laraia, J. L. Arias, P. D. Calvert, K. Kendall, G. L. Messing, J. Blackwell, P. C. Rieke, D. H. Thompson, A. P. Wheeler, A. Veis and A. I. Caplan, “Innovative materials processing strategies - a biomimetic approach,” Science, 255, pp. 1098-1105, 1992. [3] S. Weiner and L. Addadi, “Design strategies in mineralized biological
materials,” J. Mater. Chem., 7, pp. 689-702, 1997.
[4] Mann S., In Biomineralization: Chemical and Biochemical perspectives (Mann, S.; Webb, J.; Williams, R. J. P., eds), 1989, pp. 35-62, VCH Publishers, New York.
[5] R. Lakshminarayanan, S. Valiyaveettil and R. M. Kini, “Investigation of the role of ansocalcin in the biomineralization in goose eggshell matrix,” Proc. Natl. Acad. Sci., USA, 99, pp. 5155-5159, 2002.
[6] T. Samata, N. Hayashi, M. Kono, K. Hasegawa, C. Horita and S. Akera, “A new matrix protein family related to the nacreous layer formation of Pinctada fucata ,” FEBS Lett., 462, pp. 225-229, 1999.
[7] A. George, L. Bannon,, B. Sabsay, J. W. Dillon, J. Malone, A. Veis, N.A. Jenkins, D. J. Gilbert and N. G. Copeland, “The Carboxyl-terminal Domain of Phosphophoryn Contains Unique Extended Triplet Amino Acid Repeat Sequences Forming Ordered Carboxyl-Phosphate Interaction Ridges That May Be Essential in the Biomineralization Process,” J. Biol. Chem., 271, pp. 32869-32873, 1996.
[8] I. Sarashina and K. Endo, “The complete primary structure of molluscan shell protein 1 (MSP-1), an acidic glycoprotein in the shell matrix of the scallop Patinopecten yessoensis,” Mar. Biotechnol., 3, pp. 362-369, 2001.
[9] O. Testeniere, A. Hecker, S. Le Gurun, B. Quennedey, F. Graf and G. Luquet, “Characterization and spatiotemporal expression of orchestin, a gene encoding an ecdysone-inducible protein from a crustacean organic matrix,” Biochem. J., 361, pp. 327-335, 2002.
[10] M. Bergdoll, M. H. Remy, C. Cagnon, J. M. Masson and P. Dumas,
“Proline-dependent oligomerization with arm exchange,” Structure, 5,
pp. 391-401, 1997.
[11] S. Albeck, J. Aizenberg, L. Addadi and S. Weiner, “Interactions of various skeletal intracrystalline components with calcite crystals” J. Am. Chem. Soc., 115, pp. 11691-11697, 1993.
[12] N. Sreerama and R. W. Woody, “Poly(pro)ii helices in globular-proteins - identification and circular dichroic analysis,” Biochemistry, 88, pp. 10022-10025, 1994,.
[13] S.C. Shankaramma, S.K. Singh, A. Sathyamurthy and P. Balaram, “Insertion of methylene units into the turn segment of designed beta-hairpin peptides,” J. Am. Chem. Soc., 121, pp. 5360-5363, 1999. [14] L.W. Ruddock, T. R. Hirst and R. B. Freedman, “pH-dependence of the
dithiol-oxidizing activity of DsbA (a periplasmic protein thiol:disulphide oxidoreductase) and protein disulphide-isomerase: Studies with a novel simple peptide substrate,” Biochem. J., 315, pp. 1001-1005, 1996.
[15] J.H. Collier, B. Hu, J. W. Ruberti,. J. Zhang, P. Shum, D. H. Thompson and P. B. Messersmith,, Theremally and photochemically triggered self-assembly of peptide hydrogels, J. Am. Chem. Soc., 123, pp. 9463-9464, 2001.
![Figure 1. Representative SEM images of the calcite crystals grown (A) in the absence of any protein or peptides (control), in presence of synthetic peptides REWD16 [B (0.05 mg/mL), C (0.5 mg/mL) and D D (2 mg/mL )] and REWDP17 [E (0.5 mg/mL )and F (2 mg](https://thumb-eu.123doks.com/thumbv2/123doknet/14722880.570877/2.918.73.441.139.562/figure-representative-calcite-crystals-peptides-presence-synthetic-peptides.webp)
