ORIGINAL ARTICLE
Potential of hybrid
18
F-fluorocholine PET/MRI for prostate
cancer imaging
Thomas de Perrot&Olivier Rager&Max Scheffler&
Martin Lord&Marc Pusztaszeri&Christophe Iselin&
Osman Ratib&Jean-Paul Vallee
Received: 9 January 2014 / Accepted: 15 April 2014 / Published online: 20 May 2014 # Springer-Verlag Berlin Heidelberg 2014
Abstract
Purpose To report the first results of hybrid18F-fluorocholine PET/MRI imaging for the detection of prostate cancer. Methods This analysis included 26 consecutive patients scheduled for prostate PET/MRI before radical prostatectomy. The examinations were performed on a hybrid whole-body PET/MRI scanner. The MR acquisitions which included T2-weighted, diffusion-weighted and dynamic contrast-enhanced sequences were followed during the same session by whole-body PET scans. Parametric maps were constructed to mea-sure normalized T2-weighted intensity (nT2), apparent diffu-sion coefficient (ADC), volume transfer constant (Ktrans), ex-travascular extracellular volume fraction (ve) and standardized
uptake values (SUV). With pathology as the gold standard,
ROC curves were calculated using logistic regression for each parameter and for the best combination with and without PET to obtain a MR model versus a PETMR model.
Results Of the 26 patients initially selected, 3 were excluded due to absence of an endorectal coil (2 patients) or prosthesis artefacts (1 patient). In the whole prostate, the area under the curve (AUC) for SUVmax, ADC, nT2, Ktrans and ve were
0.762, 0.756, 0.685, 0.611 and 0.529 with a best threshold at 3.044 for SUVmax and 1.075 × 10⁻³ mm2/s for ADC. The
anatomical distinction between the transition zone and the peripheral zone showed the potential of the adjunctive use of PET. In the peripheral zone, the AUC of 0.893 for the PETMR model was significantly greater (p=0.0402) than the AUC of 0.84 for the MR model only. In the whole prostate, no relevant correlation was observed between ADC and SUVmax. The
SUVmaxwas not affected by the Gleason score.
Conclusion The performance of a hybrid whole-body 18 F-fluorocholine PET/MRI scan in the same session combined with a prostatic MR examination did not interfere with the diagnostic accuracy of the MR sequences. The registration of the PET data and the T2 anatomical MR sequence data allowed precise localization of hypermetabolic foci in the prostate. While in the transition zone the adenomatous hyper-plasia interfered with cancer detection by PET, the quantita-tive analysis tool performed well for cancer detection in the peripheral zone.
Keywords Prostate . Cancer . PET/MRI .18F-Fluorocholine
Introduction
Prostate cancer is one of the four most prevalent cancers together with breast, colon and lung cancers in both the US and Europe [1,2]. In the year 2012, 241,740 new cases of prostate cancer were estimated to have occurred in the US [1]. Thomas de Perrot and Olivier Rager contributed equally to this work.
Electronic supplementary material The online version of this article (doi:10.1007/s00259-014-2786-7) contains supplementary material, which is available to authorized users.
T. de Perrot (*)
:
M. Scheffler:
J.<P. ValleeDivision of Radiology, Geneva University Hospitals and University of Geneva, Rue Gabrielle-Perret-Gentil 4, 1211 Genève 14, Switzerland
e-mail: thomas.deperrot@hcuge.ch O. Rager
:
O. RatibDivision of Nuclear Medicine, Geneva University Hospitals, Geneva, Switzerland
M. Lord
Division of Nuclear Medicine, University of Montreal Hospital Center, Montréal, Canada
M. Pusztaszeri
Division of Clinical Pathology, Geneva University Hospitals, Geneva, Switzerland
C. Iselin
Division of Urologic Surgery, Geneva University Hospitals, Geneva, Switzerland
Imaging of the prostate constitutes an increasing part in the diagnostic work-up and therapy planning for both local and disseminated disease. MRI is currently considered to be the standard imaging modality for evaluating prostate cancer. T2-weighted sequences are used to image the precise anatomy of the normal and tumoral prostate, and the reported sensitivities and specificities of MRI in the detection of prostate cancer vary widely (47.8– 88.2 % and 44.3 – 81 %, respectively) [3]. Imaging prostate cancer remains challenging and multiparametric MRI with spectroscopy, diffusion-weighted imaging, and dynamic contrast-enhanced MRI, has gained acceptance to complement T2-weighted MRI for prostate cancer detection and grading [4,5].
PET with11C-labelled and18F-labelled choline derivatives has been used successfully for investigating rising prostate-specific antigen (PSA) after prostatectomy [6–9], and for initial staging before surgery [10–14] and radiation therapy. The routine use of PET/CT for prostate cancer detection is still controversial due to the technical limitations of PET (limited spatial resolution and partial volume effect) and to limited diagnostic accuracy of the tracer [15,16]. However, none of the previous studies used the“zonal” anatomy of the prostate because the CT images did not allow adequate differentiation of the peripheral zone (PZ) and transition zone (TZ). It is well established that metabolic activity as assessed by PET over-laps between TZ hyperplasia and cancer. Hence, the question arose as to whether associating metabolic data with a high-resolution technique such as MRI might potentially enhance accuracy in prostate cancer imaging. Preliminary studies using both modalities separately have provided inconsistent results that could be explained in part by the difficulty in achieving accurate registration of the PET and MR images [17,18]. To address this issue, hybrid PET/MRI systems have been de-signed to allow PET and MRI acquisitions during a single examination with a common patient position. We report here the first results of 18F-fluorocholine PET/MRI of prostate cancer in terms of examination feasibility and diagnostic accuracy. The analysis was focused on the prostatic gland and compared the diagnostic performance of combined PET/ MRI with that of multiparametric MRI alone.
Materials and methods Patients
All consecutive patients scheduled for radical prostatectomy as well as combined PET and MRI examination between February 2010 and October 2011 were selected. The study protocol was approved by the Institutional Review Board of the Geneva University Hospitals. All patients provided written informed consent to the use of18F-fluorocholine as an unreg-istered radiopharmaceutical that was authorized for each
patient by the Swiss federal authorities (Swissmedic and Fed-eral Office of Public Health, Section of Radioprotection).
The PET/MRI hybrid system
All PET/MRI scans were performed on a whole-body hybrid PET/MRI system (Philips Ingenuity, Philips Healthcare, Cleveland, OH) which provides a solution to previously de-scribed technical issues in combining MR findings with PET data [19]. The PET part of the hybrid system, a Philips Gemini time-of-flight PET scanner, was combined with a Philips Achieva 3.0-T X-series MRI scanner. The MRI-based attenu-ation correction procedure has recently been described [20]. The PET and MRI scanners are separated by 4.2 m and located on each side of a rotating table allowing the patient to be moved sequentially from one scanner to the other. Alignment between the MR and PET scanner was periodically calibrated by the service engineering team. A dedicated phantom con-taining six22Na point sources spatially distributed in the three spatial directions was used to verify that the distance between the centroids of the point sources seen in MR and PET images was less than 1 mm.
PET acquisition
The radiotracer doses were obtained from a commercial pro-vider (Advanced Accelerator Applications, Saint-Genis-Pouilly, France). Patients were requested to void before the start of imaging. Patients underwent a continuous list-mode PET acquisition of the pelvis over 10 min which was started immediately after injection of 300 MBq (8.11 µCi). Following the list-mode acquisition, a standard whole-body PET study was performed from the mid-thigh to the skull with seven or eight bed positions of 4 min each depending on patient size and weight according to the Steiner protocol [6]. The sinogram data were corrected for dead time, decay and photon attenuation, and were reconstructed on a 256×256 matrix with 4-mm slice thickness. Image reconstruction followed a fully three-dimensional maximum-likelihood ordered-subsets ex-pectation maximum algorithm incorporating random and scat-ter correction with two iscat-terations and 28 subsets. The final in-plane full-width at half-maximum of the system was 6 mm. The whole-body MRI scan was segmented and used to create an attenuation map to correct the PET images. In PET/MRI, attenuation correction is less straightforward than in PET/CT where the CT scan can be directly converted to an electronic density map. Since MRI depicts proton density, weighted by T1 and T2 relaxation parameters, the attenuation map is obtained by segmenting the whole-body T1-weighted MR images into three compartments, air, lung and tissue, which are each assigned a different attenuation factor [20].
MRI acquisition
The MR acquisition was a two-step process. First, pelvic T2 turbo spin echo (T2 TSE) sequences were acquired with an endorectal coil combined with an external cardiac six-array coil in the sagittal and axial planes in a 2-D method with the following parameters: TR 4,000 ms, TE 120 ms, number of signal averages (NSA) 2, slice thickness 3 mm, echo train length 20, matrix 328/290 for the sagittal acquisition and 432/ 386 for the axial acquisition, and field of view (FOV) 22 cm. The endorectal coil was then removed and the acquisitions were continued with only the external cardiac six-array coil in place. A diffusion sequence was acquired on the prostate (TR 3,644 ms, TE 66 ms, slice thickness 3 mm, NSA 4, FOV 200 mm, and matrix 88/79) with four b-values (0, 500, 1,000, 1,500 s/mm2). A 3-D pelvic acquisition was performed with a 3-D fast spin echo MR sequence with TR 2,000 ms, TE 243 ms, NSA 1, slice thickness 1 mm, matrix 392/448/125, and FOV 390 mm. At this time an intravenous bolus of 0.1 mmol/kg gadoterate dimeglumine (Dotarem®), a para-magnetic gadolinium-containing contrast agent, was adminis-tered. Perfusion consisted of a multiframe 3-D T1-weighted fat-saturated gradient echo MR sequence with TR 6.9 ms, TE 3.4 ms, matrix 192/189, FOV 210 mm, slice thickness 3 mm, and acquisition time 5 min. Finally, the entire abdomen was examined for lymph nodes in five batches of a 3-D gradient echo T1-weighted fat-saturated MR sequence with TR 3 ms, TE 1.4 ms, matrix 228/227, FOV 375 mm, 30 slices, and slice thickness 6 mm. Before injection of the contrast agent, the whole-body attenuation correction axial fast field echo MR sequence was acquired with the body coil from head to thighs with TR 4.1 ms, TE 2.3 ms, slice thickness 6 mm, matrix 200/ 200, and FOV 600 mm. The duration of the whole examina-tion was assessed with the archiving system providing the time of acquisition for each sequence.
Data processing
Postprocessing was applied to the MRI acquisitions to obtain apparent diffusion coefficient (ADC) and pharmacokinetic maps. ADC maps were obtained from monoexponential fitting of the diffusion weighted sequences at b 0, 500, 1,000 and 1,500 s/mm2with the Osirix plugin ADCmap version 1.5. Volume transfer constants (Ktrans) and extravascular extracel-lular volume fractions (ve) were calculated from the dynamic
contrast enhanced MRI scans using an extended Kety model (a single-compartment model with extravascular correction) and a predefined arterial input function [21]. This function was taken from the literature based on data published by Fritz-Hansen et al. [22]. All fitting was performed using an in-house routine based on the R package dcemriS4, a package for medical image analysis developed by Whitcher and Schmid to perform voxel-wise quantitative analysis of dynamic
contrast-enhanced MRI scans (available from
http://www.r-project.org) [23,24]. Before generating the pharmacokinetic
maps, data were converted to concentration values according to the equation C(t)=(1/R1 × T10) * (S(t)− S(0))/S(0), where R1 is the in vivo relaxivity at 3.5 L·mmol−1·s−1[25], T10 is the T1 of the prostatic tissue at 3 T before contrast agent injection, set to a value at 1,597 ms obtained from published data [26]; S(t) is the voxel signal as a function of time, and S(0) is the average of the baseline signal images. The procedure generating the pharmacokinetic maps was then applied. The fitting results must converge and vemust be included between
0 and 1 with respect to its significance.
PET/MRI analysis and parameters measurement
All PET and MRI images were analysed with dedicated soft-ware (OsirixMD; Pixmeo SARL, Bernex, Switzerland). The endorectal T2 sequences, diffusion maps and pharmacokinetic maps were interpreted in consensus by two radiologists blinded to the PET results and the clinical data. The different sequences in all patients were analysed independently in a random order. The whole-body PET scans corrected for atten-uation merged with the T2 sequences were interpreted by a nuclear medicine physician experienced in prostate imaging unaware of the other MRI results and the clinical data.
The analyses were performed using an eight-segment sub-division of the prostate. For the PZ, the subsub-division included three levels: the base, the midgland, and the apex on both the right and left sides. For the TZ, the subdivision included the right or left side without level subdivision (Fig.1). For each sequence, a quantitative parameter was measured in all the segments of the prostate by drawing freehand a region of interest (ROI) either in a suspected lesion or in the background activity within the segment if no lesion was detected. When a tumoral lesion involved several segments, the measurement was performed inside the main part of the lesion. In affected adjacent segments, additional lesions were measured only if clearly separated from the first one or if more than 50 % of the segment was involved; otherwise the measurements were made in the background activity. One parameter was mea-sured for each sequence. For the T2-weighted sequences, the intensity was reported for the axial sections. A normalized T2 (nT2) was obtained using the signal of a normal hyperintense T2 prostate region in the PZ. The diffusion-weighted se-quences and dynamic contrast-enhanced imaging provided the ADC and the pharmacokinetic parameters, Ktransand ve,
from the corresponding colour-coded map. Maximum SUV values (SUVmax) of the PET scans were obtained from the
whole-body acquisitions after attenuation correction and a freehand ROI had been drawn in the axial plane after fusion of the PET images with pelvic 3-D T2 sequences to ensure the correct anatomical position of the ROI in the different pros-tatic segments.
Histopathological analysis
After radical prostatectomy, each specimen was fixed in 4 % buffered formalin for at least 24 h. The prostate glands were cut into axial sections from base to apex in a plane perpendic-ular to the long axis of the prostate that was also used as reference for the axial plane in the PET and MR imaging [16]. Sections were approximately 4 mm thick. The number of sections varied between four and seven depending on the dimensions of the prostatectomy specimen. Macroscopic pic-tures of each section were taken. Whole-mount sections were then completely embedded in paraffin blocks. Extra large glass slides were prepared, stained with haematoxylin-eosin and evaluated for the presence and grade of cancer. Foci of cancer were marked on each slide using a fine indelible marker pen. The pathologist was kept unaware of the imaging findings. For exact correlation of histopathology with the imaging findings, the slides from the whole-mount step sec-tions were digitized using a commercially available scanner; slides were arranged from the base to the apex according to the radiological images. The histological slides were analysed to establish the gold standard. The same eight-segment subdivi-sion of the prostate previously defined for the imaging data was applied to these sections. Each of the eight segments was assigned as normal or tumoral. For large tumours invading two or more segments, the segment with the largest part of the tumour was always considered tumoral. Contiguous segments were considered tumoral when the tumour extended to more than 50 % of the section area according to the same method used for imaging assessment. Microfoci of tumour of less than 3 mm in diameter were not considered. Sectors with intraepithelial neoplasia (PIN) were scored as normal. Prostate segments were then compared between imaging and histology.
Statistical analysis
The PET and MRI parameters were compared between normal and tumoral values using the nonparametric Wilcoxon rank
sum test. For each parameter, a receiver operating character-istic (ROC) curve was computed and the area under the curve (AUC) measured. The performance of the parameters was compared using a unilateral test based on bootstrapping for statistical significance. The cut-off values were obtained from the ROC curves as the points closest to the top-left corner. In order to compare the performance of MR examination alone (MR model), combination of MR and PET (PETMR model), a multivariate logistic regression model was built after stepwise parameter selection based on Akaike’s information criterion (AIC) which was used as a measure of the fit of the model. A stepwise procedure was applied by sequentially adding the parameters to achieve the best model (a parameter was added to the model if the AIC obtained was lower). For the selected parameters, the generalized estimating equations (GEE) were used to compute the correct p values for the regression coef-ficients in order to consider the clustered measured data within each patient. The AUC for each model was calculated and compared using a unilateral test of significance based on Delong’s method. The sensitivity and specificity of each mod-el were obtained from the ROC curves as the points closest to the top-left corner. Using all normal and tumoral segments, correlations between pairs of imaging parameters were exam-ined with Spearman's correlation coefficient. The effect of Gleason score on the parameters was assessed using one-way analysis of variance. All statistical analyses were per-formed using the R statistical environment version 2.15 (avail-able from http://www.r-project.org/). The package geepack was used to perform the GEE and the package pROC to compute the ROC curves [27]. For all the tests, the significance level was fixed at 0.05.
Results
Patients and histological results
A total of 26 patients underwent radical prostatectomy after a PET/MRI examination. Although all the examinations were of Fig. 1 Prostate division into eight segments respecting the zonal
anato-my. For the peripheral zone (light grey), the prostate was separated into the left and right side in the base (segments 1 and 2), the midgland
(segments 3 and 4) and the apex (segments 5 and 6). For the transition zone (dark grey), the prostate was divided into two segments including the right and left side without level subdivision (segments 7 and 8)
diagnostic quality, three patients were excluded from the study because of incomplete data due to refusal of the endorectal coil (two patients) or artefacts induced by a hip prosthesis (one patient). Thus, 23 patients were enrolled in the study (median age 64 years, range 47– 75 years). In the resected prostate glands, Gleason grade 3+4 was predominant (9 of 23 patients, 39 %) followed by grade 4+3 (6, 26 %), grade 4+5 (6, 26 %) and grade 3+3 (2, 8 %). There was microscopic evidence of high-grade PIN (HGPIN) in 65 % of patients (15 of 23). In one patient, there was a significant amount of HGPIN in the prostatic gland with several confluent foci of HGPIN measur-ing up to 1 cm in largest diameter, distant and separated from the adenocarcinoma location. In all other patients, HGPIN was either admixed with the adenocarcinoma as a minor component of the tumour (less than 10 %), or present as microfoci elsewhere in the prostate. Cancer was present in the PZ in 17of 23 patients (74 %) and in the TZ in 11 patients (48 %), while 6 patients (26 %) had tumour in both zones. By histomorphometric analysis, tumour volume (median 3.2 cm3, range 0.23 – 29.1 cm3) and prostate volume (median 41.1 cm3; range 23.6 – 88.7 cm3) were assessed in each patient. A total of 184 prostatic segments were analysed in the 23 patients, with 46 segments in the TZ and 138 in the PZ. Among all the 184 segments, 53 (29 %) were positive for tumour according to our histological gold standard with 41 of 138 (30 %) in the PZ and 12 of 46 (26 %) in the TZ. Image quality
All patients underwent the complete examination including both PET and MRI acquisitions in a single session without any noticeable discomfort and with median duration of 121 min (range 67– 167 min). Both PET and MRI examinations were of diagnostic quality without any degradation related to the hybrid system. A representative example of prostate PET/ MRI demonstrating image quality is shown in Fig. 2; the video of the same case is available in theElectronic
supple-mentary materialand shows the lesion in the left apex of the
PZ (indicated by an arrow) and the metabolic activity of the TZ (indicated by asterisks). In addition to the phantom regis-tration procedure periodically performed, the quality of the registration between the two modalities was assessed by visual analysis of the merged images obtained from the MR and PET acquisitions. Use of the endorectal T2-weighted images and the whole-body PET images for registration was not possible due to the elastic deformation and anterior shift of the prostate induced by the inflated coil balloon. The 3-D Vista MR images (acquired without the endorectal coil) and whole-body PET registration procedure was excellent and was very easy without the need for elastic deformation correction. Using the pelvic bone as a landmark, considered a fixed structure not mobilized by breathing, digestive motility or bladder filling, a slight (1– 3.5 mm) translation in the axial
plane in seven patients (30 %) and a moderate translation (3.5– 7 mm) in eight patients (35 %) with no shift in the z-axis were manually corrected.
PET and MRI univariate analysis
Statistics regarding the whole prostate, the PZ and the TZ are summarized in Table1with the corresponding AUCs of the ROCs curve in Table2. For the whole prostate (PZ+TZ), the best AUC was obtained with SUVmaxand ADC, followed by
nT2, Ktrans and ve. No significant difference was observed
between the SUVmax AUC and the ADC AUC (p=0.45).
However, the SUVmax AUC significantly differed from the
nT2 (p=0.03), Ktrans (p<0.001) and ve (p<0.001) AUCs.
From the ROC curves, the best cut-off values for the diagnos-tic accuracy of ADC and SUVmaxwere, respectively, 1.075
×10−3 mm2/s and 3.044. The PZ demonstrated the same behaviour as the whole prostate with the best AUC obtained with SUVmaxand ADC (Fig.3). In the TZ, such a relationship
was not present. SUVmax and Ktranseven showed an AUC
lower than 0.5 as a result of the presence of benign hypervascular and hypermetabolic hyperplastic nodules with SUVmaxand Ktransvalues higher than tumoral values (Table1).
As a consequence, it was not possible to compute an optimal threshold for the TZ SUVmax.
MR versus PET/MRI multivariate analysis
The data in the multivariate analysis are shown in the Tables3 and 4. For the whole prostate gland, the statistical analysis using the stepwise procedure in the logistic regression showed that ADC, veand nT2 were the best parameters for the
MR-only model (the AICs were 223, 191, 185, 184.5 and 184.8 for the starting model, model+ADC, model ADC+ve, model
ADC+ve+nT2 and model ADC+ve+nT2+Ktrans,
respective-ly), and that ADC, veand SUVmaxwere the best parameters
for the PETMR model (the AICs were 223, 191, 179, 173, 174 and 175 for the starting model, model+ADC, model ADC+ SUVmax, model ADC + SUVmax + ve, model ADC +
SUVmax+ve+K trans
and model ADC+SUVmax+ve+nT2,
respectively). Fitting both models using the GEE showed significant regression coefficients for ADC, veand SUVmax.
However, the AUC of the PETMR model ROC curve was not significantly improved by the addition of PET in comparison with the MR model.
For the TZ, the same analysis showed that veand ADC
were the best parameters for the MR only model (the AICs were 54.8, 53, 50, 51.9 and 52 for the starting model, model+ ADC, model ADC+ve, model ADC+ve+Ktrans and model
ADC+ve+nT2, respectively ), with significant coefficients
after fitting the model by GEE. However, in the PETMR model, SUVmaxwas not selected by the stepwise procedure,
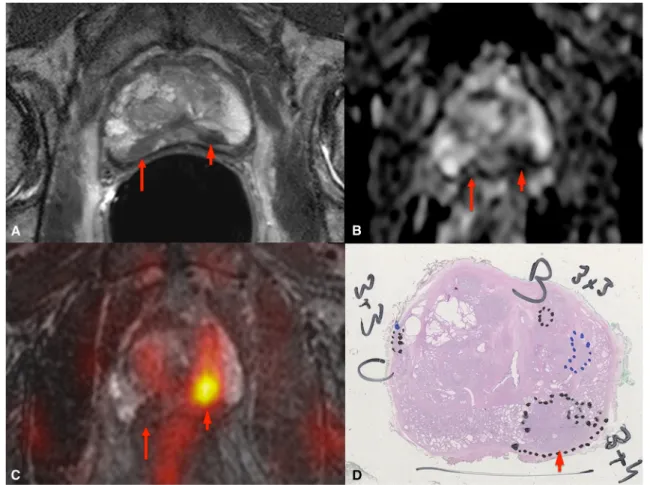
Fig. 2 18F-Fluorocholine prostate PET/MR imaging in a 71-year-old patient (PSA 6.26 ng/ml, Gleason score 7): a T2-weighted axial image with endorectal coil, b ADC map, c coregistered image from the MR 3-D T2-weighted axial and colour-coded PET acquisitions, d H&E-stained histology section. In the PZ of the left apex, a focus is well-defined on the T2-weighted image and the ADC map and is seen as a hypermetabolic focus on the coregistered image (short arrows). This lesion was well
depicted by all modalities with a strong correlation between the PET and MRI data and confirmed by histology. However, in the right apex, another suspicious lesion is apparent on the T2-weighted image and the ADC map (long arrows), but no right apical lesion was visible on the PET acquisition, failing to confirm the MR-based suspicion. The correspond-ing histology section shows normal tissue at this position
Table 1 Imaging parameters
Zone Parameter Normal region, median (range) Tumoral region, median (range) p valuea
PZ+TZ nT2 0.7372 (0.3372– 1.116) 0.5579 (0.2865– 1.005) 8.686 × 10⁻⁵ ADC (× 10−3mm2/s) 1.241 (0.484– 1.829) 0.994 (0.448– 1.481) 5.783 × 10⁻⁸ Ktrans(1/min) 0.0693 (0.0264– 0.195) 0.0909 (0.0363– 0.191) 0.01844 ve 0.1759 (0.0426– 0.423) 0.1714 (0.0787– 0.304) 0.545 SUVmax 2.3 (1.2– 6.5) 3.711 (1.234– 9.4) 2.792 × 10⁻⁸ TZ nT2 0.534 (0.437– 0.766) 0.527 (0.35– 0.739) 0.7766 ADC (× 10−3mm2/s) 1.127 (0.540– 1.343) 0.975 (0.5858– 1.298) 0.1381 Ktrans(1/min) 0.123 (0.0268– 0.195) 0.096 (0.0608– 0.191) 0.1751 ve 0.215 (0.116– 0.35) 0.171 (0.0952– 0.304) 0.1018 SUVmax 4.35 (2.02– 6.5) 3.66 (2.54– 6.7) 0.4604 PZ nT2 0.83 (0.337– 1.12) 0.583 (0.286– 1.01) 3.033 × 10⁻⁶ ADC (× 10−3mm2/s) 1.282 (0.4841– 1.829) 0.9946 (0.4483– 1.481) 4.388 × 10⁻⁸ Ktrans(1/min) 0.0619 (0.0264– 0.146) 0.0899 (0.0363– 0.161) 0.000435 ve 0.165 (0.0426– 0.423) 0.171 (0.0787– 0.302) 0.6148 SUVmax 2.1 (1.2– 5.5) 3.8 (1.23– 9.4) 3.647 × 10⁻¹¹ a
without change in the AUC of the ROC curve (the AICs were 54.8, 53, 50, 51.2, 51.9 and 52 for the starting model, model+ ADC, model ADC+ve, model ADC+ve+SUVmax, model
ADC+ve+Ktransand model ADC+ve+nT2, respectively).
For the PZ, the selected parameters for the MR model were the nT2, ADC, Ktransand vewith significant regression
coef-ficients for the three last (the AICs were 170, 138, 134, 128 and 127 for the starting model, model+ADC, model ADC+
Ktrans, model ADC+Ktrans+ve and model ADC+Ktrans+ve+
nT2, respectively). For the PETMR model, only the ADC and SUVmax parameters were retained as the covariates of the
model with significant p values after fitting by GEE (the AICs were 170, 110, 102, 104, 104 and 104 for the starting model, model+SUVmax, model SUVmax+ADC, model SUVmax+ ADC + nT2, model SUVmax + ADC + Ktrans and model SUVmax+ADC+ve, respectively). In the PZ, the addition of
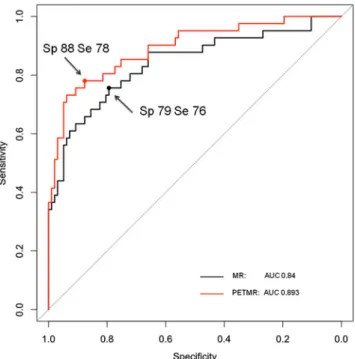
PET led to a significant improvement in the AUCs of the ROC curves. As inferred from the ROC curves and as shown in Table 4, the best sensitivity and specificity were 76 % and 79 % for the MR model versus 78 % and 88 % for the PETMR model (Fig.4). The specificities for both the MR and PETMR models were highest in the PZ and lowest in the TZ (Table4).
Table5 shows the sensitivity, specificity and accuracy of the two best-performing parameters (ADC and SUVmax) as
well as of the MR and PETMR examinations. In terms of accuracy and specificity, SUVmax and PETMR performed better in the PZ alone than in the whole prostate. The TZ is a predilection site for benign pathology such as adenomatous hyperplasia that may cause false-positive leading to a decrease in PET specificity. However, the false-negative rate and sen-sitivity were not improved in the PZ by comparison to the whole prostate as the detection of tumoral foci was limited by low tumoral avidity or by PET spatial resolution and the related partial volume effects.
Correlation among imaging parameters and analysis of the Gleason score
The correlations among the imaging parameters for all pros-tatic segments are shown in Table 6. All coefficients in Table 2 AUC of the ROC curve for each parameter
Zone Parameter AUC 95 % confidence interval Threshold Sensitivity (%) Specificity (%)
PZ+TZ nT2 0.685 0.6023– 0.7677 ADC (× 10−3mm2/s) 0.756 0.679– 0.832 1.075 58.4 78.6 Ktrans(1/min) 0.611 0.522– 0.7 ve 0.529 0.438– 0.619 SUVmax 0.762 0.685– 0.838 3.044 75.5 73.3 TZ nT2 0.529 0.304– 0.755 ADC (× 10−3mm2/s) 0.647 0.439– 0.855 0.899 50.0 91.2 Ktrans(1/min) 0.365 (<0.5) 0.164– 0.567 ve 0.662 0.462– 0.861 SUVmax 0.426 (<0.5) 0.219– 0.634 NA NA NA PZ nT2 0.752 0.662– 0.842 ADC (× 10−3mm2/s) 0.796 0.715– 0.876 1.190 73.2 70.1 Ktrans(1/min) 0.69 0.586– 0.794 ve 0.473 (<0.5) 0.369– 0.576 SUVmax 0.857 0.774– 0.94 2.882 75.6 91.8 NA not applicable
Fig. 3 ROC curves for each imaging parameter obtained in the PZ of the prostate. The diagnostic accuracy was measured in terms of the AUC shown in the bottom-right of the figure in decreasing order. The best parameter corresponds to SUVmaxwith the highest AUC
absolute values were lower than 0.6 with a coefficient of −0.425 between the SUVmax and ADC. Three levels of
Gleason score were considered: 3+4 (26 positive segments), 4+3 (positive segments) and 4+5 (18 positive segments). Gleason scores 4+4 and 3+3 were not considered (1 or 2 positive segments). The Gleason score had a significant effect on ADC (p=0.037) and nT2 (p=0.037). The other parameters did not differ significantly (SUVmax p=0.2032, K
trans
p= 0.505, vep=0.9231)
Discussion
This study demonstrated the feasibility of hybrid PET/MRI scans in prostate cancer detection by the high rate of success-ful examinations. All patients tolerated well the examination time with a median of 121 min. The images were all of diagnostic quality even in the three patients excluded from the study because of missing imaging series preventing their inclusion in the statistical analysis. In particular, we did not notice any image degradation of either the PET and MR images that could have been caused by the closeness of the PET and the MR systems in the same room [19]. We also investigated the value of hybrid PET/MRI in prostate cancer detection. The separate results obtained from the PET or MRI data alone were in agreement with those in the literature. For the whole prostate, the MR parameter with the highest
diagnostic efficiency was ADC, followed by nT2, Ktransand finally ve, in agreement with the findings of previous studies
[28, 29]. The ADC values in the PZ and in the TZ were different, as previously reported [30]. In our study, the AUCs from the ADC curves were 0.796 for the PZ and 0.647 for the TZ; these values are lower than those found in a previous study by Kitajima et al. (AUC 0.937 in the PZ and 0.889 in the TZ with b-values of 0 – 2,000 s/mm2) [31]. This difference can be explained by a difference in the methodology. In our study, microfoci were considered <3 mm versus 5 mm in the study by Kitajima et al. and the ROIs for the measurements were placed blinded to the histological slides, in contrast to the study by Kitajima et al. The PET results were also in agree-ment with those of previously published studies. Our SUVmax
cut-off of 3.044 found to give the best accuracy of PET was consistent with the value of 2.7 reported previously for11 C-Table 3 Regression coefficients in the MR and PETMR multivariate logistic models (fitted using GEE)
Zone Model nT2 ADC Ktrans ve SUVmax
PZ+TZ MR −1.75 (p=0.0885) −4.14 (p=0.0024) –a −9.55 (p=0.0013) Not included PETMR –a −3.97 (p=0.00187) –a −9.80291 (p=0.00041) 0.45033 (p=0.00054) TZ MR –a −4.19 (p=0.00229) –a −15.14549 (p=0.00734) Not included PETMR –a −4.19 (p=0.00229) –a −15.14549 (p=0.00734) –a PZ MR −2.39 (p=0.0378) −3.47 (p=0.0255) 30.51 (p=0.0111) −11.68 (p=0.0013) Not included PETMR –a −3.21 (p=0.02166) –a –a 1.30094 (p=0.00028) a
Not selected by stepwise forward procedure for the MR model or the PETMR model
Table 4 Diagnostic accuracy of the MR and PETMR multivariate logis-tic models. The p values comparing the AUCs of the two models were obtained from the parameters shown in Table5. The diagnostic accuracies were deduced from the ROC curve as the points closest to the top-left corner
Zone Model AUC p value Sensitivity (%) Specificity (%)
PZ+TZ MR 0.795 0.1021 66.0 85.5 PETMR 0.817 79.2 69.5 TZ MR 0.75 0.5 83.3 58.8 PETMR 0.75 83.3 58.8 PZ MR 0.84 0.0402 75.6 79.4 PETMR 0.893 78.0 87.6
Fig. 4 ROC curves for the MR model and PETMR model for the PZ. The two points indicated by the arrows correspond to the best cut-off values and are the points closest to the top-left corner. The PETMR model curve is to the left of the MR model curve indicating diagnostic improve-ment achieved by combining MR imaging with PET. The AUC for each curve is shown in the bottom-right (Sp specificity, Se sensitivity)
choline [18]. Finally, in a study in 33 patients using biopsy as the gold standard, Jambor et al. found an improvement in specificity when using PET/CT and MRI registered data [17]. The results of that study converge towards our results for the PZ of the prostate showing an improvement in the ROC curve for the PZ.
The potential of hybrid PET/MRI in prostate cancer detec-tion was investigated by considering the combined informa-tion from both PET and MRI data. Hybrid PET/MRI allowed optimal conditions for the registration of the two modalities to be obtained. In addition to the absence of radiation associated with CT, hybrid PET/MRI allowed reliable acquisition of both PET and MRI data in a single session to ease patient manage-ment. In our study, registration of PET and MR could be performed accurately under stable conditions: pelvic tilt did not change during the examination since the patient did not need to move from one scanner table to another, and rectal filling was equal thus avoiding modification of the prostate position as a result of differences in distension. We also asked the patients to void before the examination to minimize chang-es in bladder volume. Thchang-ese factors avoided elastic and non-linear image deformation and allowed optimal conditions for image registration and accurate analysis of the anatomical zones of the prostate. Regarding the literature, previous stud-ies have been performed using two separate imaging sessions for PET/CT and MRI, and the conditions for registration could not be as close as those obtained in a single session [17,18, 32]. In a large study including 49 patients scheduled for radical prostatectomy Van den Bergh et al. compared the results of11C-choline PET/CT and T2-weighted MRI of the
prostate [18] and concluded that the value of11C-choline PET/ CT in addition to T2-weighted MRI was limited. In our study, the addition of PET to MRI led to an improvement in the ROC curve in the PZ. The main factor that could explain these different results is that in the study by Van den Bergh et al. PET/CT and MRI were registered using a rigid body algo-rithm that poorly corrected for deformation of the prostate resulting from differences in pelvic position during the two imaging sessions.
As there is an overlap in SUVmaxbetween TZ hyperplasia
and cancer [33], we strongly believe that different analyses should be applied to PET data originating from the PZ and from the TZ. The results presented in Table5emphasize the importance of respecting prostatic zonal anatomy in the anal-ysis of a hypermetabolic focus. The PZ thickness may be reduced in patients with benign prostate hyperplasia and may result in false-positive findings on PET/CT examination in which zonal differentiation is not possible due to poor soft tissue contrast on CT images. For this reason, there is an advantage in the use of hybrid PET/MRI compared with PET/CT. In our experience, fusion of PET and MR Vista 3-D data improved ROI positioning within the PZ and the TZ allowing an accurate metabolic value to be obtained. Previous studies were performed without anatomical zone delineation of the prostate but with arbitrary regional divisions that did not consider the metabolic and functional differences within the prostate. For example, in the large study by Van den Bergh et al. including 49 patients, an octant division of the prostate was used without differentiating the TZ and the PZ [18]. Such analysis may not be able to show the additional value of PET with MRI.
While in this study the MR regression model showed that all functional parameters (i.e. ADC, Ktransand ve) provided
diagnostic accuracy in the PZ, the best-performing parameters in the PETMR model were SUVmaxand ADC. The parameter
selection procedure in the logistic regression model demon-strated that these two parameters were the most relevant. However, our current study did not show a strong correlation between ADC and SUVmax(correlation coefficient −0.425),
indicating that these two parameters are independent Table 5 Sensitivity, specificity and accuracy of the two best-performing
parameters and for the MR and PETMR examinations. Considering the peripheral zone alone in contrast with the whole prostate, the addition of
PET improves the performance mostly in terms of accuracy and specific-ity, showing the value of segmenting the prostate according to the zonal anatomy
Whole prostate Peripheral zone
Sensitivity (%) Specificity (%) Accuracy (%) Sensitivity (%) Specificity (%) Accuracy (%)
ADC 58 79 69 73 70 72
SUVmax 76 73 75 76 92 84
MR 66 86 76 76 79 78
PETMR 79 70 75 78 88 83
Table 6 Spearman's rank correlation matrix for the imaging parameters nT2 ADC Ktrans ve SUVmax
nT2 1 0.563 −0.354 −0.192 −0.507
ADC 1 −0.394 −0.319 −0.425
Ktrans 1 0.541 0.572
ve 1 0.119
biomarkers in prostate cancer. Correlation with Gleason scores demonstrated the different behaviour of these two parameters. While in our study the Gleason score significantly affected ADC (p=0.0027), SUVmaxdid not change
signifi-cantly (p=0.355) as previously demonstrated [34,35].18 F-Choline uptake provides metabolic information based on incorporation of phosphatidyl choline in proliferating cell membrane while ADC is a functional biomarker based on the assessment of random (brownian) motion of extracellular water molecules. Also, the relationship between ADC and Gleason score [36–38] and the rela-tionship between perfusion parameters and microvascu-lature are well established [39], whereas the correlation between ADC and cellularity remains controversial [40, 41]. In addition, our study demonstrated the role of ve.
As a single parameter, the information it provided was of little value with the AUC of the ROC curve of only 0.529. However, the parameter helped classify lesions when used in combination with other parameters and was a significant covariate in the logistic regression. This is an interesting observation as the importance of ve is still the subject of debate in the literature [28, 42].
In the multivariate logistic regression, the parameter showed a negative coefficient; this is concordant with the significance of the parameter as a measure of the extravascular extracellular space fractional volume and thus “as marker of cellular density” [43].
The study was performed using a 3-T PET/MRI system allowing sequential acquisition. The system was designed as an arrangement of separate PET and MR scanners placed in the same room and using a common rotating table. Another commercially available concept places both scanners in separate rooms; a mobile table transfers the patient keeping the same position to allow registration between the two modalities. A third ap-proach combines PET and MR systems in a unique gantry. In theory, our results could be extrapolated to such PET/MRI systems allowing simultaneous acquisi-tions of both modalities. However, further studies with this hybrid system should be performed to better eval-uate the performance of such integrated technology. Software coregistration could provide an alternative to multimodal analysis with rigid or nonrigid fusion algo-rithms [44].
Our study questions the role of PET/MRI in the current strategy for prostate cancer detection and staging. Hybrid examination could be used as a second-line imaging method in patients with elevated PSA with negative tumoral findings on repeated biopsies and MR examinations. The PET imaging may lead to improved cancer detection in the PZ when MRI alone does not allow a reliable analysis. Such a situation may be caused by biopsy-induced changes and haemorrhage [45]. Considering the absence of a significant relationship between
the Gleason score and the uptake of18F-fluorocholine, PET/ MRI may also be of value in the evaluation of well-differentiated tumours. This potential needs further investiga-tion in the setting of patient management by active surveil-lance. Furthermore, the value of this hybrid imaging for tumour delineation in planning of dose painting radiation therapy could be assessed [46].
Study limitations
While the reading of the MRI and PET scans was performed blinded and in separate sessions, the reader of PET data had access to the T2-weighted MRI sequence data to differentiate TZ from PZ. Therefore, it was not possible to exclude a bias in the PET data analysis that could have been introduced by the visualization of the T2-weighted sequence data. However, ROC analysis clearly demonstrated that even with this possi-ble bias, the PET data added new information and improved the accuracy of prostate cancer detection in the PZ. Quantita-tive PET data also depend on the accuracy of tissue attenua-tion correcattenua-tion. The method used in our system relied on computer segmentation of different tissue types particularly soft tissue and air-filled structures, assigning a standard atten-uation coefficient to the soft tissues. In the current setting bones are not identified and can be assumed to have the same attenuation coefficient as soft tissue. Some preliminary data and simulations showed that this approximation can lead to variation in body SUVs of up to about 5 %, and especially in bony lesion SUVs of up to 31 % [47]. While this variability may be important in bone assessment, these errors are still acceptable for prostate analysis. Furthermore, accuracy will be increased when work currently in progress developing algo-rithms considering bone are available for attenuation correction.
Conclusion
Acquisition of a whole-body 18F-fluorocholine PET/MRI scan on a hybrid system in a single session with a multiparametric MRI of the prostate was feasible without any compromise in image quality. The distinction between the PZ and TZ proved to be of the utmost importance in prostate analysis. The registration of the PET data with the anatomical T2-weighted MR sequence on the hybrid system led to to precise localization of hypermetabolic foci. In the TZ, adenomatous hyperplasia may lead to false-positive uptake in
18
F-choline and the use of the PET/MRI did not lead to better diagnostic accuracy than MR alone. In the PZ, quantitative and anatomical assessment of hypermetabolic foci in the prostate led to better performance of PET/MRI in detecting prostate cancer than multiparametric MRI. ADC and the SUVmaxwere not strongly correlated biomarkers, suggesting
higher Gleason scores in tumour led to higher ADC but not to higher SUVmax.
Conflicts of interest None.
References
1. Siegel R, Naishadham D, Jemal A. Cancer statistics, 2012. CA Cancer J Clin. 2012;62:10–29. doi:10.3322/caac.20138.
2. Ferlay J, Autier P, Boniol M, Heanue M, Colombet M, Boyle P. Estimates of the cancer incidence and mortality in Europe in 2006. Ann Oncol. 2007;18:581–92. doi:10.1093/annonc/mdl498. 3. Yakar D, Debats OA, Bomers JG, Schouten MG, Vos PC, van Lin E,
et al. Predictive value of MRI in the localization, staging, volume estimation, assessment of aggressiveness, and guidance of radiother-apy and biopsies in prostate cancer. J Magn Reson Imaging. 2012;35: 20–31. doi:10.1002/jmri.22790.
4. Padhani AR. Integrating multiparametric prostate MRI into clinical practice. Cancer Imaging. 2011;11 Spec No A:S27–37. doi:10.1102/ 1470-7330.2011.9007.
5. Schlemmer HP. Prostate cancer: localizing the cancer in patients with persistent negative biopsies. Cancer Imaging. 2011;11 Spec No A:S1. doi:10.1102/1470-7330.2011.9001.
6. Steiner C, Vees H, Zaidi H, Wissmeyer M, Berrebi O, Kossovsky MP, et al. Three-phase 18F-fluorocholine PET/CT in the evaluation of prostate cancer recurrence. Nuklearmedizin Nucl Med. 2009;48: 1–9; quiz N2–3.
7. Krause BJ, Souvatzoglou M, Tuncel M, Herrmann K, Buck AK, Praus C, et al. The detection rate of [11C]choline-PET/CT depends on the serum PSA-value in patients with biochemical recurrence of prostate cancer. Eur J Nucl Med Mol Imaging. 2008;35:18–23. doi:
10.1007/s00259-007-0581-4.
8. Castellucci P, Fuccio C, Nanni C, Santi I, Rizzello A, Lodi F, et al. Influence of trigger PSA and PSA kinetics on 11C-choline PET/CT detection rate in patients with biochemical relapse after radical pros-tatectomy. J Nucl Med. 2009;50:1394–400. doi:10.2967/jnumed. 108.061507.
9. Picchio M, Messa C, Landoni C, Gianolli L, Sironi S, Brioschi M, et al. Value of [11C]choline-positron emission tomography for re-staging prostate cancer: a comparison with [18F]fluorodeoxyglucose-positron emission tomography. J Urol. 2003;169:1337–40. doi:10.1097/01.ju. 0000056901.95996.43.
10. Schmid DT, John H, Zweifel R, Cservenyak T, Westera G, Goerres GW, et al. Fluorocholine PET/CT in patients with prostate cancer: initial experience. Radiology. 2005;235:623–8. doi:10.1148/radiol. 2352040494.
11. Husarik DB, Miralbell R, Dubs M, John H, Giger OT, Gelet A, et al. Evaluation of [(18)F]-choline PET/CT for staging and restaging of prostate cancer. Eur J Nucl Med Mol Imaging. 2008;35:253–63. doi:
10.1007/s00259-007-0552-9.
12. Gutman F, Aflalo-Hazan V, Kerrou K, Montravers F, Grahek D, Talbot JN. 18F-choline PET/CT for initial staging of advanced pros-tate cancer. AJR Am J Roentgenol. 2006;187:W618-21. doi:10.2214/ AJR.05.0437.
13. Schiavina R, Scattoni V, Castellucci P, Picchio M, Corti B, Briganti A, et al. 11C-choline positron emission tomography/computerized tomography for preoperative lymph-node staging in intermediate-risk and high-risk prostate cancer: comparison with clinical staging no-mograms. Eur Urol. 2008;54:392–401. doi:10.1016/j.eururo.2008. 04.030.
14. Beheshti M, Imamovic L, Broinger G, Vali R, Waldenberger P, Stoiber F, et al. 18F choline PET/CT in the preoperative staging of prostate cancer in patients with intermediate or high risk of extracapsular disease: a prospective study of 130 patients. Radiology. 2010;254:925–33. doi:10.1148/radiol.09090413. 15. Farsad M, Schiavina R, Castellucci P, Nanni C, Corti B, Martorana G,
et al. Detection and localization of prostate cancer: correlation of (11)C-choline PET/CT with histopathologic step-section analysis. J Nucl Med. 2005;46:1642–9.
16. Bundschuh RA, Wendl CM, Weirich G, Eiber M, Souvatzoglou M, Treiber U, et al. Tumour volume delineation in prostate cancer assessed by [11C]choline PET/CT: validation with surgical speci-mens. Eur J Nucl Med Mol Imaging. 2013;40:824–31. doi:10.1007/ s00259-013-2345-7.
17. Jambor I, Borra R, Kemppainen J, Lepomaki V, Parkkola R, Dean K, et al. Improved detection of localized prostate cancer using co-registered MRI and (11)C-acetate PET/CT. Eur J Radiol. 2012;81: 2966–72. doi:10.1016/j.ejrad.2011.12.043.
18. Van den Bergh L, Koole M, Isebaert S, Joniau S, Deroose CM, Oyen R, et al. Is there an additional value of (11)C-choline PET-CT to T2-weighted MRI images in the localization of intraprostatic tumor nodules? Int J Radiat Oncol Biol Phys. 2012;83:1486–92. doi:10. 1016/j.ijrobp.2011.10.046.
19. Zaidi H, Ojha N, Morich M, Griesmer J, Hu Z, Maniawski P, et al. Design and performance evaluation of a whole-body Ingenuity TF PET-MRI system. Phys Med Biol. 2011;56:3091–106. doi:10.1088/ 0031-9155/56/10/013.
20. Schulz V, Torres-Espallardo I, Renisch S, Hu Z, Ojha N, Bornert P, et al. Automatic, three-segment, MR-based attenuation correction for whole-body PET/MR data. Eur J Nucl Med Mol Imaging. 2011;38: 138–52. doi:10.1007/s00259-010-1603-1.
21. Tofts PS, Kermode AG. Measurement of the blood–brain barrier permeability and leakage space using dynamic MR imaging. 1. Fundamental concepts. Magn Reson Med. 1991;17:357–67. 22. Fritz-Hansen T, Rostrup E, Larsson HB, Sondergaard L, Ring P,
Henriksen O. Measurement of the arterial concentration of Gd-DTPA using MRI: a step toward quantitative perfusion imaging. Magn Reson Med. 1996;36:225–31.
23. Tabelow K, Clayden JD, de Micheaux PL, Polzehl J, Schmid VJ, Whitcher B. Image analysis and statistical inference in neuroimaging with R. Neuroimage. 2011;55:1686–93. doi:10.1016/j.neuroimage. 2011.01.013.
24. Whitcher B, Schmid VJ. Quantitative analysis of dynamic contrast-enhanced and diffusion-weighted magnetic resonance imaging for oncology in R. J Stat Softw. 2011;44:1–29.
25. Rohrer M, Bauer H, Mintorovitch J, Requardt M, Weinmann HJ. Comparison of magnetic properties of MRI contrast media solutions at different magnetic field strengths. Invest Radiol. 2005;40:715–24. 26. de Bazelaire CM, Duhamel GD, Rofsky NM, Alsop DC. MR imag-ing relaxation times of abdominal and pelvic tissues measured in vivo at 3.0 T: preliminary results. Radiology. 2004;230:652–9. doi:10. 1148/radiol.2303021331.
27. Robin X, Turck N, Hainard A, Tiberti N, Lisacek F, Sanchez JC, et al. pROC: an open-source package for R and S+ to analyze and compare ROC curves. BMC Bioinformatics. 2011;12:77. doi: 10.1186/1471-2105-12-77.
28. Langer DL, van der Kwast TH, Evans AJ, Trachtenberg J, Wilson BC, Haider MA. Prostate cancer detection with multi-parametric MRI: logistic regression analysis of quantitative T2, diffusion-weighted imaging, and dynamic contrast-enhanced MRI. J Magn Reson Imaging. 2009;30:327–34. doi:10.1002/jmri.21824. 29. Miao H, Fukatsu H, Ishigaki T. Prostate cancer detection with 3-T
MRI: comparison of diffusion-weighted and T2-weighted imaging. Eur J Radiol. 2007;61:297–302. doi:10.1016/j.ejrad.2006.10.002. 30. Kim JH, Kim JK, Park BW, Kim N, Cho KS. Apparent diffusion
anatomical region. J Magn Reson Imaging. 2008;28:1173–9. doi:10. 1002/jmri.21513.
31. Kitajima K, Takahashi S, Ueno Y, Yoshikawa T, Ohno Y, Obara M, et al. Clinical utility of apparent diffusion coefficient values obtained using high b-value when diagnosing prostate cancer using 3 tesla MRI: comparison between ultra-high b-value (2000 s/mm2) and standard high b-value (1000 s/mm2). J Magn Reson Imaging . 2012;36:198–205. doi:10.1002/jmri.23627.
32. Park H, Wood D, Hussain H, Meyer CR, Shah RB, Johnson TD, et al. Introducing parametric fusion PET/MRI of primary prostate cancer. J Nucl Med. 2012;53:546–51. doi:10.2967/jnumed.111.091421. 33. Kato T, Tsukamoto E, Kuge Y, Takei T, Shiga T, Shinohara N, et al.
Accumulation of [11C]acetate in normal prostate and benign prostat-ic hyperplasia: comparison with prostate cancer. Eur J Nucl Med Mol Imaging. 2002;29:1492–5. doi:10.1007/s00259-002-0885-3. 34. Woodfield CA, Tung GA, Grand DJ, Pezzullo JA, Machan JT,
Renzulli 2nd JF. Diffusion-weighted MRI of peripheral zone prostate cancer: comparison of tumor apparent diffusion coefficient with Gleason score and percentage of tumor on core biopsy. AJR Am J Roentgenol. 2010;194:W316–22. doi:10.2214/AJR.09.2651. 35. Breeuwsma AJ, Pruim J, Jongen MM, Suurmeijer AJ, Vaalburg W,
Nijman RJ, et al. In vivo uptake of [11C]choline does not correlate with cell proliferation in human prostate cancer. Eur J Nucl Med Mol Imaging. 2005;32:668–73. doi:10.1007/s00259-004-1741-4. 36. Verma S, Rajesh A, Morales H, Lemen L, Bills G, Delworth M, et al.
Assessment of aggressiveness of prostate cancer: correlation of ap-parent diffusion coefficient with histologic grade after radical pros-tatectomy. AJR Am J Roentgenol. 2011;196:374–81. doi:10.2214/ AJR.10.4441.
37. Tan CH, Wang J, Kundra V. Diffusion weighted imaging in prostate cancer. Eur Radiol. 2011;21:593–603. doi: 10.1007/s00330-010-1960-y.
38. Somford DM, Hambrock T, de Kaa CA H-v, Futterer JJ, van Oort IM, van Basten JP, et al. Initial experience with identi-fying high-grade prostate cancer using diffusion-weighted MR imaging (DWI) in patients with a gleason score ≤3 + 3 = 6 upon schematic TRUS-guided biopsy: a radical prostatectomy correlated series. Invest Radiol. 2012;47:153–8. doi:10.1097/ RLI.0b013e31823ea1f0.
39. Ren J, Huan Y, Wang H, Chang YJ, Zhao HT, Ge YL, et al. Dynamic contrast-enhanced MRI of benign prostatic hyperplasia and prostatic carcinoma: correlation with angiogenesis. Clin Radiol. 2008;63:153– 9. doi:10.1016/j.crad.2007.07.023.
40. Gibbs P, Liney GP, Pickles MD, Zelhof B, Rodrigues G, Turnbull LW. Correlation of ADC and T2 measurements with cell density in prostate cancer at 3.0 Tesla. Invest Radiol. 2009;44:572–6. doi:10. 1097/RLI.0b013e3181b4c10e.
41. Jung DC, Lee HJ, Seo JW, Park SY, Lee SJ, Lee JH, et al. Diffusion-weighted imaging of a prostate cancer xenograft model seen on a 7 Tesla animal MR scanner: comparison of ADC values and pathologic findings. Korean J Radiol. 2012;13:82–9. doi:10.3348/kjr.2012.13.1. 82.
42. Futterer JJ, Heijmink SW, Scheenen TW, Veltman J, Huisman HJ, Vos P, et al. Prostate cancer localization with dynamic contrast-enhanced MR imaging and proton MR spectroscopic imaging. Radiology. 2006;241:449–58. doi:10.1148/radiol.2412051866. 43. Oto A, Yang C, Kayhan A, Tretiakova M, Antic T, Schmid-Tannwald
C, et al. Diffusion-weighted and dynamic contrast-enhanced MRI of prostate cancer: correlation of quantitative MR parameters with Gleason score and tumor angiogenesis. AJR Am J Roentgenol. 2011;197:1382–90. doi:10.2214/AJR.11.6861.
44. Reducindo I, Arce-Santana E, Campos-Delgado DU, Vigueras-Gomez F. Non-rigid multimodal image registration based on local variability measures and optical flow. Conf Proc IEEE Eng Med Biol Soc. 2012;2012:1133–6. doi:10.1109/EMBC.2012.6346135. 45. White S, Hricak H, Forstner R, Kurhanewicz J, Vigneron DB,
Zaloudek CJ, et al. Prostate cancer: effect of postbiopsy hemorrhage on interpretation of MR images. Radiology. 1995;195:385–90. doi:
10.1148/radiology.195.2.7724756.
46. Chang JH, Lim Joon D, Lee ST, Gong SJ, Anderson NJ, Scott AM, et al. Intensity modulated radiation therapy dose painting for local-ized prostate cancer using 11C-choline positron emission tomogra-phy scans. Int J Radiat Oncol Biol Phys. 2012;83:e691–6. doi:10. 1016/j.ijrobp.2012.01.087.
47. Akbarzadeh A, Ay MR, Ahmadian A, Riahi Alam N, Zaidi H. MRI-guided attenuation correction in whole-body PET/MR: assessment of the effect of bone attenuation. Ann Nucl Med. 2012;27:152–62. doi: