HAL Id: hal-00318010
https://hal.archives-ouvertes.fr/hal-00318010
Submitted on 22 Nov 2005
HAL is a multi-disciplinary open access
archive for the deposit and dissemination of
sci-entific research documents, whether they are
pub-lished or not. The documents may come from
teaching and research institutions in France or
abroad, or from public or private research centers.
L’archive ouverte pluridisciplinaire HAL, est
destinée au dépôt et à la diffusion de documents
scientifiques de niveau recherche, publiés ou non,
émanant des établissements d’enseignement et de
recherche français ou étrangers, des laboratoires
publics ou privés.
The east-west asymmetry in Coronal Mass Ejections:
evidence for active longitudes
M. Skirgiello
To cite this version:
M. Skirgiello. The east-west asymmetry in Coronal Mass Ejections: evidence for active longitudes.
Annales Geophysicae, European Geosciences Union, 2005, 23 (9), pp.3139-3147. �hal-00318010�
© European Geosciences Union 2005
Geophysicae
The east-west asymmetry in Coronal Mass Ejections: evidence for
active longitudes
M. Skirgiello
Space Research Center of Polish Academy of Sciences, Warsaw, Poland
Received: 4 March 2005 – Revised: 6 October 2005 – Accepted: 31 October 2005 – Published: 22 November 2005 Part of Special Issue “1st European Space Weather Week (ESWW)”
Abstract. Various manifestations of solar activity are not
uniformly distributed with heliographic longitude. By us-ing east-west asymmetry in the occurrence rate of CMEs (coronal mass ejections), the longitudinal dependence in SOHO LASCO 1996–2004 data has been studied in this work. The solar rotation periodicity has been found, indi-cating the presence of active longitudes, whose phase is re-versed twice during the studied period. It is more promi-nent in the Southern Hemisphere. The east-west asymme-try is also present when calculated for longer time periods. Sometimes (particularly during low solar activity), there is an alternation of the eastern and western domination every six months. Taking into account the orbital revolution of the Earth about the Sun, this indicates the existence of enhanced activity, fixed in space (not undergoing Carrington rotation). Moreover, there is about a 3.7% overall excess of western events, lasting for the entire reported time, suggesting some bias in the observations. A hypothesis to explain this phe-nomenon is proposed.
Keywords. Solar physics, astrophysics, and astronomy
(Flares and mass ejections; Stellar interiors and dynamo theory)
1 Introduction
Unequal longitudinal distribution of solar activity has been known for a very long time. It appears that some zones of heliographic longitudes are particularly active. Longitu-dinal distribution of solar activity has been investigated by Trotter and Billings (1962). Bumba and Howard (1969) studied magnetic-field synoptic charts for 27 rotations dur-ing 1977–1979 and postulated the existence of subsurface sources which rotate with a 27-day period and produce a se-quence of many active regions over a longitudinal zone of some tens of degrees. Gaizauskas et al. (1983) found that
Correspondence to: M. Skirgiello
each such complex of activity rotated at its own constant rate. They observed periods from 26.5 to 28 days. The longitu-dinal dependence of severe flares was studied by Haurwitz (1968) and Bai (1987, 2003).
Bogart (1982) used the autocovariance function of the sunspots numbers in 1850–1977. He found evidence for ac-tive longitudes rotating at a period of about 27 days. This period varied by as much as two days between individual so-lar cycles.
Berdyugina and Usoskin (2003) throughly analysed lon-gitudinal dependence of sunspot activity based on the 120-year data (12th to 22nd solar cycle). They showed that there existed two active longitudes separated by 180◦. The two longitudes lag in phase with respect to the Carrington refer-ence frame at a rate of about 2.5 solar rotations per sunspot cycle, on average. The rate is more rapid at the beginning of the solar cycle and slows down towards its end. The mi-gration rate is related to the differential rotation rate at the average latitude of sunspots in a given phase of the solar cy-cle. The two active longitudes change their relative inten-sity at the average period of 3.8 and 3.65 years in the North-ern and SouthNorth-ern Hemispheres, respectively. This so-called “flip-flop” phenomenon is well known in the spot activity of Sun-like stars.
Recently, Vernova et al. (2004) analysed the longitudinal distribution of sunspot activity over a time period comprising about 7 solar cycles (1917–1995). They found an increase in activity around the Carrington longitude of about 180◦for the
ascending phase and maximum, and 0◦ for the descending
phase and minimum.
Many authors investigated the periodicity in the properties of the solar wind (see Neugebauer et al., 2000; Takalo and Mursula, 2002, and references therein). Takalo and Mursula (2002), using an autocovariance function of IMF Bxand By
components, found a “flip-flop” type behavior, with a period of about 3.2 years. They demonstrated that taking this alter-nation into account, the period of 27.6 days is more persis-tent than periods reported previously. It was later discussed in Mursula and Hiltula’s (2004) paper.
3140 M. Skirgiello: The east-west asymmetry in Coronal Mass Ejections
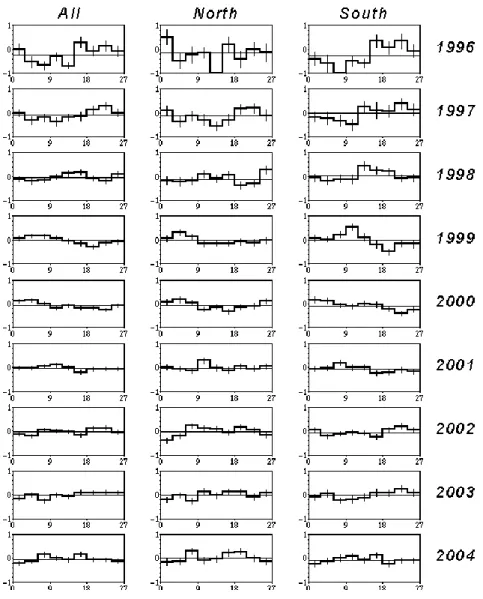
Fig. 1. Superposed epoch distribution of the east-west asymmetry, for 9 years of SOHO LASCO observations. The asymmetry is calculated
in 3-day bins, corresponding to 40◦longitudinal zones. The left panels concern all the data, the middle and right panels are for the Northern and Southern Hemispheres, respectively. Full halo CMEs are excluded. Data for 1998 and 1999 are incomplete due to the SOHO data gaps in 1998 June–October and 1999 January. The horizontal thin lines mark asymmetry calculated for the whole year. The error bars represent 1σ statistical errors.
The existence of dominating longitudes is explained by the non-axisymmetric part of the solar magnetic field (Ruz-maikin et al., 2001). It is suggested that asymmetry in the to-tal dipole magnetic field of the Sun is introduced by the pres-ence of a constant relict dipole magnetic field (see Sonett, 1982; Mursula et al., 2001). Such a fossil field should be inclined with respect to the solar rotation axis and oriented southward (Bravo and Stewart, 1995).
The longitudinal dependence of the coronal mass ejection (CME) occurrence was investigated by Hildner et al. (1976) for 110 CMEs, observed during 227 days of Skylab opera-tion (May 1973 to February 1974). Longitude was assigned to each event in the following manner: when possible (about one-quarter of all the events) the longitudes of the accom-panying solar surface phenomena were taken. The assign-ment of source longitude for the remaining CMEs was made,
taking into account the bias of the observations to limb events due to the low sensitivity of Skylab coronagraph. So, the lon-gitude of the appropriate limb at the time of the first CME observation was taken as an approximate longitude of CME origin. They found that the number of CMEs significantly increased around the Carrington longitude of about 200◦. Furthermore, they demonstrated that the longitudinal depen-dence of the CME number tracked the sunspot number which was appropriate for each longitudinal zone.
The knowledge of the longitude where CMEs preferen-tially occur could be useful when you forecast the occurrence of CMEs directed toward the Earth. The purpose of this work is to examine the longitudinal dependence in SOHO LASCO CMEs. The Large Angle and Spectrometric Coron-agraph (LASCO; see Brueckner et al., 1995), on board the Solar and Heliographic Observatory (SOHO), commenced
observations on 9 January 1996, and continues to the present, with two longer interruptions (24 June to 14 November 1998, and 21 December 1998 to 4 February 1999). A catalog of CMEs observed by SOHO LASCO coronagraphs is available at http://lasco-www.nrl.navy.mil/cmelist.html (see Yashiro et al., 2004, for catalog description). The data set used here ends on December 2004, the last month available at the time of this writing.
SOHO coronagraphs had a considerably improved sensi-tivity over earlier instruments, resulting in an abundance of detected events. During the 9-year period, there was a total of 9147 events. St. Cyr et al. (2000) evaluated that even close to 100% of strong CMEs (accompanied by type II bursts) might be detected. On the other hand, it introduces the problem of projection effects, since one can observe events originating virtually from the entire solar disc, and not only from the surroundings of the solar limb. It hinders the determination of CME source longitude. Therefore, to search for active lon-gitudes, an analysis of east-west asymmetry in CME occur-rence is employed in this paper. If the origination of CMEs is independent of longitude, asymmetry should be absent. Oth-erwise, we may expect an increase in the number of CMEs observed at the eastern (western) limb, as long as the active longitude stays in the eastern (western) hemisphere. Conse-quently, a predominance of event number from either limb should alternate.
In this paper, only the initial results of east-west asymme-try analysis are presented.
2 Twenty-seven-day periodicity of east-west asymmetry in CME occurrence
To examine the longitudinal dependence of CMEs, the su-perposed epoch method has been used and a synodic solar rotation period of 27 days (so-called Bartels rotation) has been assumed. Initially, the data for each year of observa-tion has been analysed separately. Figure 1 shows the E-W asymmetry as a function of the Carrington rotation day, for 9 years of SOHO LASCO data. It is shown for all the data (left panels) and for the Northern (middle panels) and the Southern (right panels) Hemispheres, separately. A measure of asymmetry is taken as (NE–NW)/(NE+NW), where NEis
the number of events observed at the eastern limb (position angle PA <180◦), and NW is the number of events observed
at the western limb (PA≥180◦). Asymmetry was calculated in 3-day bins, equivalent to the 40-degree longitudinal zones. Full halo events (CMEs completely surrounding the occult-ing disk) were not counted because they had not measured a position angle (PA). Exclusion of halo CMEs should not negatively impact the results, since they originate rather in the central part of the solar disc.
It can be seen from Fig. 1 that there is evident longitudi-nal dependence. For 1996 and 1997 (solar activity minimum and the beginning of the ascending phase), the western events dominate over the first part of the 27-day rotation cycle, and the eastern events dominate during the latter part. A switch
Fig. 2. Superposed epoch distribution of east-west asymmetry for
three periods of time: July 1996–December 1997 (top panels), 1999–Jun 2001 (middle panels), 2002–2003 (bottom panels). The left and middle panels show distributions of the CME occurrence rate (per day) for the eastern (left) and the western (middle) limb. The right panels show distribution of the asymmetry index. The distributions are calculated in 3-day bins, corresponding to 40◦ lon-gitudinal zones. The error bars represent 1σ statistical errors.
from the eastern into the western domination indicates the passage of the active longitude across the central meridian. It takes place approximately on the second day, and corre-sponds to the active longitude of about 30◦. In 1999–2001 (the ascending phase and maximum), the situation is oppo-site, which corresponds to the active longitude of about 180◦. Finally, in 2002 and 2003 (the descending phase), the domi-nating longitude is roughly the same as in 1996–1997, but it is not so clear. The longitudinal dependence is more distinct for the Southern Hemisphere (see right panels in Fig. 1).
The results presented in Fig. 1 are in a reasonable agree-ment with the findings reported by Vernova et al. (2004) for sunspot activity. Assuming a 27-day rotation period, they found that the longitudinal distributions of sunspots have a wide maximum, roughly around 0◦ in the declining phase and minimum, and 180◦ in the ascending phase and maxi-mum.
As a second step of this study, in order to obtain better time resolution, histograms similar to these shown in Fig. 1, but for half-year periods, are made (not shown here). On this basis, three periods of relatively stable domination of one longitude may be distinguished: the later part of 1996– 1997, 1999 – the first part of 2001, and 2002–2003. Only the first two periods maintain a clear overall tendency if they are divided into semiannual periods, whereas the 2002–2003 period shows a smeared picture.
The histograms for these periods are shown in Fig. 2. In the right panels, E–W asymmetry is presented. Additionally,
3142 M. Skirgiello: The east-west asymmetry in Coronal Mass Ejections
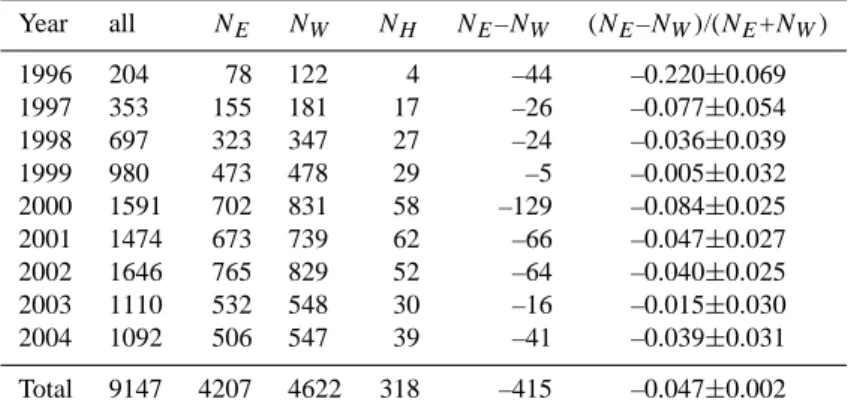
Table 1. Statistics of east-west asymmetry in SOHO LASCO CMEs.
Year all NE NW NH NE–NW (NE–NW)/(NE+NW) 1996 204 78 122 4 –44 –0.220±0.069 1997 353 155 181 17 –26 –0.077±0.054 1998 697 323 347 27 –24 –0.036±0.039 1999 980 473 478 29 –5 –0.005±0.032 2000 1591 702 831 58 –129 –0.084±0.025 2001 1474 673 739 62 –66 –0.047±0.027 2002 1646 765 829 52 –64 –0.040±0.025 2003 1110 532 548 30 –16 –0.015±0.030 2004 1092 506 547 39 –41 –0.039±0.031 Total 9147 4207 4622 318 –415 –0.047±0.002
NE– number of eastern CMEs (PA<180◦)
NW– number of western CMEs (PA≥180◦)
NH– number of full halo CMEs
The errors in the last column are 1σ statistical errors.
the distributions of mean CME numbers (per day) for the eastern (left panels) and the western (middle panels) limbs separately, have been shown. Figure 2 demonstrates a clear, two-time phase reversal of the dominating longitude, which corresponds with the “flip-flop” effect, first found for the so-lar wind by Takalo and Mursula (2002).
The time periods presented in Fig. 2 are 1.5, 2.5 and 2 years long, and are separated by one-year and half-year pe-riods of time. Hence, the full cycle of “flip-flop” alternation must be equal to 5–6 years. It is considerably longer than the average period of 3.6–3.8 years reported by Berdyugina and Usoskin (2003) for sunspots and 3.2 years for solar wind (Takalo and Mursula, 2002). However, the “flip-flop” period of about 5.5 years, found in this paper, applies to 9 years of data, covering an incomplete solar cycle, which is insuffi-cient to draw a general conclusion about a typical “flip-flop” period for CMEs. Average “flip-flop” periods for sunspots and solar wind have been determined on the basis of sev-eral solar cycles. In the individual cycles, time periods of one-longitude domination lasting even 3 years, as well as time periods of large variability can be seen (see Figs. 3–4 in Berdyugina and Usoskin, 2003). The results of this work do not exceed this limit.
As we analyse this paper’s results, we must bear in mind that, unlike sunspots, we do not know the source longitudes of CMEs, so the location of the active longitude is deter-mined on the basis of CME activity gathered from almost the entire hemisphere, which inevitably generates a blurred picture. As a result, accuracy of dominating longitude deter-mination is within 40◦(corresponding to the 3-day bin used in Figs. 1–2) or worse.
Another consequence is that it is impossible to determine precisely the rotation period of the dominating longitudes. For example, the 0.27-day difference between the Bartels and the Carrington rotation periods should give about a 3.6-day lag of dominating longitudes, during one year. Such
difference is difficult to notice when the consecutive annual histograms are compared (see Fig. 1).
Finally, the “flip-flop” effect involves the existence of two opposite active longitudes (Takalo and Mursula, 2002; Berdyugina and Usoskin, 2003). Regarding solar surface and solar wind activity, usually both longitudes can be seen simultaneously. For CMEs, the weaker longitude is hard to observe because events detected at each limb may come from almost the entire hemisphere. The two active longitudes, sep-arated by 180◦, cannot be seen in the E–W asymmetry, of course. But, even if CMEs from merely one limb are consid-ered, we can only see the relative difference between the in-tensities of the two active longitudes. It results from the fact that the two opposite longitudes change hemisphere at the same time. Hence, we can see the weaker active longitude, as far as central disk events are more difficult to detect, than limb events. In this case, there should be a little increase in the CME number when the weaker longitude passes the solar limb. Some of the left and the middle panels of Fig. 2 show an additional small enhancement shifted roughly by 180◦in phase. It may be evidence for a simultaneous presence of two active longitudes.
3 Long-term east-west asymmetry in CME occurrence
In each panel of Fig. 1, the value of the east-west asymmetry calculated for the whole year is marked by a horizontal thin line. These values are also given in the last column of Ta-ble 1, and are visualized in Fig. 3. Moreover, TaTa-ble 1 shows the numbers of all, eastern, western, and halo events in each year, as well as the differences between numbers of eastern and western events, and the values of east-west asymmetry.
It is surprising that the annual asymmetries are perma-nently negative, and change smoothly year by year (see Fig. 3 and the last column of Table 1). Such persistence of western
Fig. 3. East-west asymmetry in CME, calculated for consecutive
years of SOHO LASCO observations. The values for 1998 and 1999 are based on the incomplete data (see the caption of Fig. 1). So, they may differ, to some degree, from the actual ones, consider-ing seasonal variability (see Fig. 4). The horizontal thin line marks the zero asymmetry level. The error bars represent 1 σ statistical errors.
domination is difficult to explain by any solar cause. It ap-pears that there may be some observational or instrumental bias.
Figure 4 demonstrates E–W asymmetries averaged over the shorter, 3-month periods. The figure shows an alternate eastern and western domination. It is pretty regular in 1996 through early 1998, when the eastern domination is observed during the first part of the year, and the western during the latter part. Taking into account the annual revolution of the Earth about the Sun, it proves that increased activity remains on one side of the Sun, fixed in space (i.e. not submitting to the solar rotation). It should be noted that east and west are no specific places in space. A place being to the east of the Sun, after half a year, is seen to the west of it, and vice versa. Hence, the reversal of asymmetry every half a year, actu-ally indicates a persistence of enhanced activity in the same place. In the years following 1998, one can see other peri-ods of semi annual alternation of eastern and western domi-nation. It is particularly pronounced in 1999 in the Northern Hemisphere (see Fig. 4b), and in 2004 in the Southern Hemi-sphere (see Fig. 4c). The location of the long-lasting activity in 1999 had to be opposite to that in 2004, and both had to differ from that in 1996 – early 1998.
Figures 4b and c show a 3-month asymmetry for the Northern and Southern Hemispheres, respectively. They are similar during 1996 – early 1998, whereas they are definitely different in the following period, when even the phase inver-sion is frequently observed.
One can see from Fig. 4 that the seasonal variability is becoming weak during the time of increased solar activity. Figure 5 shows the differences between the numbers of east-ern and westeast-ern CMEs, counted in 3-month bins. Except for the abrupt changes in early 2000 (exact solar activity maxi-mum), the amplitude of seasonal variability is roughly con-stant. This constant contribution into CME activity vanishes in an abundance of events during high solar activity.
Fig. 4. East-west asymmetry in CME, calculated in 3-month
pe-riods of SOHO LASCO observations, for all the data (a), and for the Northern (b), and the Southern (c) Hemispheres. The error bars represent 1σ statistical errors.
As one can see from Figs. 4–5, the temporal negative asymmetries are generally stronger and they cannot be com-pensated by the weaker, positive asymmetries. Here, some contribution may have the pylon that supports the C3 occult-ing disk. It is located in the middle of the SE quadrant and obscures a few degree-wide strips. For two reasons it can-not account for the whole western bias. First, the western domination concerns the Southern as well as the Northern Hemisphere. Second, the greatest asymmetry was observed in 1996 (solar minimum) when CMEs rarely are observed at a latitude covered by the pylon. However, the presence of the pylon might explain why the E–W asymmetry is greater in the Southern than in the Northern Hemisphere (–0.057 and –0.037, respectively).
Figure 6 shows the differences between the numbers of eastern and western CMEs, in 30◦ latitudinal bins,
calcu-lated for the whole studied period. As one can see, the western domination concerns any latitude, but it is espe-cially outstanding in the bin related to the pylon, where about 89 events fewer than the average in the remaining bins were observed. In order to obtain the E–W asymmetry for the Southern Hemisphere on the same level as for the Northern Hemisphere, it is necessary to add as many as 85 events to the number of CMEs observed in the SE quadrant. So, the pylon might account for the north-south difference of the E– W asymmetry.
Accordingly, it is reasonable to assume a northern E–W asymmetry value of –0.037 to be valid for both hemispheres. However, this value is still statistically significant and re-quires further explanation.
The fifth column of Table 1 gives the numbers of halo CMEs in each year. A comparison of these values with those
3144 M. Skirgiello: The east-west asymmetry in Coronal Mass Ejections
Fig. 5. Distribution of differences between the numbers of the
eastern and the western CMEs, calculated for 3-month periods of SOHO LASCO observations.
Fig. 6. Latitudinal distribution of differences between the numbers
of the eastern and the western SOHO LASCO 1996-2004 CMEs, calculated in 30◦bins.
in the sixth column shows that the exclusion of halo events could not have any significant effect on the results of this work.
4 Statistical significance
The errors given in Figs. 1-4 and the last column of Table 1 are 1σ statistical errors. They are valid when the occurrence of individual CME is statistically independent. It is not quite true, since one event may sometimes trigger the another. Fur-thermore, circumstances in some place may tend to be recon-structed within several days, yielding a sequence of succes-sive events. It may influence the resulting asymmetry in two ways. When a whole set of events occurs in one hemisphere it intensifies asymmetry. On the other hand, when part of a CME sequence appears in one hemisphere and the remain-ing part in the other, it may moderate asymmetry in relation to the independent-occurrence asymmetry.
We do not know the scale of this phenomenon: how many events are interrelated, how long CME sequences are, and the like. In order to quantify the upper limit of random asymme-try probability, the following procedure has been performed. Events observed at one solar limb have been separated into groups of events suspected to be connected, according to two criteria: (1) duration of one group is not longer than 13 days; (2) all events appear either in one solar quadrant or within a 15◦range of the position angle including the equator. If different ways of division are possible, the method that yields the smallest number of groups is chosen. Such fairly un-ambiguous separation was possible in 1996 due to a limited number of events in that year. Assuming that each group can
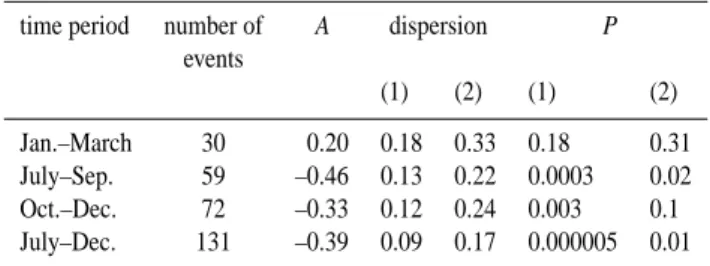
Table 2. Statistical significance of east-west asymmetry observed
in 1996.
time period number of A dispersion P
events (1) (2) (1) (2) Jan.–March 30 0.20 0.18 0.33 0.18 0.31 July–Sep. 59 –0.46 0.13 0.22 0.0003 0.02 Oct.–Dec. 72 –0.33 0.12 0.24 0.003 0.1 July–Dec. 131 –0.39 0.09 0.17 0.000005 0.01
A– observed E-W asymmetry
P – probability of random asymmetry to be equal or greater than A (1) – probability distribution of random asymmetry upon assump-tion of statistically independent CME occurrence
(2) – probability distribution of random asymmetry for overstated dependence of CME occurrence (see text for explanation) The real parameters should be somewhere between (1) and (2).
occur in one of the two hemispheres with the same proba-bility, then we can calculate the probability distributions of random asymmetry.
The parameters of the obtained distributions (the disper-sion and the probability that random asymmetry would be stronger than the observed) are given in the 5th and 7th columns of Table 2, for the first, third and fourth quarters and the latter part of 1996.
It is important to note that the criteria employed in group-ing CMEs are rather broad. They make it possible to join together actually unrelated events, even very distant ones, due to projection effects. Moreover, they split sequences oc-curring partially in both hemispheres. Both of the above bi-ases generate highly overestimated probabilities of random asymmetry. For comparison, Table 2 gives the parameters of probability distributions corresponding to the independent occurrence of CMEs.
Table 2 shows that even highly overstated assumptions generate a significantly low probability of random asymme-try in the latter part of 1996. In the first quarter of 1996, a small number of events makes the statistical significance low in any case.
An analysis similar to the above was impossible for the years following 1996. However, it should be noted that dur-ing 1997–2004, the CME numbers are 1.5–8 times greater than in 1996. Thus, the probabilities of random asymmetry in those years should be accordingly lower.
Finally, it should be noted that the probability of long-lasting random asymmetry is low, because then more events are involved (for example, compare the latter part of 1996 with the third and fourth quarters in Table 2). Considering that the switch of asymmetry sign every half a year (such as in 1996 – early 1998: see Fig. 4) actually indicates a long-lasting enhanced activity on one side of the Sun, it must be said that the probability of the random occurrence of such a case is slender.
One can come to the same conclusion, taking into account that it is hardly probable to obtain regular periodicity in ran-dom asymmetry, in addition, with a period of just one year. The probability of such a case must be in the order given by the product of the random asymmetry probabilities for each half a year, which must yield a very low value.
5 Discussion and conclusions
Various signatures of solar activity, such as sunspots, flares, solar wind parameters, photospheric and interplanetary mag-netic field, show a persistent, solar rotation periodicity, in-dicating the existence of active longitudes on the Sun. In this paper, a statistical study of longitudinal dependence of CME occurrence for SOHO LASCO 1996–2004 data is pre-sented. Because it is impossible to determine the longitude of CME origin, the existence of active longitudes is inferred from an west asymmetry in the observed number of east-ern (PA<180◦) and western (PA≥180◦) events.
Analysis of the east-west asymmetry in a synodic 27-day cycle shows evident longitudinal dependence in some pe-riods of time. In the SOHO LASCO data set, three peri-ods of relatively stable active longitude have been distin-guished: July 1996–1997, 1999–Jun 2001, and 2002–2003 (see Fig. 2). In these periods, the dominating longitudes were: about 30◦, 180◦, and 0◦, respectively. It is more pro-nounced in the Southern Hemisphere (see right panels in Fig. 1). These results are reasonably consistent with those reported by Vernova et al. (2004) for sunspot activity.
Two-time reversal of active longitude in a 9-year stud-ied period corresponds with the “flip-flop” effect found by Takalo and Mursula (2002) for IMF parameters and later by Berdyugina and Usoskin (2003) for sunspots. The pe-riod of about 5.5 years found in this paper is considerably longer than the average period of about 3.6–3.8 years re-ported by Berdyugina and Usoskin (2003). But the duration of the periods of one-longitude dominance found in this pa-per (1.5–2.5 years) remains within the limits of 1.5–3 years observed for sunspots in individual solar cycles (Berdyug-ina and Usoskin, 2003). However, an incomplete solar cycle of SOHO LASCO data does not allow one to draw a general conclusion about a typical “flip-flop” period for CMEs, espe-cially as the longitudinal dependence of solar activity varies significantly from cycle to cycle (see, for example, Bogart, 1982; Neugebauer et al., 2000; Berdyugina and Usoskin, 2003; Bai, 2003).
The east-west asymmetry reveals two unexpected trends related to time scales much longer than the Carrington ro-tation period. First, values of a 3-month asymmetry (see Figs. 4a–c) sometimes show a fairly regular annual cyclicity, especially in the periods of low solar activity (1996 to early 1998, and 2004), where domination of the two hemispheres alternates each half a year. It evidences the existence of long-lived activity, fixed in space, i.e. not undergoing the Carring-ton rotation. In the increased solar activity period, it be-comes more complicated, and then differences between the
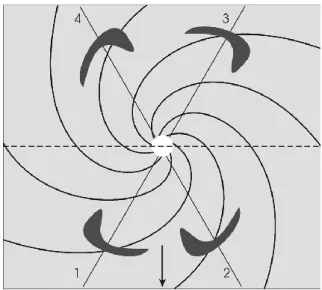
Fig. 7. Sketch illustrating possible mechanism of east-west
asym-metry generation. The small circle at the centre marks the Sun. The arrow at the bottom indicates a direction to the observer. The plane of the sky is marked by the horizontal dashed line. Hypothetical shape of CME front (thick lines), deformed by the solar magnetic field, in four different positions equidistant from the plane of the sky, is shown. The straight thin lines mark directions of CME prop-agation. Note that the fronts shown are asymmetric in the ecliptic plane (plane of the figure). The observer can see CME in the plane of the sky (perpendicular to the plane of the figure), so he will not observe this asymmetry at all.
Northern and Southern Hemispheres (Figs. 4b, c) are more pronounced.
Such facts as the diverse solar cycle dependence for the Northern and Southern Hemispheres, similar in 1996–1998 and unlike in the later period (see Figs. 4b, c), the abrupt increase in the western domination in exact solar maximum (see Fig. 5), etc., allow us to suppose that there we have to do with a certain manifestation of a complex solar magnetic field rather than with observational bias. This surprising find-ing is difficult to explain at present.
It is also interesting to note that the period of prolonged, statistically significant E–W asymmetry has been found for flares (Heras et al., 1990). The authors were not able to ex-plain this phenomenon. Furthermore, parameters of solar wind exhibit annual cyclicity (see, for example, Neugebauer et al., 2000). It is supposed that it may result from latitudi-nal dependence of solar wind parameters introduced by the annual variation of the heliographic latitude of the Earth. Of course, such cause does not concern remote CME observa-tions. However, an annual variability found in this work may indicate that the one-year period in solar wind parameters is not exclusively an observational effect.
Second, when the east-west asymmetry is calculated for a whole year (which cancels out the seasonal effect resulting from the revolution of the Earth), a little persistent predom-inance of western events is found (see Fig. 3 and the last
3146 M. Skirgiello: The east-west asymmetry in Coronal Mass Ejections
column of Table 1), which suggests some observational or in-strumental bias. The pylon supporting the C3 occulting disk, located in the SE quadrant, may account only for a somewhat stronger E–W asymmetry observed in the Southern Hemi-sphere. Nevertheless, after correcting for the pylon obscura-tion, there still remains the western predominance of about 3.7%, on average. This value reflects the fact that, generally, seasonal asymmetries are stronger when negative, both in the Northern and Southern Hemispheres (see Figs. 4b–c).
It is possible to explain the observed asymmetry if we take into account that the conditions at both limbs are not identi-cal, because of the twisted solar magnetic field (the so-called Archimedes spiral). The twisted lines of the magnetic field are directed towards the observer on the western side of the Sun, and opposite on the eastern. In order that asymmetry could arise, it is necessary that the magnetic field impacts the shape or the motion of the CMEs.
At present, we know little about the configuration of the coronal magnetic field close to the Sun, as well as whether and how it may affect the propagation of CMEs. Let us sup-pose, for example, that the front of CMEs is deformed, as shown in Fig. 7, where four events equidistant from the plane of the sky in four different positions are presented. The vis-ibility of these phenomena will be impacted by two factors. The first is the asymmetrically-shaped CME, which increases the chance for detection of events in position 1 and 3. In these cases, the more distinct, optically thicker (along the line of sight) part of CME appears first in the field-of-view. In po-sitions 2 and 4, the thin part appears first, and only after that – the thick part, but then the CME is already farther from the Sun, hence less visible.
The second factor is the different distance of events from the observer. Events 1 and 2 are nearer than events 3 and 4, so there is a better chance for them to be detected. In combing both of the above factors, we obtain as a result on the east-ern side, the best observational conditions (pos. 1 – closer and more favourable CME shape) and the worst (pos. 4 – a further and unfavourable shape). On the western side condi-tions are intermediate (pos. 2 and 3). This may be the reason for the asymmetry arising, because the total detectability for sectors 2 and 3 do not have to be the same as the total for sectors 1 and 4.
Note that for this asymmetry to arise, both factors are nec-essary. Neither of them separately can give asymmetry. So the most effective in the production of asymmetry should be events originating far from the solar limb. They must cover a longer distance before they appear in the field of view. This ensures the necessary difference of distance between events originating on the visible and the invisible side of the Sun, as well as time needed to effectively influence the CME by the solar magnetic field.
It may be said that the increased detection sensitivity of SOHO LASCO coronagraphs gives, as a side effect, an in-creased observational bias.
Finally, taking into account that the solar magnetic field and the characteristics of CME population change during the solar activity cycle, one might suppose that this should
result in a variability of observational bias in the solar cycle. This could explain the variation of the annual asymmetry (see Fig. 3), at least partially. Still, both trends found call for fur-ther detailed investigation.
Acknowledgements. Research partly supported by Polish
Com-mittee of Scientific Research Grant No. 78/E-73SPB/COST/T-12/DWM96/2004-2006. In this paper data from the SOHO LASCO catalog of CMEs were used. This CME catalog is generated and maintained by NASA and The Catholic University of America in cooperation with the Naval Research Laboratory. SOHO is a project of internal cooperation between ESA and NASA. The author wishes to thank the both reviewers whose comments helped significantly to improve this paper.
Topical Editor R. J. Forsyth thanks R. A. Harrison and another referee for their help in evaluating this paper.
References
Bai, T.: Distribution of flares on the Sun: superactive regions and active zones of 1980–1985, Ap. J., 314, 795–807, 1987. Bai, T.: Hot spots for solar flares persisting for decades: longitude
distributions of flares of cycles 19–23, Ap. J., 585, 1114–1123, 2003.
Bogart, R. S.: Recurrence of solar activity: evidence for active lon-gitudes, Sol. Phys., 76, 155–165, 1982.
Berdyugina, S. V. and Usoskin, I. G.: Active longitudes in sunspot activity: Century scale persistence, AandA 405, 1121–1128, 2003.
Brueckner, G. E., Howard, R. A., Koomen, M. J., Korendyke, C. M., Michels, D. J., Moses, J. D., Socker, D. G., Dere, K. P., Lamy, P. L., Llebaria, A., Bout, M. V., Schwenn, R., Simnett, G. M., Bedford, D. K., and Eyles, C. J.: The Large Angle Spectroscopic Coronagraph (LASCO), Sol. Phys., 162, 357–402, 1995. Bravo, S. and Stewart, G.: The inclination of the heliomagnetic
equator and the presence of an inclined relic field in the Sun, Ap. J., 446, 431–434, 1995.
Bumba, V. and Howard, R.: Solar activity and recurrences in magnetic-field distribution, Sol. Phys., 7, 28–38, 1969.
Gaizauskas, V., Harvey, K. L., Harvey, J. W., and Zwaan, C.: Large-scale patterns formed by solar active regions during the ascend-ing phase of cycle 21, Ap. J., 265, 1056–1065, 1983.
Haurwitz, M. W.: Solar longitude distributions of proton flares, me-ter bursts, and sunspots, Ap. J., 151, 351–364, 1968.
Heras, A. M., Sanahuja, B., Shea, M. A., and Smart, D. F.: Some comments on the east-west solar flare distribution during the 1976–1985 period, Sol. Phys., 126, 371–383, 1990.
Hildner, E., Gosling, J. T., MacQueen, R. M., Munro, R. H., Poland, A. I., and Ross, C. L.: Frequency of coronal transients and solar activity, Sol. Phys., 48, 127–135, 1976.
Mursula, K. and Hiltula, T.: Systematically asymmetric helio-spheric magnetic field: Evidence for a quadrupole mode and non-axisymmetry with polarity flip-flops, Sol. Phys., 224, 133–143, 2004.
Mursula, K., Usoskin, I. G., and Kovaltsov, G. A.: Persistent 22-year cycle in sunspot activity: evidence for a relic solar magnetic field, Sol. Phys., 198, 51–56, 2001.
Neugebauer, M., Smith, E. J., Ruzmaikin, A., Feynman, J., and Vaughan, A. H.: The solar magnetic field and the solar wind: Existence of preferred longitudes, J. Geophys. Res., 105, 2315– 2324, 2000.
Ruzmaikin, A., Feynman, J., Neugebauer, M., and Smith, E. J.: Pre-ferred solar longitudes with signatures in the solar wind, J. Geo-phys. Res., 106, 8363–8370, 2001.
Sonett, C. P.: Sunspot time series: Spectrum from square law mod-ulation of the Hale cycle, Geophys. Res. Lett., 9, 1313–1316, 1982.
St. Cyr, O. C., Howard, R. A., Sheeley Jr., N. R., Plunkett, S. P., Michels, D. J., Paswaters, S. E., Koomen, M. J., Simnett, G. M., Thompson, B. J., Gurman, J. B., Schwenn, R., Webb, D. F., Hild-ner, E., and Lamy, P. L.: Properties of coronal mass ejections: SOHO LASCO observations from January 1996 to June 1998, J. Geophys. Res., 105, 18 169–18 185, 2000.
Takalo, J. and Mursula, K.: Annual and solar rotation periodicities in IMF components: Evidence for phase/frequency modulation, Geophys. Res. Lett., 29 (9), doi:10.1029/2002GL014658, 2002. Trotter, D. E. and Billings, D. E.: Longitudinal variation of a zone
of solar activity, Ap. J., 136, 1140–1144, 1962.
Vernova, E. S., Mursula, K., Tyasto, M. I., and Baranov, D. G.: Long-term longitudinal asymmetries in sunspot activity: differ-ence between the ascending and descending phase of the solar cycle, Sol. Phys., 221, 151–165, 2004.
Yashiro, S., Gopalswamy, N., Michalek, G., St. Cyr, O. C., Plun-kett, S. P., Rich, N. B., and Howard, R. A.: A catalog of white light coronal mass ejections observed by the SOHO spacecraft, J. Geophys. Res., 109, A07105, 2004.