HAL Id: hal-01137152
https://hal.archives-ouvertes.fr/hal-01137152
Submitted on 30 Mar 2015
HAL is a multi-disciplinary open access
archive for the deposit and dissemination of
sci-entific research documents, whether they are
pub-lished or not. The documents may come from
teaching and research institutions in France or
abroad, or from public or private research centers.
L’archive ouverte pluridisciplinaire HAL, est
destinée au dépôt et à la diffusion de documents
scientifiques de niveau recherche, publiés ou non,
émanant des établissements d’enseignement et de
recherche français ou étrangers, des laboratoires
publics ou privés.
Copyright
Supporting strategic thinking of smallholder dairy
farmers using a whole farm simulation tool
Pierre-Yves Le Gal, Jennifer Bernard, Charles-Henri Moulin
To cite this version:
Pierre-Yves Le Gal, Jennifer Bernard, Charles-Henri Moulin. Supporting strategic thinking of
small-holder dairy farmers using a whole farm simulation tool. Tropical Animal Health and Production,
Springer Verlag (Germany), 2013, 45 (5), pp.1119 - 1129. �10.1007/s11250-012-0335-6�. �hal-01137152�
REGULAR ARTICLES
Supporting strategic thinking of smallholder dairy farmers
using a whole farm simulation tool
Pierre-Yves Le Gal&Jennifer Bernard&
Charles-Henri Moulin
Accepted: 28 November 2012 / Published online: 8 December 2012 # Springer Science+Business Media Dordrecht 2012
Abstract This article investigates how a one-to-one support process based on the use of a whole dairy farm simulation tool helps both farmers to reflect on their production strat-egies and researchers to better understand the farmers’ con-texts of action and decision. The support process consists of a minimum of four discussion sessions with the farmer: designing the Initial Scenario and formulating a diagnosis, building and simulating the Project Scenario corresponding to the objective targeted by the farmer, building and com-paring alternative scenarios proposed both by the farmer and the researcher, and evaluating the process with the farmer. The approach was tested with six smallholder farmers in Brazil. It is illustrated with the example of one farmer who aimed to develop his milk production by more than dou-bling his herd size on the same cultivated area. Two other examples illustrate the diversity of issues addressed with this approach. The first estimates the sensitivity of economic results to price variations of milk and concentrates. The second compares two scenarios in terms of forage supply autonomy. The discussion assesses the outcomes of the
approach for farmers in terms of response to their specific issues and of knowledge acquired. The research outputs are discussed in terms of the value and limits of using simula-tion tools within both participatory acsimula-tion research and advisory processes.
Keywords Scenario analysis . Price sensitivity . Participatory approach . Learning process . Brazil
Introduction
Due to variable prices and growing environmental pres-sures, farmers must make short- and long-term decisions in an increasingly uncertain context. Strategic decisions are especially difficult to take since they involve some elements such as prices that can be only assumed and links between numerous farm components. The latter is particularly true on dairy farms, where cow feed and forage crop patterns have to be cautiously designed in order to achieve a given milk production objective (Martin et al. 2011). The sensi-tivity of livestock farming to environmental conditions such as climate change (Howden et al. 2007) and to market regulations (Foltz 2004), consequently makes the design and evaluation of innovative production systems at the farm level particularly challenging for researchers, advisers and farmers (Dedieu et al.2011).
This design process can follow various approaches depending on the objectives of researchers and the roles given to farmers and advisers in the process (Le Gal et al.
2011). Participative methods aiming to support actual farm-ers in exploring new management processes or integrating innovative technologies into their existing farming systems are based on a close relationship between researchers and farmers. These methods often use modeling combined with scenario analysis (Bood and Postma 1997) to establish an
P.-Y. Le Gal (*)
:
J. BernardCentre de Coopération Internationale en Recherche Agronomique pour le Développement, UMR Innovation, 34398 Montpellier, France
e-mail: pierre-yves.le_gal@cirad.fr C.-H. Moulin
Montpellier SupAgro, UMR Systèmes d’élevage Méditerranéens et Tropicaux, 2 Place Viala, 34060 Montpellier, France
e-mail: moulinch@supagro.inra.fr C.-H. Moulin
Institut National de la Recherche Agronomique, UMR Systèmes d’élevage Méditerranéens et Tropicaux, 2 Place Viala,
understanding of farms that can be shared by researchers and farmers, and to simulate various paths by which a farm may evolve. These paths either are consistent with the farm-er’s objectives or emerge from the researchers’ own reflec-tions (Cabrera et al. 2005; Vayssières et al. 2009). Some authors focus on the capacity of models to enhance the learning processes of farmers and advisers (Duru et al.
2007). Models are then identified as discussion facilitators rather than decision support tools (Nelson et al.2002).
Most research is conducted by scientists who develop models for their own use. These tools are often quite complex and require data which are not easily available on farm. Moreover, few works aim explicitly to transfer the approach designed to stakeholders outside the re-search field such as advisers or consultants (Dobos et al.2004). They usually address operational management issues (e.g., animal nutrition) rather than planning and strategic ones (e.g., grazing planning throughout the year or modifications in farm enterprise patterns; Moreau et al.2009; Sraïri et al. 2011).
This article investigates how a support process based on the use of a whole dairy farm simulation tool named Dairy-Motion, and meant to be ultimately transferred to farm advisers, helps farmers to reflect on their production strate-gies and researchers to better understand farmers’ contexts of action and decision. It was tested in Brazil on smallholder dairy farms in a one-to-one relationship between researchers and a sample of six farmers. After presenting the context of the study and how the support process was implemented, we briefly describe the simulation tool. We then illustrate this implementation with a specific case and show the diversity of issues addressed with a comparative analysis of the six cases studied. The advantages and limitations of the process are finally discussed by considering farmer’s, researcher’s, and adviser’s perspectives.
Material and methods Context
The study was undertaken in the Municipal District of Unaí-MG (16.35° S, 46.90° W) in the Brazilian state of Minas Gerais. The climate is tropical with a 5–6 months dry season (April to September), and a rainy season (October to March). The average annual temperature is 24.4 °C and annual rainfall of 1,200–1,400 mm. A na-tional land reform process began 25 years ago with the dismantling of vast farms and the creation of new settle-ments composed of smallholder farmers. Each beneficia-ry was given title to 20–30 ha of land. Some farmers have specialized in dairy production to supply a large local dairy cooperative (Bernard et al. 2011). The cow
breeds range from rustic to improved dairy breeds, in-cluding diverse degrees of cross-breeding. Feed is based on grazing during the rainy season and foddering during the dry season with standing forage, such as sugarcane or Napier grass, and with stored feed, such as maize, sor-ghum, or Napier grass silage. Concentrates may be given to the herd during part or all of the year. The best equipped producers own a milk tank, a mechanical milk-ing system, and a silo to store concentrates. However, for the most part, the level of equipment is low, composed simply of an enclosure or room for milking.
Study sample
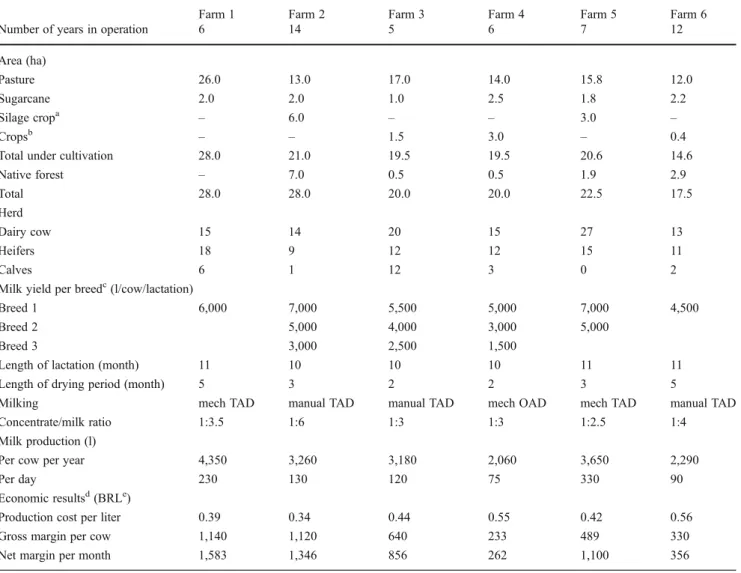
The support process was tested in 2010 on six farms, in-cluding three farms already involved in monitoring their dairy activity by the research team (Bernard et al. 2011) and three new ones added to the sample in order to test the feasibility of the support process without any previous knowledge of the farm. These six farmers were selected because they were planning strategic changes on their farms. At the time of the study, they were all between 40 and 50 years old and had, at the minimum, a primary level education. As shown in Table1, the six farms differ in terms of structure, practices, and economic results, illustrating the diversity of production processes in terms of size and efficiency.
The support process
The support process has four objectives: (1) to under-stand the farmers’ existing situation and to establish a joint diagnosis of their situation with regard to their future plans; (2) to accompany the farmers in exploring new configurations of their system, including innova-tions to be introduced into their initial system, through the construction of alternative scenarios to be tested; (3) to estimate the technical and economic results of these scenarios with a simulation tool; and (4) to analyze and discuss the simulation outputs with the farmers to ad-vance their deliberations. A scenario corresponds to a combination of input variable values describing an ini-tial farm structure and the management modes chosen (forage, concentrates, and herd management). The out-puts include a monthly description over 1 year of the composition of the herd, the fodder stocks and dairy produc-tion, and technical–economic indicators of the dairy activity such as the average milk production (per cow and per herd, per day and year), revenues generated from the activity, and the cost of producing 1 l of milk.
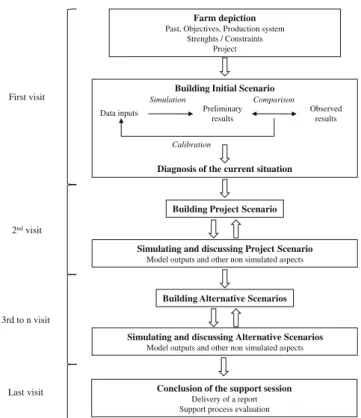
The process consists of a minimum of four sessions of dialog with the producer, based on the scenarios whose characteristics and simulated outputs are discussed
(Fig.1). The first session begins by learning about the farm and the producer, his professional experience, objectives, plans, and the difficulties he has encountered. Data pre-sented in Table 1 are collected and an Initial Scenario representing the current situation is then simulated and dis-cussed by comparing the simulated estimations of dairy production, forage resources, and monthly revenues with the producer’s evaluations and available data, such as the milk output delivered to the collector. This Initial Scenario allows the producer to validate how his farm is represented in the simulation tool and the user to estimate some input variables specific to the farm but frequently unknown by farmers. For instance, biomass production of pastures may be inferred from both the amount of feeds (forage +
concentrates) distributed to the cows declared by the farmer and the milk production recorded by the cooperative. More-over, this process feeds the diagnosis of farmer’s situation in relation to his plans.
A Project Scenario is then built with the producer based on his ideas regarding the evolution of his farm. This pro-cess may need to go through several simulation iterations before obtaining consistent input data in terms of structure and management modes. Every modification has to be dis-cussed and agreed with the farmer. These discussions help the farmer to clarify his vision of the future, which may be rather vague at the beginning of the process. Based on the discussion of the Project Scenario results, new ideas may emerge, originating from both the farmer and the researcher.
Table 1 Characteristics of the six farms participating in the support process
Farm 1 Farm 2 Farm 3 Farm 4 Farm 5 Farm 6 Number of years in operation 6 14 5 6 7 12 Area (ha)
Pasture 26.0 13.0 17.0 14.0 15.8 12.0
Sugarcane 2.0 2.0 1.0 2.5 1.8 2.2
Silage cropa – 6.0 – – 3.0 –
Cropsb – – 1.5 3.0 – 0.4
Total under cultivation 28.0 21.0 19.5 19.5 20.6 14.6 Native forest – 7.0 0.5 0.5 1.9 2.9 Total 28.0 28.0 20.0 20.0 22.5 17.5 Herd Dairy cow 15 14 20 15 27 13 Heifers 18 9 12 12 15 11 Calves 6 1 12 3 0 2
Milk yield per breedc(l/cow/lactation)
Breed 1 6,000 7,000 5,500 5,000 7,000 4,500 Breed 2 5,000 4,000 3,000 5,000
Breed 3 3,000 2,500 1,500
Length of lactation (month) 11 10 10 10 11 11 Length of drying period (month) 5 3 2 2 3 5
Milking mech TAD manual TAD manual TAD mech OAD mech TAD manual TAD Concentrate/milk ratio 1:3.5 1:6 1:3 1:3 1:2.5 1:4 Milk production (l)
Per cow per year 4,350 3,260 3,180 2,060 3,650 2,290
Per day 230 130 120 75 330 90
Economic resultsd(BRLe)
Production cost per liter 0.39 0.34 0.44 0.55 0.42 0.56 Gross margin per cow 1,140 1,120 640 233 489 330 Net margin per month 1,583 1,346 856 262 1,100 356 mech mechanical milking, TAD twice a day, OAD once a day
a
Sorghum or maize
b
Maize, rice, cassava, beans
c
A breed is defined as a combination of genetic profile and yield potentiality. A farm can include up to three different breeds
d
Data simulated and validated by the producer
One or several Alternative Scenarios then are built with the producer to explore possible options. The simulation outputs then are discussed in a third session. Aspects not taken into account by the simulation tool, such as extra labor requirements, can be discussed in a qualitative manner based on the farmer’s own estimation and their potential cost can be evaluated and included in the scenario. The last session concludes the support pro-cess. A written document is delivered to the producer that recapitulates, in the form of tables and graphs, the reflection process carried out and the numerical results of the scenarios. The whole process then is evaluated with the farmer to estimate its value from his perspective, what he learned, and how he thinks the simulation tool could be improved.
Overview of the whole farm simulation tool
DairyMotion takes the structure of a tool first tested in Morocco on small irrigated dairy farms (Le Gal et al.
2009) and extends it to Brazilian smallholder farms. The tool aims to test different combinations of production system components: herd (breed type, heads, herd en-largement dynamic), crop production (type of forage produced, area farmed, dynamic of establishing forage areas, crop management sequences), feeding system (nu-trition quality, quantity grazed, and distribution), and equipment.
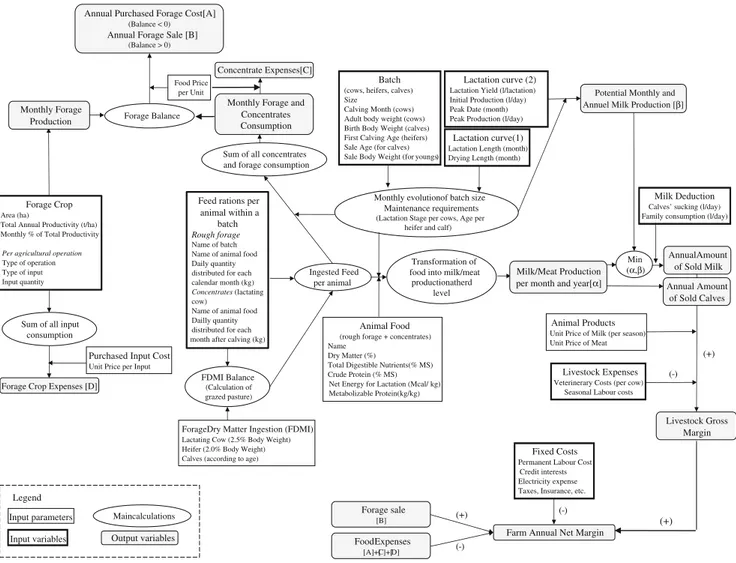
DairyMotion assesses the balance between the feed demand that results from a given dairy herd management and the feed supply that results from cropping pattern choices and the management of a farm’s forage crops (Fig. 2). This calculation involves three main modules: the feed supply generated by forage production (cropping pattern, technical sequences, and crop yields), the feed demand originating from the herd (herd size, lactation curve, dynamics of cow reproduction, and of calf growth and sales), and the feed distributed daily to the herd based on both the forage production and the available concentrates (see Tables 2 and 3 for an example).
The technical–economic performance indicators of the dairy unit are calculated based on the decisions made in term of forage, concentrate feeds, and herd management. Included are revenues and expenses linked to the pro-duction of forage, milk, and meat through the sale of juveniles and culled cows. Fixed expenses such as per-manent labor costs and interest on loans also are in-cluded in order to calculate the farm’s total net margin for each simulated scenario. A “Parameters” module regroups the nutritive value of feed and the price of various inputs and outputs (milk and meat) that are applied identically to a range of farms in a given area (Fig. 2). Estimations of forage intake, energy and pro-tein requirements for maintenance and milk production are based on the equations from NRC (2001), since this tool has been developed for a Brazilian situation.
Once all of the input data of a scenario have been entered, DairyMotion calculates in parallel the monthly forage production and feed demand. It then estimates the feeding balance (i.e., the forage and concentrate amounts that are in excess or that need to be purchased), the milk production allowed by the diet (forage + concentrates) and the economic results related to crop and livestock produc-tion. The tool operates calculations for 12 monthly time steps, allowing to depict seasonal changes (herd and for-age crops dynamics, feeding practices) for 1 year. Several simulations can be undertaken successively to explore the multi-annual evolution of a system, the output data of simulation n becoming the input data of simulation n+1.
DairyMotion does not use feedback loops, nor rules of the type, “IF condition THEN actions”. Decisions to modify a variable following the observation of the status of the system are brought about by the user by simulat-ing a new scenario. For example, a scenario 1 highlight-ing an imbalance between feed supply and demand over part of the year will be followed by a scenario 2 correct-ing this problem by modifycorrect-ing inputs in several possible ways: changing the forage cropping pattern, changing the management, and consequently yields, of forage crops, reducing herd demand. This procedure allows researchers and farmers to follow, step by step, the effects of a given
Observed results Data inputs Preliminary
results
Simulation Comparison
Calibration Farm depiction
Past, Objectives, Production system Strenghts / Constraints
Project
Building Initial Scenario
Building Project Scenario
First visit
Simulating and discussing Project Scenario
Model outputs and other non simulated aspects
Diagnosis of the current situation
2ndvisit
Conclusion of the support session
Delivery of a report Support process evaluation
3rd to n visit
Building Alternative Scenarios
Simulating and discussing Alternative Scenarios
Model outputs and other non simulated aspects
Last visit
scenario on the output variables and to remain in control of modifications to be made to each scenario to achieve a given objective. DairyMotion was implemented with
Microsoft Excel® (version 2003). The current version is still a prototype which needs to be developed further to be transferred to advisers or consultants.
(+)
Fixed Costs
Permanent Labour Cost Credit interests Electricity expense Taxes, Insurance, etc.
Farm Annual Net Margin Forage sale [B] (-) (+) Food Expenses [A]+[C]+[D] (-) Purchased Input Cost
Unit Price per Input
Forage Crop Expenses [D] Sum of all input
consumption
Forage Crop
Area (ha)
Total Annual Productivity (t/ha) Monthly % of Total Productivity
Per agricultural operation
Type of operation Type of input Input quantity
Forage Balance
Annual Purchased Forage Cost[A]
(Balance < 0)
Annual Forage Sale [B]
(Balance > 0) Monthly Forage Production Food Price per Unit Legend Input parameters Input variables Main calculations Output variables Animal Food
(rough forage + concentrates) Name
Dry Matter (%)
Total Digestible Nutrients(% MS) Crude Protein (% MS) Net Energy for Lactation (Mcal/ kg) Metabolizable Protein(kg/kg)
Animal Products
Unit Price of Milk (per season) Unit Price of Meat
Transformation of food into milk/meat productionatherd
level
Feed rations per animal within a
batch
Rough forage Name of batch Name of animal food Daily quantity distributed for each calendar month (kg)
Concentrates (lactating
cow)
Name of animal food Dailly quantity distributed for each month after calving (kg)
Milk/Meat Production per month and year[α]
Monthly evolutionof batch size Maintenance requirements
(Lactation Stage per cows, Age per heifer and calf)
Batch
(cows, heifers, calves) Size
Calving Month (cows) Adult body weight (cows) Birth Body Weight (calves) First Calving Age (heifers) Sale Age (for calves) Sale Body Weight (for youngs)
Lactation curve(1)
Lactation Length (month) Drying Length (month)
Livestock Expenses
Veterinerary Costs (per cow) Seasonal Labour costs
Concentrate Expenses[C]
Milk Deduction
Calves’ sucking (l/day) Family consumption (l/day)
Livestock Gross Margin AnnualAmount
of Sold Milk Monthly Forage and
Concentrates Consumption
Sum of all concentrates and forage consumption
Annual Amount of Sold Calves
FDMI Balance
(Calculation of grazed pasture)
ForageDry Matter Ingestion (FDMI)
Lactating Cow (2.5% Body Weight) Heifer (2.0% Body Weight) Calves (according to age)
(+) (-) Lactation curve (2)
Lactation Yield (l/lactation) Initial Production (l/day) Peak Date (month) Peak Production (l/day)
Min (α,β) Potential Monthly and Annuel Milk Production [β]
Ingested Feed per animal
Fig. 2 Conceptual representation of DairyMoTion structure and of the links between the model components and variables
Table 2 Using DairyMoTion to characterize feeds distributed to milking cows on a Brazilian dairy farm (translation from the Portuguese version). Forage distribution (pasture intake during the rainy season is directly calculated from cows’ FDMI)
Forage distribution
Animal type: milking cow Enter forage quantity distributed every day (kg green matter per animal)
Month Oct Nov Dec Jan Feb Mar Apr May Jun Jul Aug Sep
Sugarcane with urea 1 % 50 50 50 50
Napier grass
Pennisetum silage 50 50
Sorghum silage Napier grass silage Bracharia silage Styloxanthes Tanzania grass Rice straw
Results
Implementing the support process with farm 1
Designing the Initial Scenario and formulating a diagnosis Having chosen to focus his farm on dairy activity, F1 sought to achieve a high level of milk production by increasing the size of his herd and the milk yield of each cow. He regularly faced problems for feeding the herd during the dry season and had tested various solutions: silage of a maize–panicum mixture in 2007, a small plot of sugarcane in 2008, replac-ing 2 ha of maize with sugarcane in 2009. However, he had a surplus of forage supplied by pastures during the rainy season which could represent an opportunity to change his forage pattern (10 ha, Brachiaria brizantha; 12 ha, Brachia-ria decumbens; 4 ha, Panicum maximum cv Tanzania) and improve his cows’ productivity.
The Initial Scenario was designed based on these data. F1 did not know the biomass productivities of his pastures, which therefore had to be calibrated by adjusting the grazed forage intake from the milk production values recorded by the cooperative and the distribution of feed and estimating pasture productivities required to cover this intake. The pasture productivity was estimated at 20 t GM/ha (green matter) leading to a grass surplus at the end of the rainy season agreed by F1. The productivity of the sugarcane crop was estimated at 100 t GM/ha per year based on local pasture experts’ knowledge and scientific literature (Basanta et al.2003; Korndörfer and Pereira de Melo2009). Once the input dataset was finalized, the Initial Scenario was simu-lated and F1 could react to the output results, especially the daily milk production and the monthly net margin (Table4), which were compared to the data recorded by the dairy cooperative (quantity of milk supplied every 2 weeks and input expenses made at the cooperative shop). At the end of that step, both the input dataset and the diagnosis of the current situation (here, essentially a pasture surplus despite
low biomass productivity) were jointly agreed upon by the farmer and the researcher.
Building the Project Scenario: changing the dairy herd size Based on his dairy production objective and his pasture sur-plus, F1 planned to increase his herd to up to 40 cows while keeping the same feeding system in the dry and rainy seasons. A Project Scenario was built and simulated off-farm to address two questions: how long would it take to achieve this 40-cow objective based on internal herd growth? How much land should be devoted to sugarcane to feed the entire herd? It showed that a 40-cow herd could be attained within 4 years. The simulations then were run with a herd consisting of 40 cows plus 23 heifers and 16 calves to be fed with the diet (forage + concentrates) calculated by DairyMotion (Table4). Such an increase in herd size required the forage system to be reshaped. F1 suggested decreasing his pasture area and in-creasing his sugarcane area accordingly. This option assumed that the pasture yield must increase to provide more forage for a larger herd on a smaller area.
Since the total area of the farm remains stable, both pasture area and yield depend on sugarcane yield. After simulating the impact of three sugarcane yields (Table 5), F1 chose the 80 t GM/ha level since it seemed more realistic in his production context. Then, pastures have to produce 45 t GM/ha/year, an objective consistent with local refer-ences (Martha Júnior et al.2003). To achieve this produc-tivity, F1 intended to split his plots into smaller units and to fertilize his pasture every year, an expense often sacrificed by smallholder farmers when facing cash-flow constraints. Based on this discussion, the costs of plot subdivision and fertilization were included in the simulations.
The farmer then had to consider how to address the in-creased workload represented by a larger herd, including issues related to the organization of work and related produc-tion costs. Various changes were explored in combinaproduc-tion: purchasing new milking equipment and rehabilitating the
Table 3 Using DairyMoTion to characterize feeds distributed to milk-ing cows on a Brazilian dairy farm (translation from the Portuguese version). Concentrate distribution (quantities may be entered according
to the expected cow milk production at a given stage of lactation or according to the lactation stage itself)
Concentrates distribution
Quantity in kg/day/animal 1 kg/X milk liters
Cow lactation stagea 1 2 3 4 5 6 7 8 9 10 11 12 13 14 15 16 Feed 22 % 2.5 2.5 2.5 2.5 2.5 2.5 2.5 2.5 2.5 2.5 2.5 2.5
Feed 18 % Feed 16 % Soybean meal
a
milking parlor; recruiting a permanent employee when the herd attains 35 cows; moving from sugarcane to silage in order to save labor during the dry season; and selling calves at birth. Although the sugarcane option required the hiring of one more employee, F1 preferred this option to that of silage because sugarcane can be grown throughout the year and has a lower risk in terms of climate hazards. Extra expenses linked to the purchase on credit of a larger cowshed and bigger cooling tank were estimated by F1. Mortgage repayment amounts then were included in the Project Scenario.
Based on this dataset, the farm net margin per month had more than doubled from the initial to the Project Scenario (Table4). This quantified result confirmed F1 that the scenario to increase the size of the herd would enable him to earn a greater income from dairy production. While he could barely feed his family with the revenues earned from the current herd,
the new farm configuration with a larger herd would enable him to pay salaries to himself and his wife. Moreover, he now had a better idea of the feeding system and the forage crop management he had to implement to achieve this objective. Alternative Scenario: pushing the system to its stocking density limits
Since F1’s main objective was to increase his milk produc-tion, we then proposed an Alternative Scenario, which aimed to push the production system to its stocking density limits. The forage supply was calculated based on a process similar to that described above, i.e.,: (1) sugarcane produc-tivity remained at 80 t GM/ha/year while pasture productiv-ity was fixed at 75 t GM/ha/year, a value considered feasible by local experts and researchers (Pedreira et al. 2005); (2) the herd size and the sugarcane area were jointly and gradually increased, and the pasture area decreased accordingly, until there was no more pasture surplus available. The herd then was composed of 60 cows and 70 heifers and calves (Table4).
This first balance was presented to F1 and the changes required in his farm by such a configuration were discussed with him. The extra expenses linked to the following items were estimated and included in the scenario: (1) rotating and fertilizing pastures in order to attain 75 t GM/ha/year, (2) recruiting an extra employee to cover the workload, (3) renting
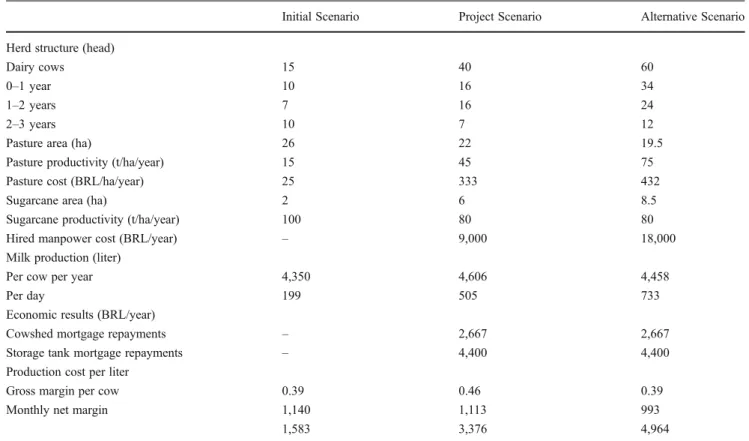
Table 4 Combination of input data used in the three strategies simulated for farm 1 and simulation results
Initial Scenario Project Scenario Alternative Scenario Herd structure (head)
Dairy cows 15 40 60
0–1 year 10 16 34
1–2 years 7 16 24
2–3 years 10 7 12
Pasture area (ha) 26 22 19.5
Pasture productivity (t/ha/year) 15 45 75 Pasture cost (BRL/ha/year) 25 333 432
Sugarcane area (ha) 2 6 8.5
Sugarcane productivity (t/ha/year) 100 80 80 Hired manpower cost (BRL/year) – 9,000 18,000 Milk production (liter)
Per cow per year 4,350 4,606 4,458
Per day 199 505 733
Economic results (BRL/year)
Cowshed mortgage repayments – 2,667 2,667 Storage tank mortgage repayments – 4,400 4,400 Production cost per liter
Gross margin per cow 0.39 0.46 0.39 Monthly net margin 1,140 1,113 993
1,583 3,376 4,964
Initial Scenario current configuration of farm 1, Project Scenario herd size increases until 40 cows, Alternative Scenario herd size increases until 60 cows
Table 5 Variation of the required areas of sugarcane and required yield and area of pasture in function of sugarcane yield calculated for scenario 40 simulated for farm 1
Sugarcane yield (t/ha) 80 100 120 Required area for sugarcane (ha) 6 4.5 4 Available area for pasture (ha) 22 23.5 24 Required pasture yield (t/ha per year) 45 42 41
pasture from neighbors to offset the area replaced every year in the farm. Then, this scenario provided a 50 % increase of the monthly income compared to the Project Scenario.
This result gave the farmer confidence that his main strategy of developing his dairy activity by increasing his herd should be profitable if he invests enough capital and labor in the business. He already had anticipated this devel-opment since he had just bought a 1,500 l tank that would enable him to stock the 700 l/day that a 60-cow herd could produce. However, the simulations alerted him to the neces-sity of better planning his forage resources according to his expected herd demand, especially if the herd size was in-creased greatly. He intended to refer to the documents sum-marizing the results of the support process conducted with him when he implements his project in the future, while understanding that the quantitative figures included in these documents only indicated trends and did not state the exact results that he would achieve.
A diversity of issues addressed
The approach was tested with five other farmers to cover a diversity of farm contexts, projects and issues to be addressed. Although the sample was small, different strategic orientations were encountered. F1, F2, F4, and F6 clearly orientated their production systems towards dairy specialization and aimed to increase their milk production. Their main issues concerned the balance to be found between forage supply and higher herd demand, and the impacts of such changes on their workload and production costs. These farmers based their project on internal herd growth, but they chose various ways to reach their objectives in terms of forage choice (sugarcane vs silage), pasture management (rotating and fertilization), work organi-zation (hiring more labor or increasing daily work duration), and duration of the growth process. F5 was engaged in a dairy specialization process based on intensification as well, but was ready to consider alternative production options should the price of milk fall too low in relation to the price of concentrates. F3 was concerned by the economic risks linked to a dairy specialization. He wanted to decrease his production costs by increasing his forage autonomy. The following subsections illustrate the kind of results obtained with F3 and F5. Assessing the economic sensitivity of an intensive production strategy
F5’s project consisted of increasing his milk production by slightly increasing his herd size from 27 to 30 cows and by reaching a maximum yield per cow of 7,000 l/year, which would double his current milk production per cow. His feeding system relied on the intensive use of concentrates: 1 kg for 2.5 kg of milk produced. Therefore, his economic results depended closely on the ratio between milk and concentrate
prices. F5 was interested in estimating the sensitivity of his income to these two variables. A range of prices variations were simulated jointly with a range of milk yield for a 30-cow herd. Figure3shows that a strategy combining a high level of concentrate use and high potential milk yield remained profitable with high concentrate prices, as long as the 2009 milk price was maintained. Indeed, even under the worst conditions (concentrate price at 1,100 BRL/t), the monthly net margin exceeded the current one (1,500 and 1,100 BRL/ month, respectively). With the current concentrate price (625 BRL/t), the same monthly income could be maintained even if the milk price decreased to 0.35 BRL/l. The sensi-tivity of these results to milk yield were also estimated by simulating three potential production levels (7,000, 6,000, and 3,000 l/year) and two extreme milk prices (0.30 and 0.64 BRL/l). The concentrate/milk ratio was adjusted to the cow yield potential. The simulation results showed to the farmer the sensitivity of his strategy, which combined high potential yield cows and the intensive use of concentrates, to milk price. Indeed, more extensive strategies (less or no concentrate and lower yield cows) showed better economic results when milk prices were low (Table6).
F5 was very responsive to these results since he never had estimated his costs and incomes before. He concluded that his intensive project was valid as long as milk prices remained high (“In this price context, my objective is to produce milk and I do what is technically required to achieve it”). However, he had to remain alert to changes in both concentrate and milk prices to revise his strategy to-wards lower milk yield objectives or leaving dairy produc-tion for other productive activities.
Improving the forage system autonomy
F3 preferred to maintain a mixed milk–meat production system. His objective was to achieve an output of 200 l per day with about 20 cows while continuing with low cost feeding practices and multipurpose cattle. His project (Project Scenario) con-sisted of increasing his sugarcane area from 1.0 to 1.5 ha. An Alternative Scenario was proposed, based on a forage pattern including his current sugarcane area (1.0 ha) and 3.5 ha of maize silage. Pasture area was reduced accordingly.
The results (Table 7) showed that both the Project and Alternative Scenarios allowed F3 to reach his objective. However, his production costs were lower with the silage option. Indeed, the absence of concentrate purchases largely compensated for the higher variable costs of maize silage. Consequently, the monthly net margin of the silage option was superior despite a lower milk production. These results did not confirm the farmer’s initial impression that he could achieve an equivalent milk production at less cost with the sugarcane option. The discussion, however, did bring to light questions of risk associated with the maize crop due to
climate hazards and the availability of silo loaders that usually were rented from large neighboring farms. Despite the lower cost of the silage option, the farmer preferred to continue a less risky, multi-annual forage crop–sugarcane. Nonetheless, he did not exclude studying the silage option, notably to develop a plan to acquire a collective silage harvester.
Discussion
The lessons drawn from the experimental use of a simulation tool for supporting dairy farmers’ strategic thinking may be divided into outcomes for farmers (what they practically ben-efit from the process) and outputs for researchers in terms of both new knowledge produced and consequences for the development of this support approach (Matthews et al.2011).
Outcomes for the farmers
All the farmers involved in the study appreciated the fact that the initial diagnosis, the issue identification and the prospec-tive process were conducted on a one-to-one basis and
focused concretely on their own actual situation. They also appreciated the systemic view provided by the approach on their farms, which made possible to establish the connection between the different components of the production system, moreover in a manner that was both qualitative (cause and effect relation) and quantitative (calculation of the dimensions of different resources and impact on farm performances). These results were made possible by the transparency of the conceptual model and by its didactic function thanks to the direct action of input variables on the output variables. These modeling choices diminished the “black box” effect of a simulation tool and enhanced its adaptability to various farm-ing contexts (Voinov and Bousquet2010).
Compared to the usual technical advice provided by technicians and veterinarians, the support process allowed farmers to discuss their long-term projects and to compare various options aligned with their objectives. Knowledge drawn from the process varied according to each farmer’s background. Some of them learned about biological princi-ples of cow feeding and techniques that were innovative for them, such as silage. Others were receptive to appreciating the value of planning their activities to balance the supply
Table 6 Monthly net margin according to cow yield productivity and milk price for farm 5
Potential (l/year) Ratio concentrate/milk Milk price (BRL) Net margin (BRL/month)
7,000 1:2.5 0.64 5,355 7,000 1:2.5 0.30 311 6,000 1:5 0.64 4,800 6,000 1:5 0.30 1,104 3,000 0 0.64 2,291 3,000 0 0.30 579 Concentrate price0625 BRL/t 0 1000 2000 3000 4000 5000 6000 20 25 30 35 40 45 50 55 60 Net Margin (BRL/month) Milk price (BRL / 100 l) R$ 500.00 / t R$ 625.00 / t R$ 900.00 / t R$ 1000.00 / t 2009 milk price 2009 Net Margin
Concentrate price (BRL/ton) (2009 price = 625 BRL/ton)
Fig. 3 Variations of monthly net margin according to a range of milk and concentrate prices for a 30-cow herd and an average milk yield of 7,000 l/ cow/year (F5 farm)
and demand of resources, rather than reacting on an ad hoc basis to imbalances met in the course of the year. Some of them expressed interest in starting to record their own data to monitor and evaluate their activities on their own. In this respect the approach contributed to support farmers’ learn-ing by uslearn-ing the means of prospective thinklearn-ing, based on a range of scenarios that were quickly simulated and evaluat-ed (Martin et al.2011).
Outputs for researchers
This study provides insights on how simulation tools may be included in both participatory action research and advisory processes not only to test or promote innovative technologies, but also to help farmers redesign their production systems according to their own objectives. Rather than providing a close representation of reality, the objective is to nourish discussions between the farmer and researcher based on trends calculated for a given scenario, as was carried out by Andrieu and Nogueira (2010). Strategic decisions are taken under many uncertainties that are beyond the farmer's control, such as the economic context and climate. These uncertainties justify basing discussions with farmers on the trends provided by the simulations and on a simplified representation of biophysical processes at the scale of the animal, field, or farm. Discussions are then focused on different elements of a pro-duction system even if all are not taken into account by the simulation tool, such as labor.
DairyMotion allows users to address a large variety of issues, from technical ones such as animal feeding to more long-term ones such as the joint planning of herd dynamics and feeding systems, in a systemic perspective since interac-tions between time horizons and farm elements are taken into account. These properties are critical to adapt the use of the simulation tool to a variety of farmers’ contexts, objectives, and personal views. Indeed, the study conducted in Brazil shows that farmers who appear similar in terms of orientation (dairy specialization) and resources, may take a diversity of paths to reach their objectives depending on how they regard risk, opportunities, or work organization. This approach is useful to better understand farmers’ objectives, strategies and decision-making processes since farmers are encouraged to react to the questions, proposals and simulations results produced during the process in a relatively short time. It also provides the opportunity for researchers to test various tech-nical and organizational options on real farm cases and to collect farmers’ views on these innovations.
Conclusion
The use of a whole farm dairy simulation tool with some smallholder farmers in Brazil shows how such an approach can stimulate farmers’ reflections regarding the future and management of their farms. Indeed, the different steps of the process presented in this paper, from the diagnosis of the
Table 7 Characteristics of the fodder crops and extra use of concentrates for the three strategies simulated for farm 3
Initial Scenarioa Project Scenariob Alternative Scenarioc Sugarcane
Area (ha) 1 1.5 1
Fertilizer in first year (kg/ha) 250 250 250 Productivity (t/ha/year) 80 80 80 Urea mixed with sugarcane (%) 0.3 0.3 0.3 Variable costs (BRL/year) 474 711 474 Maize silage
Area (ha) – – 3.5
Seed (kg/ha/year) 20
Fertilizer (kg/ha/year) 300
Productivity (t/ha/year) 30
Variable costs (BRL/year) 4,533
Extra purchase of concentrate (BRL/year) 6,922 8,928 – Results
Milk production (liter/day) 140 241 230 Production cost (BRL/l) 0.45 0.41 0.37 Monthly net margin (BRL) 694 1383 1586
a
Current configuration of farm 3
b
Dry season feed based on sugarcane + concentrates
initial situation and the formulation of the first scenario to the final discussion, allow each farmer to structure and to clarify his planned project, to compare different solutions, and to broaden the scope of his reflection. The process also enables researchers to gain a better understanding of how each farm functions and to compare the advantages and disadvantages of various technical options that could be adopted on each farm in the future. In this participatory relationship between farmers and researchers, the simulation tool plays a central role by providing both a framework to collect information regarding the farms studied and concrete figures related to each simulated scenario. In order to be clear and transparent for farmers, its design combines objec-tives that are both generic and flexible in use. This is reflected in the representation of a dairy farm's operations that resembles the farmers’ mode of technical-economic reasoning. The next step will consist in transferring the approach to farm advisers and adapting it to their working conditions.
Acknowledgments The authors would like to thank the livestock farmers from Unaí-MG who participated in the study and our col-leagues at Embrapa Cerrados for their welcome and support. We are grateful to Grace Delobel for translating this paper from French to English. This work was partly funded by the Agence Nationale de la Recherche under the Systera Program: ANR-08-STRA-10 (ecological, technical and social innovation processes in Conservation Agriculture).
References
Andrieu, N. and Nogueira, D.M., 2010. Modeling biomass flows at the farm level: a discussion support tool for farmers, Agronomy for Sustainable Development, 30, 505–513.
Basanta, M.V., Dourado-Neto, D., Reichardt, K., Bacchi, O.O.S., Oliveira, J.C.M., Trivelin, P.C.O., Timm, L.C., Tominaga, T.T., Correchel, V., Cassaro, F.A.M., Pires, L.F. and de Macedo, J.R., 2003. Management effects on nitrogen recovery in a sugarcane crop grown in Brazil, Geoderma, 116, 235–248.
Bernard, J., Le Gal, P.Y., Triomphe, B., Hostiou, N. and Moulin, C.H., 2011. Involvement of small-scale dairy farms in an industrial supply chain: when production standards meet farm diversity, Animal, 5, 961–971.
Bood, R. and Postma, T., 1997. Strategic Learning with Scenarios. European Management Journal, 15, 633–647.
Cabrera, V.E., Breuer, N.E., Hildebrand, P.E. and Letson, D., 2005. The dynamic North Florida dairy farm model: A user-friendly computerized tool for increasing profits while minimizing N leaching under varying climatic conditions, Computers and Elec-tronics in Agriculture, 49, 286–308.
Dedieu, B., Aubin, J., Duteurtre, G., Alexandre, G., Vayssières, J., Bommel, P. and Faye, B., 2011. Conception et évaluation de systèmes d’élevage durables en régions chaudes, INRA Produc-tions Animales, 24, 113–128.
Dobos, R.C., Ashwood, A.M., Moore, C. and Youman, M., 2004. A decision tool to help in feed planning on dairy farms, Environ-mental Modelling & Software, 19, 967–974.
Duru, M., Bergez, J.E., Delaby, L., Justes, E., Theau, J.P. and Viegas, J., 2007. A spreadsheet model for developing field indicators and grazing management tools to meet environmental and production targets for dairy farms, Journal of Environmental Management, 82, 207–220.
Foltz, J.D., 2004. Entry, exit and farm size: assessing an experiment in dairy price policy, American Journal of Agricultural Economics, 86, 594–604.
Howden, S.M., Soussana, J.F., Tubiello, F.N., Chhetri, N., Dunlop, M. and Meinke, H., 2007. Adapting agriculture to climate change, Proceedings of the National Academy of Sciences, 104, 19691– 19696.
Korndörfer, G.H. and Pereira de Melo, S., 2009. Effects of phosphorus sources (liquid or solid) on agricultural and industrial sugarcane yield, Ciencas e Agrotecnologia, 33, 92–97.
Le Gal, P.Y., Kuper, M., Moulin, C.H., Sraïri, M.T. and Rhouma, A., 2009. Linking water saving and productivity to agro-food supply chains: a synthesis from two North African cases, Irrigation and Drainage, 58, S320–S333.
Le Gal, P.Y., Dugué, P., Faure, G. and Novak, S., 2011. How does research address the design of innovative agricultural production systems at the farm level? A review, Agricultural Systems, 104, 714–728.
Martha Júnior, G.B., Barioni, L.G., Vilela, L. and Barcellos, A.O., 2003. Área do Piquete e Taxa de Lotação no Pastejo Rotacionado, Embrapa, Comunicado Téchnico 101.
Martin, G., Felten, B. and Duru, M., 2011. Forage rummy: a game to support the participatory design of adapted livestock systems, Environmental Modelling & Software, 26, 1442– 1453.
Matthews, K.B., Rivington, M., Blackstock, K.L., McCrum, G., Buchan, K. and Miller, D.G., 2011. Raising the bar?—The challenges of evaluating the outcomes of environmental mod-eling and software, Environmental Modelling & Software, 26, 247–257.
Moreau, J.C., Delaby, L., Duru, M. and Guérin, G., 2009. Démarches et outils de conseil autour du système fourrager: évolutions et concepts, Fourrages, 200, 565–586.
Nelson, R.A., Holzworth, D.P., Hammer, G.L. and Hayman, P.T., 2002. Infusing the seasonal climate forecasting into crop manage-ment practice in north East Australia using discussion support software, Agricultural Systems, 74, 393–414.
NRC, 2001. Nutrient requirements of dairy cattle, 7th ed. National Academy Press, Washington, DC.
Pedreira, C.G.S., Rosseto, F.A.A., da Silva, S.C., Nussio, L.G., Mor-eno, L.S.B., Lima, M.L.P. and Leme, P.R. 2005. Forage yield and grazing efficiency on rotationnaly stocked pasture of‘Tanzania-1’ Guinea Grass and‘Guaçu’ Elephant Grass, Scienta Agricola, 62, 433–439.
Sraïri, M.T., Eljaouhari, M., Saydi, A., Kuper, M. and Le Gal, P.-Y., 2011. Supporting small-scale dairy farmers in increasing milk production: evidence from Morocco, Tropical Animal Health Production, 43, 41–49.
Vayssières, J., Bocquier, F. and Lecomte, P., 2009. GAMEDE: A global activity model for evaluating the sustainability of dairy enterprises. Part II—interactive simulation of various manage-ment strategies with diverse stakeholders, Agricultural Systems, 101, 139–151.
Voinov, A. and Bousquet, B., 2010. Modelling with stakeholders, Environmental Modelling & Software, 25, 1268–1281.