HAL Id: hal-01523310
https://hal.inria.fr/hal-01523310
Submitted on 30 Jun 2017
HAL is a multi-disciplinary open access
archive for the deposit and dissemination of
sci-entific research documents, whether they are
pub-lished or not. The documents may come from
teaching and research institutions in France or
abroad, or from public or private research centers.
L’archive ouverte pluridisciplinaire HAL, est
destinée au dépôt et à la diffusion de documents
scientifiques de niveau recherche, publiés ou non,
émanant des établissements d’enseignement et de
recherche français ou étrangers, des laboratoires
publics ou privés.
Extending Marking Menus With Integral Dimensions:
Application to the Dartboard Menu
Mathieu Nancel, Michel Beaudouin-Lafon
To cite this version:
Mathieu Nancel, Michel Beaudouin-Lafon. Extending Marking Menus With Integral Dimensions:
Application to the Dartboard Menu. [Research Report] LRI - CNRS, University Paris-Sud; Inria.
2009. �hal-01523310�
Extending Marking Menus With Integral Dimensions:
Application to the Dartboard Menu
ABSTRACT
Marking menus have many benefits, including fast selection time, low error rate and fast transition to expert mode, but these are mitigated by a practical limit of 8 items per menu. Adding hierarchical levels increases capacity, but at the ex-pense of longer selection times and higher error rates. In this paper we introduce Extended Marking Menus, a variant of marking menus that increases their width without sacrificing performance. Extended marking menus organize the items in several rings or layers. Selection is achieved by simulta-neous control of direction, as in traditional marking menus, and another dimension such as distance, speed or pressure. We examine the design space of these new menus and study the Distance Extended Marking Menu, or Dartboard Menu, in more detail. We report on two experiments, one to cali-brate the sizes of the rings, the other showing that it performs faster than the Zone and Flower menus but is less accurate than the Zone menu.
ACM Classification Keywords
H.5.2 Information Systems: Information Interfaces and Pre-sentation – User Interfaces, Input Devices and Strategies Author Keywords
Dartboard menus, Marking Menus, Gestural interactions, Pen-based interactions, Fitts’ Law
INTRODUCTION
Marking menus are radial menus that support both novice mode and expert mode by introducing a delay between trig-gering the menu and displaying it. Novice users wait for the menu to be displayed and point at the selected item, as with Pie menus [3], while expert users simply mark ahead right after triggering. Marking menus have many well-known ben-efits over classical linear menus, including a fast selection time that is independent of the item being selected, a low er-ror rate and a fast and natural transition to expert mode [7, 8]. These benefits are mitigated however by a practical limit
Submitted to CHI 2009
Figure 1. Example of a selection in a Distance Extended Marking Menu with 3 levels and 20 items in novice mode.
of 8 items per menu to ensure high performance. This is clearly insufficient for applications such as Microsoft Word or Adobe Photoshop [2]. Hierarchical marking menus pro-vide an increased capacity, but at the expense of longer se-lection times and higher error rates. They also require to organize the set of items in a hierarchical structure, which is not always appropriate.
We propose to extend the capacity of marking menus with-out sacrificing performance by using additional dimensions to select an item. We introduce Extended Marking Menus as marking menus with additional rings or layers. The selec-tion of an item consists of the combinaselec-tion of a direcselec-tional stroke, as with traditional marking menus, and the simulta-neous specification of the ring or layer using an additional input dimension. This additional dimension can be a quan-tized continuous input such as distance, pressure or velocity, or a discrete one such as a key on the keyboard or the num-ber of fingers on a multitouch device. Figure 1 shows an example of a Distance Extended Marking Menu (DEMM), also known as a Dartboard menu [6].
The key point in the design of Extended Marking Menus is that the two (or more) dimensions used to specify an item must be integral [5]: the user must be able to control them simultaneously and the selection action must be compatible with motor memory, i.e. users should be able to memorize the selection action so that they can reproduce it without any visual support. We claim that this key difference with most other designs will keep the main benefits of marking menus in terms of performance and transition to expert mode. After a review of related work, we describe the design space for Extended Marking Menus and explore a number of di-mensions that could be used. We then focus on the Dart-board menu, where the length of the selection stroke is used to specify the ring containing the item being selected. We
Mathieu Nancel Michel Beaudouin-Lafon
Univ. Paris-Sud & CNRS, INRIA Univ. Paris-Sud & CNRS, INRIA
Orsay, France Orsay, France
report on a first experiment designed to calibrate the sizes of the rings of the Dartboard menu, and a second experi-ment comparing the Dartboard menu with Zone menus and Flower menus, both of which extend the width of marking menus. We found that the Dartboard menu was the fastest, although it had a higher error rate than the Zone menu. We also provide evidence that the selection gesture for the Dart-board menu is not an aimed movement, as with pointing, but a more ballistic type of gesture. We conclude with some directions for future work.
RELATED WORK
The original work on Marking Menus showed that they can be up to 3.5 times faster than linear menus [8] and that they support an easy transition from novice mode to expert mode [12]. It also showed that performance degrades when menus have more than 8 items [7]. The solution to increase capacity is to use hierarchical menus, but the compound marks that are then necessary to select items in submenus are notably slower than the straight marks of single-level menus. Multi-Stroke menus [16], which replace the compound marks by a series of straight marks, are faster than the original design but still much slower than single-level menus.
Zhao et al. [15] proposed two designs to extend the capacity of marking menus: Zone Menus and Polygon Menus. Both use the relative positions of several quick gestures (a tap fol-lowed by one or more strokes). With this tap-and-stroke se-lection method, the maximum capacity of these menus is 16 items for Polygon menus and 32 items for Zone menus with one stroke following the tap, even more with two strokes. The performance of both designs is better than hierarchical Marking menus for capacities greater than 8 items. Polygon menus are slightly faster than Zone menus, but contain fewer items. The main issue with these techniques is that a selec-tion needs at least two gestures, which makes them slower than other single-gesture menus. Moreover, Polygon menus do not support the grouping of items, which has been found to hinder learnability in expert mode when compared with, e.g., linear menus [2].
The Flower menu [2] is a Marking Menu that takes into ac-count the curvature at the end of the selection gesture. By distinguishing three curvature levels to the left and to the right of the normal straight selection line, the capacity of the menu can be multiplied by 7, therefore reaching 56 items for a single-level menu. Flower menus also naturally sup-port the grouping of items around each of the 8 main items. While the Flower menu is very efficient, Viviani et al. [14] have shown that, depending on the curvature radius, a curved gesture is slower to draw than a straight one, so the selection time is not constant across items.
The use of other dimensions to increase the input vocabu-lary is not new. Ramos et al.’s work on Pressure widgets [10] is directly related to our work, as it includes a Pres-sure menu that takes into account the stroke orientation and four types of pressure profiles (combinations of high and low pressure) during the gesture. This design increases the ca-pacity of Marking menus by a factor of 4, maybe more if
more profiles or pressure levels can be used. Unfortunately Pressure menus have not been evaluated yet.
The term Dartboard menu is reported by Kurtenbach in his Ph.D. thesis [6], but we have found no formal study of it. The Bullseye menu [4] is similar in that it adds concentric item rings around a circular menu, but it has been specif-ically designed for non-visual menus. The principle is to provide users with an auditive or tactile feedback to notify them when they cross a ring edge. Users can therefore count the feedback stimuli to know where they are in the menu. In summary, while a number of designs have been proposed to increase the capacity of Marking menus, the use of ex-tra dimensions for selecting menu items seems largely unex-plored.
EXTENDED MARKING MENUS
The design of Extended Marking Menus is based on the ad-dition of a discrete number of rings or layers, which we call
collectively levels1 from now on, to extend their width. In
order to keep the performance benefits of Marking Menus, the key point of the design is to use an input dimension that is
integralwith orientation to specify the level. In other words,
the user will specify the selected item by entering both the direction of a stroke and another input channel or dimen-sion simultaneously. Jacob et al. [5] have shown the poten-tial performance advantage of integral over separable input control. Adding an independent input dimension or channel does not guarantee that users can perform the task in an in-tegral way. Therefore we need to be careful in our choice of the extra channel or dimension used to select the level and, given the lack of a solid theoretical foundation, we will need to test and fine-tune each combination empirically.
The display of the levels in novice mode is an important as-pect of the design and should match the selected additional dimension or channel used to select the level. We can use either rings, in which case the complete menu is visible at once, or layers, in which case only the level corresponding to the current extra dimension is displayed. More dynamic displays can also be devised that combine the self-revealing aspect of rings with the more compact display of layers. The expected gain of Extended Marking Menus is to sup-port a menu width of 16, 24, 32 or more items depending on the number of levels that can be added, without sacrificing the basic characteristics of Marking menus: self-revealing novice mode, high performance expert mode, smooth tran-sition from novice to expert. In addition, displaying the lev-els as rings or layers provides a natural grouping of com-mands within a level. This should facilitate learning when compared with other wide menus such as Polygon menus. Finally, Extended Marking Menus can be made hierarchi-cal like standard Marking menus, using either a single com-pound mark or a set of simple marks as in Multi-stroke menus, except that the marks must include the control of the addi-tional dimension at each hierarchical level.
1In order to avoid confusion with the levels in a hierarchical menu,
In the rest of this section we explore the design space for Extended Marking Menus by listing the possible input di-mension or channel that could be used to control the level. Distance Extended Marking Menu
The length of a stroke is not used in simple marking menus to specify the selected item. Distance is used however with hierarchical menus to distinguish between, e.g., a North and North-North selection. Distance Extended Marking Menus consist in using the length of the stroke to specify the level. This matches the display of the levels as rings perfectly (Fig-ures 1 and 2): reaching the outer rings requires longer strokes. In addition, length is an inherent dimension of a stroke so it is necessarily integral with direction. This menu design, called the Dartboard menu, is described and evaluated in more detail later in this paper.
Speed Extended Marking Menu
Another continuous dimensions that, like length, is inherent to the specification of a selection mark, is velocity. The max-imum velocity of the gesture could be discretized and used to select the level. The menu would have to be designed so that faster gestures select the most frequent commands. This design requires testing the ability of subjects to reliably con-trol maximum velocity and a proper visual feedback for the levels. Neither the ring nor the layer display seem particu-larly appropriate for this menu. Maybe a secondary cursor that reacts to the gesture velocity could help.
Pressure Extended Marking Menus
Many tablets capture the pressure of the pen but this infor-mation is not used by the various menu techniques, with the notable exception of Pressure Marks [11]. Ramos and Balakrishnan asked participants to draw marks of 3 different lengths along 4 orientations and matching 4 different pres-sure profiles. A prespres-sure profiles is defined by the prespres-sure variation between the start and end of the stroke: high to low, low to high, high to high, low to low. The low error rates in their study show that users are able to perform such composite actions and suggests that pressure and orientation are integral. However the visual stimulus they used in their task does not allow to draw any conclusion about users’ abil-ity to perform these actions without any visual support. The Extended Marking Menus framework includes other uses of pressure. For example, a simpler design consists in using pressure at the end of the gesture only: the level is simply selected by a quantization of the pressure value just before the release. A layer display seems appropriate for this menu: pushing harder reveals the successive layers. A companion note on the Push Menu explores this type of menu.
Tilt Extended Marking Menus
Another dimension captured by modern tablets is the tilt of the pen. As with pressure, discretizing the tilt value at the end of the selection gestures can be used to select the level. The use of tilt has been even less explored than that of pres-sure. An exception is Tian et al.’s Tilt menu [13], however tilt is used in this case to distinguish between a drawing mode and a menu selection mode. There is little doubt that tilt and direction can be specified in an integral way. An open
question however is whether the two dimensions of tilt, i.e. the angle with the z axis and the direction relative to the x axis can be used effectively.
Key Extended Marking Menu
The additional dimensions we have explored so far are all continuous, requiring a discretization to map it to different levels. An alternative solution is to use discrete dimensions. One dimension that is already used with various selection techniques is the keys of the keyboard. They are used for keyboard shortcuts as well as to select among several com-mands available when clicking or dragging. For example, using the Shift modifier key may add to instead than re-place the selection when clicking an icon, or copy rather than move a file when dragging its icon. Keys can be used in a similar way to select the level of an Extended Marking Menu, providing a bimanual menu selection technique. The first level would be selected when no key is depressed, while additional levels would be selected by depressing a key. In expert mode, the key can be hit at any time during the spec-ification of the stroke.
The usual modifier keys (Shift, Control, Alt and Command) would work well with a layer display, where each key (or key combination) reveals a different layer. Some linear menus, e.g. on Mac OS X, have a similar behavior: holding a modi-fier key changes some commands in the menu with a variant, e.g. one that provides additional parameters or, on the con-trary, one that bypasses a confirmation. Regular keys can be used as well such as the function keys, the numeric keys (1, 2, 3) or the alphabetical keys (q, w, e, etc.). In this case a ring display may prove more appropriate, with the rings la-beled with their activation key. Given the number of keys on a keyboard, the potential expansion of the width of the menu is almost unlimited. In practice, it is unlikely that using more than a few keys makes sense.
Finger Extended Marking Menus
The last dimension that we explore here is the use of multiple fingers. Multitouch devices are now getting more common, particularly for portable devices and interactive tables, and multitouch interactions are used on some laptops, e.g. to scroll or resize objects. For menu selection, we can simply use the number of fingers that are in contact with the surface to select the level: stroking with one finger selects level 1, stroking with two fingers selects level 2, etc. One issue is the visual feedback in novice mode when using direct touch, especially on a small device, since the fingers will occlude the menu.
Multiple additional dimensions
In principle any of the above dimensions can be combined to provide even more possibilities. Of course, not every com-bination is practical and probably only a few of them can take advantage of integrality. The above-mentioned study of PressureMarks [11] suggests combining pressure and dis-tance. A combination of two distances and two pressure lev-els seems manageable from a motor memory perspective and would provide a capacity of 32 items.
a) a) b) b)
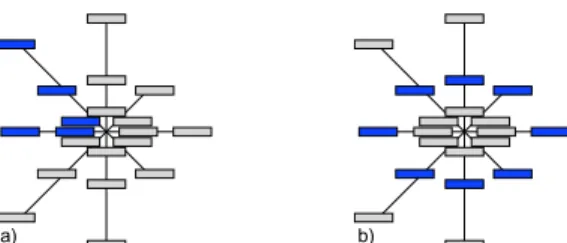
Figure 2. Our design for the Dartboard Menu, with two full levels and a third one containing four items. (a) angular groupings (b) radial group-ing of items
THE DARTBOARD MENU
The Dartboard Menu is a Distance Extended Marking Menu where the levels are displayed as rings (Figure 1). Our im-plementation follows Tapia et al.’s advice [12] and displays only the item labels connected by thin lines that indicate the ideal selection gestures (Figure 2). The active areas for se-lecting the items are the same as with the circular display of the rings. As with traditional marking menus, the outer ring has a semi-infinite size, i.e. there is no upper bound on the length of the selection gesture.
As with classical Marking menus, the Dartboard menu sup-ports novice and expert modes, the cancellation of the cur-rent selection when the user moves back to the center area, and the same principle of hierarchy. It provides the same feedback as Marking menus and is exactly identical to a Marking menu when it has a single level. The layout of the Dartboard menu supports the semantic grouping of items (Figure 2), similar to the Flower menu [2]. Angular group-ing can be used to cluster related commands, while radial grouping can be used to cluster commands according to their frequency or severity, e.g. with less frequent commands or more dangerous ones laid out on the outer rings.
Because of its increased capacity, a Dartboard menu may not be completely full, and the designer may choose to leave some items unused in the various levels. Rather than leav-ing the correspondleav-ing areas empty with respect to selection, we extend the neighboring areas in order to fill the available space (Figure 3). This maximizes the selection area for each item and ensures that the only way to cancel a selection is to move back to the center or hit the Escape key.
The main issue with the design of the Dartboard menu is to determine the sizes of the rings to ensure the efficient selec-tion of items whatever their level. While tradiselec-tional Marking menus support an open loop gesture to select an item, Dart-board menus require additional control of the length of the gesture. The following section describes an experiment that we ran to determine the optimal sizes of the rings for the Dartboard menu.
EXPERIMENT 1: CALIBRATION
The implementation of the Dartboard menu requires a pre-cise knowledge of the number of levels that users can accom-modate and the sizes of each ring. We conducted an experi-ment where the subjects were asked to draw linear gestures with a given orientation and relative length as quickly and accurately as possible. Subjects were not given any actual
a)a)a) b)b)b) c)c)c)
Figure 3. (a) A Dartboard Menu with missing items. (b) The light grey areas are those with no items. The dotted lines show the boundaries for extending the items. (c) The resulting selection areas, which are consistent with the orientations of the items.
distances in pixels, either in text or visually. The goal of the experiment was to find whether subjects were able to main-tain a constant “distance space” in expert mode, depending on the number of levels they were asked to discriminate. Our main hypothesis (H1) was that the task is more diffi-cult when the number of levels increases: reliably differ-entiating 2 lengths is easy, 3 lengths is possible and 5 lengths is probably impossible. We also hypothesized (H2) that the angular error of the user strokes increases with the num-ber of levels.
Apparatus and Participants
The experiment was conducted on an iMac with a 2.33Ghz Intel Core 2 Duo processor running Mac OS X 10.4.1. The subjects used two input devices: an Apple MightyMouse whose acceleration factor was set to the default setting, and a Wacom Cintiq 21-U screen tablet converted into an A3 graphic tablet. The iMac screen resolution was 1680 × 1050 pixels. The experiment was implemented in Java 1.5 using SwingStates [1] and Touchstone [9].
8 volunteers, all right-handed (1 female and 7 males) partic-ipated in the experiment. Two of them were 25, five were between 31 and 35 (mean 33, stdev 1.58), and one was 50. Three subjects had almost never used pen input, the other five had used it occasionally. One subject had never used a gestural or marking interface, three were somewhat familiar with it, and four considered themselves familiar. A coffee was proposed at the end of the experiment.
Design
The subjects were asked to draw strokes with relative lengths (for example “Length 3 out of 5”) without any visual nor tex-tual indication of the actex-tual length. The strokes had 8 possi-ble orientations (N, NE, E, SE, S, SW, W, NW) and were input with either a relative or absolute input device (a mouse or a pen). Trials were grouped into blocks, each one correspond-ing to a specific number of levels (N) from 2 to 5 and input device (D). Each trial was specified by an orientation (O) and a relative length (n) between 1 and N. Factors D and N were counterbalanced across conditions with a Latin square, factors O and n randomly. Each D×N ×O combination was replicated 4 times for each subject, in order to get 4×8 = 32 measures for each combination.
In order for the subjects to get used to the task and to sim-ulate an expert behavior, each block was preceded by 30 training trials. The subjects were free to take a short break between each block. The experiment took about 45 minutes.
Length 3 out of 4
a) b)
Figure 4. Story-board for a trial. The instructions (a) are displayed until the subject drags out of the arrow (b).
In summary, the design was as follows: 8 subjects
× 2 input devices (D)
× 8 orientations (O)
× (2+3+4+5) lengths per block (n)
× 4 replications
= 7168 trials
Stimulus
The instructions were presented as shown on figure 4 (a). The arrow indicated the orientation and the text the rela-tive length of the gesture to be performed. The trial started when the subject pressed the pen or clicked the mouse on the central arrow. The arrow and the textual instructions dis-appeared as soon as the cursor left the arrow (figure 4 (b)). The subject had to drag out of the arrow for the gesture to be accepted, and go to the next trial. There was no feedback other than the trail of the gesture.
Measures
The measures for each trial were :
• the stroke length in pixels (DistancePx), • the stroke duration (Time),
• the subject’s Reaction Time,
• the maximal velocity of the gesture (Vmax),
• the angular difference between the requested orientation and the user stroke orientation (OrientationError), • whether a stroke was rectilinear or not (ShapeError).
OrientationErroris the difference between the angle of the
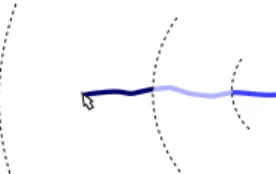
stroke (computed between the first and the last point of the stroke) and the requested orientation (O). A ShapeError is detected when at least one point of the stroke is located more than 15 pixels away from the line going through the end-points of the mark (Figure 5).
At the end of the experiment, the subjects were given a ques-tionnaire to evaluate, using a 5-level Likert scale: a) the dif-ficulty of the tasks for each N and D, b) an evaluation of their own performance for each N and D, c) a ranking of their preference for each N and D. They were also asked to describe in a few words each value of n for each value of N, and to explain their strategy to decide the length of their strokes. The goal was to understand how they mentally vi-sualized the distance levels during the experiment.
Quantitative results
We only report the most important results here with respect to the design of the Dartboard menu.
Figure 5. Example of a shape error.
Errors
98.62% of the strokes Orientation Error were less than π/8, meaning that with an 8-item circular menu there would be less than 2% errors. There is no significant effect on
Orien-tation Errorfor N. There were few Shape Errors. All
sub-jects made fewer than 5% non-linear strokes (mean 2.02%). There is no significant effect for N.
Orientation effects
We found a significant effect for factor O on the Standard Deviation of DistancePx computed for all subjects and each value of D, N, O and n. Tukey HSD tests showed that North strokes (mean 44.01) vary significantly less than East (59.03) and NorthEast ones (60.87) whereas the other orientations stand in between.
Stroke lengths
For each value of N, the number of levels, we computed a set of N − 1 bounds to partition the distance dimension in
N intervals. The bounds were computed so that the ith
in-terval has the maximum number of distances produced by the users when they were asked a length “i out of N ” (figure 6). These bounds allowed us to compute the optimal
cor-respondence ratesfor each condition of the experiment, i.e.
the proportion of strokes drawn in response to a stimulus “i
out of N ” that fall in the ithinterval. Since the subjects were
asked to emulate an expert behavior without any knowledge of the technique nor its parameters, these correspondence rates should not be taken as a prediction of the performance of the Dartboard menu.
N × n : If we compute the bounds without differentiating by Subject nor D (device), the average correspondence rates are given in the following table.
� � � � � � � � � � � � � � � � � � � � � � � � � � � � � � � � � � � � � � � � � � � � � � � �
n = 1
n = 2
n = 3
93 266.5Stroke lengths (pixels)
N um be r of s tr ok es
Figure 6. Bounds for N = 3. The three curves are the distributions of stroke lengths for all users and all input devices, for each value of n. The bounds maximize the number of user-drawn strokes whose length is within the corresponding interval.
N = 2 N = 3 N = 4 N = 5 % match 92% 73% 64% 58% ring 1 130.5 px 93 px 86 px 74 px ring 2 Infinity 266.5 px 212 px 160.5 px ring 3 Infinity 439 px 309 px ring 4 Infinity 526.5 px
D × N × n : If we compute the bounds for the two input devices separately, the correspondence rates do not change by more than ±6%, showing that the bounds can reasonably be the same for both devices.
Subject × D × N × n : If we take each subject
sepa-rately and compute their bounds for each entry device, the average correspondence improvement compared with the N × n condition is 14% (stdev = 8%) for Absolute Device and 16% (stdev = 6%) for Relative Device. The following table shows the average correspondence with the improve-ment from the N × n condition in parenthesis, for each input device. The very high values for N = 2 and N = 3 show that individual users were extremely consistent in partition-ing the distance space for these numbers of levels.
N = 2 N = 3 N = 4 N = 5
Abs. 95%(+3) 90%(+17) 84%(+20) 75%(+17)
Rel. 98%(+6) 90%(+16) 85%(+21) 76%(+19)
Qualitative results
As we hypothesized, the subjects’ ease, preference and esti-mated performance decrease with the number of levels (N). Most subjects found the stylus easier to use than the mouse, but they also estimated that their performance was approx-imatively the same with both of them. Two subjects out of eight preferred the mouse.
The strategies and textual descriptions of the level are con-sistent across most subjects. The most common strategy was to stop the stroke as soon as it crosses the arrow border for length 1 (vocabulary : tick, point, shorter, as short as possi-ble, local, etc.), to draw length 2 strokes a little longer than length 1 (big tick, little stroke, short but not too much, pe-ripheral, etc.), up to touching the screen edge for lengths 5 / 5 and 4 / 4 (full, very long, to the edge, maximum, full length, etc.) and to go a little shorter than the edge for level 4 / 5. Length 3 was generally a compromise in the remaining space for N = 4 and N = 5.
One participant said that he changed his strategy twice dur-ing the experiment, because he felt his first choice was not good enough. Another said that he hesitated during the trials, and that for some values of n he did not have a precise strat-egy for the whole experiment. Several participants said that they separated some levels by differentiating between finger movement, wrist movement and arm movement. This could be a valuable design guideline for future implementations. Final values for the bounds
In order to define the values for the bounds of the Dartboard menu, we decided to remove the trials from the two subjects who had difficulties from the dataset. The average
corre-spondence rates improvements over the D × N × n condi-tion is then 6% (stdev = 2%) for Absolute Device and 8% (stdev = 4%) for Relative Device :
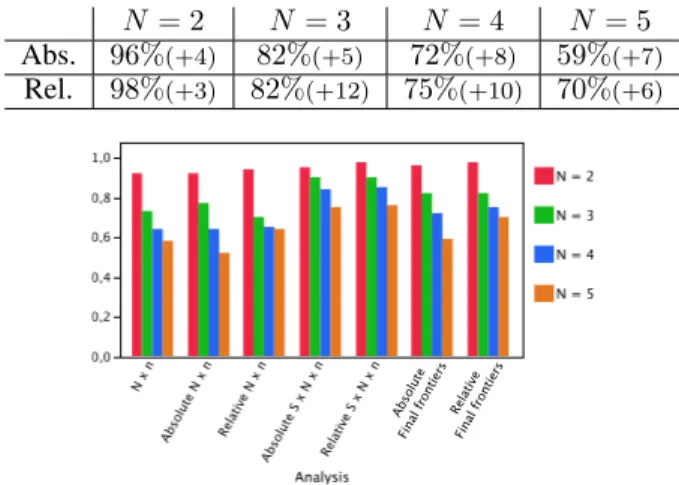
N = 2 N = 3 N = 4 N = 5 Abs. 96%(+4) 82%(+5) 72%(+8) 59%(+7) Rel. 98%(+3) 82%(+12) 75%(+10) 70%(+6) ��� ��� ��� ��� ��� ��� ��� �� ��� ���� ��� ���� ���� ����� ��� �� ��� ���� ���� ��� ���� ���� ���� ���� ��� �� ��� ���� � ���� ����� ���� �� ���� ���� ���� ����� ���� �� �������� ����� ����� ����� �����
Figure 7. Correspondence rates under several conditions for each N . Figure 7 shows the average correspondence rates for each study and each value of N. The table below lists the bounds that we have computed with our modified dataset and that we used in Experiment 2. N = 2 N = 3 N = 4 ring 1 109 px 78.5 px 69.5 px ring 2 Infinity 189.5 px 160 px ring 3 Infinity 316.5 px Kinematic analysis
We ran an ANOVA for each N to assess the effect of the required length n on the maximum velocity, VMax. In each case, there was a significant effect. For N = 2 and N = 3, Student’s t-test showed that Vmax is significantly higher when n increases. Results are similar for N = 4 and N = 5 except that there is no significant difference for n = 2 and n = 3. This means that for menus with 2 or 3 levels, we may be able to use velocity to help discriminate among levels. In order to analyze the kinematic profile of the gestures, we divided each strokes into 20 slices with an equal number of samples and analyzed the mean velocities in each slice. We found that the mean velocity profile can be fit with a degree 4 polynomial (R-Square 0.9986) as illustrated in figure 8. The non-zero velocity at the end indicates that users do not perform a pointing task but that the gesture has some of the characteristics of an open-loop movement.
� ���� ��� ���� � ���� ��� � �� � �� �� � �� �� �� �� � �� � � � � �� �� �� �����
Figure 8. Fitting of users’ strokes point velocities. Discussion
While our hypothesis H1 was supported by the analyses, we found no significant effect of N on Orientation Error and therefore H2 is not supported. This means that the item’s level does not interfere with angular accuracy. The very low rate of orientation errors shows that orientation is not an is-sue for the Dartboard menu.
The correspondence rates show that a 5-level Dartboard menu is unlikely to be practical, while 2- and 3-level ones defi-nitely are. While most subjects preferred the pen, the mouse gave better correspondence rates, indicating that performance may be more reliable with a mouse than with a pen.
Finally the analysis of gesture kinematics indicates that max-imum velocity could be used to improve gesture recognition. EXPERIMENT 2: PERFORMANCE COMPARISON
We conducted a second experiment to compare the expert performance of the Dartboard menu with two other Marking menus with increased capacity from the literature: Flower Menu [2] and Zone Menu [15]. We had four main hypothe-ses for this experiment:
H1 : Dartboard is at least as fast as Flower menu, and faster than Zone menu. This hypothesis is based on the fact that even if a tap-and-stroke gesture is length-independent, and so can be drawn quickly, the whole selection process is slower than a simple stroke, even with a length or curva-ture constraint. We also hypothesize that long gescurva-tures are quicker to perform than curved ones.
H2 : The error rates for the Dartboard menu are lower than the correspondence error rates observed in the first experiment. The subjects in the first experiment did not learn the length space. We expect that even with subject-independent bounds, the ability to learn the bounds will im-prove the error rate.
H3 : Zone Menu has the lowest error rate, especially with 24 and 32 items. Increasing the number of items in a Flower Menu also increases gesture recognition errors while for the Dartboard menu it gets harder to differentiate among the length levels. We expect Zone Menu to have a low error rate independent of capacity.
H4 : There are significantly less length errors in some orientations. Experiment 1 showed that subjects were more precise for length discrimination in certain orientations. We expect this to be confirmed in this experiment.
Apparatus and Participants
The equipment was the same as for Experiment 1, except that we only used pen input.
Twelve right-handed volunteers (3 females and 9 males) par-ticipated in the experiment. Seven were aged 23 to 27 (mean 25.57, stdev 1.51) and five were aged 30 to 35 (mean 32.4, stdev 1.67). 3 subjects had never used pen input, 9 some-times. 2 users had never used gesture or mark-based inter-faces, 5 were somewhat familiar with it, and 5 considered
Figure 9. 16-, 24- and 32-item Zone Menu designs.
Figure 10. 16-item Flower Menu design.
themselves used to it.
Design
The subjects were asked to select items in expert mode with-out having to learn and memorize the item positions. The goal was to evaluate subject performance, not to compare the learning of each technique. We tested 3 menu types each with 3 capacities (width) : 16, 24 and 32, corresponding to a Darboard menu with 2, 3 and 4 levels. We configured the Zone menu so that all items are on the same hierarchical level and can be selected with a tap and a single stroke (fig-ure 9). We config(fig-ured the Flower Menu according to Bailly et al.’s experiment [2] for the 16-items blocks (see Figure 10), and added one item in each orientation for the other two capacities. The gesture database and recognizing algorithm are the same as Bailly et al.’s.
The selections were grouped in blocks, each block corre-sponding to a Technique × Capacity combination. These two factors were counterbalanced using a Latin square so that each subject performed all the blocks for a given ca-pacity in sequence. The target items were randomly dis-tributed within the blocks. Each Technique × Capacity ×
Itemtrial was replicated 3 times for each subject, which gave
us 12 × 3 = 36 measures for each combination.
In order to simulate an expert behavior, each block was pre-ceded by 2×Capacity training trials. The subjects were al-lowed to take a break every 8 trials and between each block. The experimenter spent 5 minutes at the beginning of each run to explain the three menu techniques. Subjects spent 30 minutes on average for the experiment.
In summary, the design was as follows: 12 subjects
× 3 Techniques
× (16 + 24 + 32) selections
× 3 replications
Figure 11. Ring-dependent feedback for Dartboard Menu in expert mode. The ring bounds were not displayed.
a) b)
Figure 12. Instructions and user stroke for a 24-item Dartboard trial. The instructions specify the item located on the second ring to the North
Stimuli
We replicated the Zone and Polygon menus experiment de-sign [15], where instructions were presented apart from the drawing zone. The Dartboard instructions were presented as shown on figure 12 (a), the instructions for Flower Menu and Zone Menu were presented as described in the original experiments ([2, 15]). The instructions disappeared as soon as the selection began. A feedback of the selected item’s ideal gesture briefly appeared after the end of the selection, in order for the subjects to know whether their selection was correct. If the subject selected the wrong item, the trial was nevertheless completed and counted as error.
In our first implementation of the Dartboard menu, in expert mode, the color of the stroke changed according to the ring it was in (Figure 11). Our pilot tests showed that this type of feedback has a negative effect on selection speed since users tend to count the color changes or monitor the last color of the stroke to decide when to end the selection, as with the Bullseye menu [4]. We used a single-color blue feedback in the experiment.
Measures
The measures for each selection were : • user Reaction Time,
• user Selection Time,
• Orientation Error, as in Experiment 1,
• Length Error (Dartboard menu), computed as the differ-ence between the user’s stroke length and the correct stroke length,
• Position Error (Zone menu), computed as the difference between the user’s selected zone length and the correct item’s zone,
• Shape Error: the fact that a stroke is not straight in a Dart-board or Zone menu, or does not have the right curvature in a Flower menu.
Length Erroris zero when the stroke length falls within the
target item level’s bounds, otherwise it is the distance to the closest bound. Shape Error is computed as in the previous experiment for Zone and Dartboard menus.
At the end of the experiment, the subjects were asked to rank the menu techniques, for each capacity, by : a) user prefer-ence, b) perceived easiness, c) perceived efficiency.
Quantitative results
Time
We found a significant effect on Execution Time for
Tech-nique (F2,22 = 66.24, p < 0.0001), Capacity (F2,22 =
12.78, p = 0.0002) and Technique × Capacity (F4,44 =
3.16, p = 0.0228). Tukey HSD tests reveal that Dartboard (mean 258.37 ms) is significantly faster than Flower Menu (319.87 ms), which is significantly faster than Zone Menu (517.26 ms). 16-item menus are significantly faster (337.19 ms) than 24-item (365.95 ms) and 32-item (392.37 ms) menus.
Execution Timedoes not follow Fitts’ law (R-Square = 0.0154).
This means that even when users have to virtually target an area this kind of selection is not a pointing task. It supports the hypothesis that users are performing open-loop gestures, consistent with the result of Experiment 1.
There is a significant effect on Reaction Time for Technique
(F2,22 = 35.09, p < 0.0001) and Technique × Capacity
(F4,43 = 4.66, p = 0.0033). Tukey HSD tests reveal that
Zone Menu (mean 603.54 ms) is significantly faster for
Re-action Timethan Dartboard (820.82 ms) and Flower Menu
(826.65 ms). This could be explained by the small number of training trials: the Zone Menu selection process is easy to learn as it includes only position and orientation, while the Flower and Dartboard menus use length and curvature and may require more practice.
Reaction Timealso increases with Capacity (F2,23 = 6.98, p =
0.0043), and menus with 16 (702.19 ms) and 24 items (736.68 ms) are significantly faster than 32-item menus (812.14 ms). Total Time is computed as Reaction Time + Execution Time.
We found a significant effect for Capacity (F2,22= 10.45, p =
0.0006) and Technique × Capacity (F4,42 = 6.32, p = 0.0004)
but not for Technique alone. Again, 16-item (1039.52 ms) and 24-item (1102.45 ms) menus are significantly faster than 32-item menus (1204.70 ms).
Errors
We considered a trial to be an error if a Shape Error was detected, if the Length Error value non zero, if the absolute
Orientation Error value was larger than π/number of
ori-entations, or if the absolute value of the Position Error was larger than π/number of zones.
We found a significant effect on Errors for Technique (F2,22 =
55.96, p < 0.0001) and Capacity (F2,22 = 5.01, p = 0.0161).
Tukey HSD tests reveal that Flower Menu is significantly less accurate (17.36% missed trials) than Dartboard (10.94%), which is significantly less accurate than Zone Menu (3.47%). Figure 13 shows the means of each error type for each Tech-nique. We can see that Length Error is the main cause of errors for Dartboard (mean 10.49%, stdev 0.31), that Shape
Technique
DartBoard Flower Zone 0,00 0,02 0,04 0,06 0,08 0,10 0,12 0,14 0,16 Mean(Position Errors) Mean(Shape Errors) Mean(Length Errors) Mean(Orientation Errors)
Figure 13. Mean of each error type for each Technique.
11.46%, stdev 0.32) both contribute to Flower Menu errors and that Orientation Error is the main error cause for Zone Menu (mean 3.63%, stdev 0.19).
There is a significant effect on Dartboard menu Errors for
Orientation(F7,77 = 2.74, p = 0.0136). Consistent with
Experiment 1, Student’s t test reveals that orientations North and South have significantly more errors than East,
North-Eastand South-West, with the three other orientations in
be-tween.
For Flower Menu, there is a significant effect of gesture
type (Straight, Bent, Cusped and Pigtail) on Errors (F3,47 =
24.68, p = 0.0001). Bent gestures have the most errors (mean 0.272), then Cusped (0.165), Straight (0.033) and Pigtails (0.028). 54.98% of the Flower Menu errors involved an orientation error of ±π/4, i.e. most orientation errors were to a neighbor direction.
Qualitative results
The means of the subjects rankings for each qualitative crite-rion (Preference, perceived Ease and Efficiency) rank Zone Menu first, Dartboard Menu second and Flower Menu third (figure 14). Dartboard and Zone Menu are tied for first place for Preference and Efficiency with 16 items.
The comments collected at the end of the experiment show that Flower Menu was perceived as the most frustrating tech-nique. Subjects had the impression to fail very often, i.e. they thought that they were making the right gesture but se-lected the wrong item. This was particularly true for Straight and Bent strokes : either the stroke type, orientation or both were misinterpreted. When the orientation was misinter-preted, it was often with the one before or the one after. Some subjects commented that switching their attention be-tween the instructions and the drawing area was disturbing, especially when they tried to understand the reasons why they missed a trial.
Discussion
Errors
The error rate for the Flower Menu was much higher than in the experiment described in [2], and was a source of frustra-tion for the subjects. We offer the following possible expla-nations. First, the gesture database that we used was gener-ated with a mouse, but we used a pen. This means that the recognition algorithm is quite sensitive to the training set.
DartBoard DartBoard
DartBoard
Figure 14. Mean subjective ranking of the 3 techniques for Preference, Ease and Efficiency.
Second, the experiment reported in [2] left the instruction on the screen during the trial, which made the task more of a copy task. We note in particular that our execution times for the Flower Menu with 16 items are half those in [2]. Finally, the stroke recognition algorithm used in [2] uses a different, undocumented technique for computing the stroke angles.
Hypotheses
Our results support H1 if we consider execution time: Zone Menu is significantly slower than Flower Menu, which is significantly slower than Dartboard. Total time however is not significantly different, but this includes the time taken to recognize and interpret the instruction.
H2 is only partially supported. The Dartboard menu’s error rates for capacities 24 and 32 (8.8% and 15.2%) are lower than the equivalent error rates in Experiment 1, computed as 1−Correspondence Rate (18% for 3 levels and 28% for 4 levels). However, the 16-item menu in Experiment 2 ob-tained more errors (8.9%) than the equivalent 2-level condi-tion in Experiment 1 (4%). We expect learning to improve these error rates.
H3 is supported: Zone Menu has significantly fewer Errors for all three Capacity.
H4 is supported: there is a significant effect of Orientation on Errors for Dartboard. This is a useful guideline for im-plementing this technique.
CONCLUSION AND FUTURE WORK
We have introduced Extended Marking Menus, a design space for extending the capacity of Marking Menus by using addi-tional input dimensions or channels that can be controlled by end users simultaneously with the orientation of the stroke. We have listed a number of dimensions that can be used and the corresponding novel menu designs.
We have then described the Dartboard Menu, a Distance Ex-tended Marking Menu that uses the length as well as the orientation of the stroke to specify the items to be selected. A first experiment gave us valuable information to calibrate the menu and confirmed that subjects are able to discrim-inate among up to four levels in a simulated expert mode. The second experiment compared the expert performance of the Dartboard menu with two other designs that also expand the width of marking menus: Zone and Flower menus. The results are very encouraging: they show that the Dartboard menu performs faster than the other two and is well liked by the subjects, especially with 16 items (two levels). However, the Dartboard menu has a higher error rate than the Zone menu, which calls for an improved recognition technique, e.g. using the velocity profile.
This work opens up a number of directions for future work. First the Dartboard menu can be improved and should be fur-ther tested. The Dartboard menu is particularly interesting because it does not require additional hardware to capture the extra dimension: every stroke, whether drawn with a pen, a finger or a mouse, has a length. A number of design issues remain to be solved however. We already mentioned improv-ing the recognition algorithm by usimprov-ing the velocity profile. We could also use machine learning techniques to adapt the bounds to each individual user and input device. Another issue is to refine the design so the menu can be used next to the corners and borders of a screen (a classical problem with Marking menus). Our pilot studies for the first exper-iment indicate that users spontaneously scale their gestures when they are closer to the border. We also need to study the learnability of the Dartboard menu and its performance in novice mode.
Beyond the Dartboard menu, the design space for Extended Marking Menus can be explored further. The various menu designs that we have listed are yet to be developed and tested, and new one can be added. For example, the Flower menu can be considered an Extended Marking Menu where the additional dimension is the shape of the stroke. Using other sensors such as the accelerometer now present in many mo-bile devices opens even more possibilities.
At the theoretical level, we would like to better understand and therefore predict the performance in time and accuracy of the various designs. This is strongly linked with the notion of integrality that we have exploited here but is as yet not well understood.
REFERENCES
1. C. Appert and M. Beaudouin-Lafon. Swingstates: adding state machines to the swing toolkit. In UIST ’06: Proc. User interface software and technology, 319–322. ACM, 2006.
2. G. Bailly, E. Lecolinet, and L. Nigay. Flower menus: a new type of marking menu with large menu breadth, within groups and efficient expert mode memorization. In AVI ’08: Proc. Advanced visual interfaces, 15–22. ACM, 2008.
3. J. Callahan, D. Hopkins, D. Hopkins, M. Weiser, and B. Shneiderman. An empirical comparison of pie vs. lin-ear menus. In CHI ’88: Proc. Human factors in comput-ing systems, 95–100. ACM, 1988.
4. N. Friedlander, K. Schlueter, and M. Mantei.
Bulls-eye! when fitts’ law doesn’t fit. In CHI ’98: Proc.
Human factors in computing systems, 257–264. ACM Press/Addison-Wesley Publishing Co., 1998.
5. R. J. K. Jacob, L. E. Sibert, D. C. McFarlane, and J. M. Preston Mullen. Integrality and separability of input devices. ACM Trans. Comput.-Hum. Interact., 1(1):3–26, 1994.
6. G. Kurtenbach. The design and evaluation of marking menus. Technical report, 1993.
7. G. Kurtenbach and W. Buxton. The limits of expert per-formance using hierarchic marking menus. In CHI ’93: Proc. Human factors in computing systems, 482–487. ACM, 1993.
8. G. Kurtenbach and W. Buxton. User learning and perfor-mance with marking menus. In CHI ’94: Proc. Human factors in computing systems, 258–264. ACM, 1994. 9. W. E. Mackay, C. Appert, M. Beaudouin-Lafon, O.
Cha-puis, Y. Du, J.-D. Fekete, and Y. Guiard. Touch-stone: exploratory design of experiments. In CHI ’07: Proc. Human factors in computing systems, 1425–1434. ACM, 2007.
10. G. Ramos, M. Boulos, and R. Balakrishnan. Pressure widgets. In CHI ’04: Proc. Human factors in computing systems, 487–494. ACM, 2004.
11. G. A. Ramos and R. Balakrishnan. Pressure marks. In CHI ’07: Proc. Human factors in computing systems, 1375–1384. ACM, 2007.
12. M. A. Tapia and G. Kurtenbach. Some design refine-ments and principles on the appearance and behavior of marking menus. In UIST ’95: Proc. User interface and software technology, 189–195. ACM, 1995.
13. F. Tian, L. Xu, H. Wang, X. Zhang, Y. Liu, V. Setlur, and G. Dai. Tilt menu: using the 3d orientation information of pen devices to extend the selection capability of pen-based user interfaces. In CHI ’08: Proc. Human factors in computing systems, 1371–1380. ACM, 2008. 14. P. Viviani and C. Terzuolo. Trajectory determines
move-ment dynamics. Neuroscience, 7:431–437, 1982. 15. S. Zhao, M. Agrawala, and K. Hinckley. Zone and
polygon menus: using relative position to increase the breadth of multi-stroke marking menus. In CHI ’06: Proc. Human Factors in computing systems, 1077– 1086. ACM, 2006.
16. S. Zhao and R. Balakrishnan. Simple vs. compound mark hierarchical marking menus. In UIST ’04: Proc. User interface software and technology, 33–42, New York, NY, USA, 2004. ACM.