HAL Id: cea-02509678
https://hal-cea.archives-ouvertes.fr/cea-02509678
Submitted on 17 Mar 2020
HAL is a multi-disciplinary open access
archive for the deposit and dissemination of
sci-entific research documents, whether they are
pub-lished or not. The documents may come from
teaching and research institutions in France or
abroad, or from public or private research centers.
L’archive ouverte pluridisciplinaire HAL, est
destinée au dépôt et à la diffusion de documents
scientifiques de niveau recherche, publiés ou non,
émanant des établissements d’enseignement et de
recherche français ou étrangers, des laboratoires
publics ou privés.
PWR fleet
G. Krivtchik, C. Coquelet-Pascal, P. Blaise, C. Garzenne, J. Le Mer
To cite this version:
G. Krivtchik, C. Coquelet-Pascal, P. Blaise, C. Garzenne, J. Le Mer. Analysis of uncertainty
propa-gation in scenario studies Surrogate models application to the French historical PWR fleet. GLOBAL
2015, Sep 2015, Paris, France. �cea-02509678�
Analysis of uncertainty propagation in scenario studies:
Surrogate models application to the French historical PWR fleet
Guillaume Krivtchik1*, Christine Coquelet-Pascal1, Patrick Blaise1, Claude Garzenne2, Joël Le Mer2 1Atomic Energy and Alternatives Energies Commission,
CEA, DEN, Cadarache, DER, F-13108 Saint-Paul-lez Durance, France
2EDF R&D, 1 Avenue du Général de Gaulle, BP408, F92-141 Clamart, France
*guillaume.krivtchik@cea.fr
Abstract –Nuclear scenario studies simulate the whole fuel cycle over a period of time, from
extraction of natural resources to geological storage. They enable the comparison of different strategies related to the reactor fleet evolution, fuel cycle materials management, etc. based on criteria such as the installed capacity per reactor technology, mass inventories and flows, in the fuel cycle as well as in the waste. Several sources of uncertainty have an impact on the scenario results, such as nuclear data and industrial parameters. Nuclear data uncertainties propagate in the scenario along the isotopic chains through depletion, cooling and fuel equivalence models, while industrial parameters impact directly the fuel cycle facilities, such as the plutonium and minor actinides recovery rates at the reprocessing plant or the spent fuels burnup. A method dedicated to uncertainty propagation in scenario studies based on a Monte-Carlo approach and surrogate models was developed.In the present study, the uncertainty propagation methodology is applied to the French historical PWR fleet, up to 2010.
I. INTRODUCTION
Nuclear scenario studies simulate the whole fuel cycle, from extraction of natural resources to geological storage, over an extended period of time. They are a powerful decision-support tool enabling the comparison of different strategies related to the reactor fleet evolution, fuel cycle materials management, etc. based on criteria such as the installed capacity per reactor technology, mass inventories and flows, in the fuel cycle as well as in the waste. Nuclear scenarios are also a key factor in the industrial process, as they are used for the dimensioning of future potential nuclear fuel cycle facilities.
Scenario calculations are performed with COSI [1], a scenario code developed by the CEA Nuclear Energy Division (DEN) that models any type of fuel and facility, and tracks the nuclides of interest throughout the fuel cycle. COSI models dynamic scenarios with time-dependent input and output, thus modelling transition periods. Depletion and cooling computations in COSI are performed via CESAR [2], the AREVA La Hague reprocessing plant reference depletion code, developed by CEA DEN.
Several sources of uncertainty have an impact on the scenario results, such as nuclear data and industrial parameters. Nuclear data uncertainties propagate in the scenario along the isotopic chains through depletion, cooling and fuel equivalence models, while industrial parameters impact directly the fuel cycle facilities, such as the reprocessing plant plutonium and minor actinides recovery rates or the spent fuels burnup.
The uncertainty associated with scenario results is difficult to predict because different effects merge in such calculations. Reactor-wise or facility-wise effects (burnup uncertainty, fuel fabrication time, etc.) and global effects (nuclear data uncertainty) not only affect the reactors’ mass balances, but also global fuel cycle data (separated plutonium stock or minor actinides inventories, etc.), resulting from the summation over several facilities Furthermore, some effects are expected to be nonlinear, such as the burnup impact on the spent fuel isotopic composition; and thresholds (lack of fresh fuel due to fabrication time bias, depletion of a given stock) may have a somewhat unpredictable impact without proper calculation.
From an uncertainty propagation point of view, the main characteristics of the system are its high number of
parameters associated with an uncertainty value, the lack of analytical expression of the results and the high CPU time of a simulation.
A new methodology was developed in order to perform uncertainty propagation in the nuclear fuel cycle. This methodology is described in section II.A The methodology is based on the use of depletion surrogate models, whose construction is presented in section II.B. Afterwards, an application of the method to the current French fleet is shown in section III.
II. UNCERTAINTY PROPAGATION METHODOLOGY
II.A. Description of the method
The cornerstones of COSI are its physical models: cooling, depletion and equivalence (i.e. fresh fuel enrichment as a function of the isotopic vector). The simulation is in continuous time but the different steps, such as reactors loading, are discontinuous (batchwise) in order to model accurately the industrial processes. Stochastic uncertainty propagation methods seem well suited to complex problems such as scenario studies: sampling the input parameters according to their distribution, with consideration of proper correlation between parameters, and analyzing the system output (variance, correlations, etc.) provides information concerning uncertainty propagation in the system. This method does not require hypotheses or physical simplification of the model, and is well adapted to interaction analysis between the different variables.
One of the main drawbacks of this method is the computational time, due to high the number of evaluations required to compute variance, or other results of interest, with a satisfying precision. It is difficult to assess such number, but it increases with both the number of parameters and the complexity of the system. In a scenario computation, many parameters are associated with an uncertainty. These parameters include nuclear data (cross-sections, fission yields, etc.) which are used for depletion and equivalence models; as well as scenario parameters for fuel, reactors and plants description. The total amount of parameters is over 200, and the non-linearity of the output in function of the input indicates that the number of runs must be at least on the same order of magnitude as the number of parameters.
In the case of recent scenario studies, COSI run time is between several hours (computation of mass balances) to more than 24 hours (inventories). The calculation time
heavily depends on the scenario complexity, the level of detail, and the scenario duration (generally more than 150 years). Taking into account the fact that COSI computations cannot be distributed (i.e. several simultaneous runs on the same workstation) in the general case due to overlapping of simultaneous runs and very high memory needs, we obtain unreasonable uncertainty propagation timescales. Therefore, it is necessary to develop a method to speed up such computation.
Surrogate modeling is an expanding field of statistics, and its application in physical studies is rapidly increasing, as their use speeds up the computations. The direct application of surrogate models to scenario studies with COSI is tempting. For instance, one could construct a generic surrogate model which estimates any scenario output in function of the input data. However, the enormous amount of input data in a single scenario and the high non-linearity of many effects discourage this approach. Another method would be construction of a surrogate model modeling the scenario family in the direct vicinity of a given scenario. However the construction of a surrogate model for each scenario and its vicinity would be as computationally intensive as a direct stochastic uncertainty propagation computation, thus rendering useless the surrogate model method.
On the contrary, a sub-model approach gives promising results. The principle is to identify time-consuming sub-models in the code (such as depletion in the case of a scenario code) and to replace them with surrogate models. Decomposition of the simulation steps shows that approximately 99% of the CPU time results from depletion and cooling sub-models, both sharing approximately 50% of the total CPU time. One scenario computation requires, in terms of order of magnitude, 104
depletion and 105 cooling computations. The approach for
these two sub-models is different. In the case of the cooling models, simplified analytical solutions of Bateman cooling equations were used in replacement of iterative (Runge-Kutta) method so as to speedup this step, reducing it to a negligible CPU time.
In the case of the depletion sub-model, a surrogate-model based approach was used. The principle is to build a set of surrogate models, estimating the spent fuel isotopic composition in function of fresh fuel composition (235U
enrichment, Pu content and isotopic vector, etc.) and irradiation parameters (burnup, specific power, etc.). Several nuclear data perturbations (cross-sections, fission yields) were also added as parameters in order to perform nuclear data uncertainty propagation.
Figure 1 illustrates the differences between the COSI-CESAR (COSIC) scheme and the new COSI-Surrogate models (COSI-S) scheme. In both cases, COSI evaluates the depletion parameters for each depletion calculation (black frames). In the COSI-C scheme (blue frames), every depletion computation is performed with CESAR, while in the COSI-S scheme (red frames), the depletion computations are performed with CESAR surrogate models. The surrogate models construction process is described in section II.B. CESAR cooling model is also replaced with Bateman cooling equation analytic solutions. With implementation of depletion surrogate models in COSI, different stochastic uncertainty propagation analyses can be performed.
II.B. Depletion surrogate models
The methodology is based on the construction of CESAR-based depletion surrogate models that estimate the spent fuel isotopic composition as a function of the different parameters described below. The first step is the determination of the domain of validity for each surrogate model. The CESAR domain of validity is very wide, but it is divided according to the fuel type (PWR, SFR fuel, etc.), the fuel form (oxide, metal, etc.) and the fuel assembly geometry (number of pins per assembly, spacing, etc.). Each of these domains is associated with the same set of burnup-dependent energy-integrated cross-sections, which are calculated with neutron transport codes such as APOLLO2 [3] or ERANOS [4] using JEFF-3.1.1 [5] nuclear data.
Such domains were cut in two sub-domains in function of the burnup (low burnup, nominal and higher burnup) to define the surrogate models domain of validity. Consequently, the surrogate models are defined in a domain Dijkl defined as the combination Dijkl = {fuel type i
∩ fuel form j ∩ geometry k ∩ burnup domain l}, and there are as many surrogate models as Dijkl domains required to
model every scenario of interest. Cutting the domains in function of the burnup was based on the observation that burnup often has a highly non-linear impact on the spent fuel isotopic composition. As a consequence, reducing its domain of variation for a given surrogate models simplifies its parameterization and reduces the lack of fit.
The surrogate models estimate the spent fuel isotopic composition calculated with CESAR. This depletion code computes approximately 300 heavy nuclides, fission products and activation products. However, it is not necessary to produce an estimator for each and every nuclide in spent fuel in the frame of scenarios studies, as most of the nuclides do not contribute significantly to fuel cycle indicators, such as decay heat. Consequently, a shortlist of nuclides of interest, contributing to heavy nuclides mass (in particular Pu and minor actinides) and spent fuel decay heat, was determined through sensitivity studies. Only the nuclides belonging to this list are estimated. The heavy nuclides estimated by the surrogate models are the following: 234,235,236,238U, 237,239Np, 238,239,240,241,242Pu, 241,242M,243Am, 242,243,244,245,246Cm. The
fission products taken into account are 85Kr, 90Sr, 90Y, 95Zr,
95Nb, 106Ru, 106Rh, 134,137Cs, 137MBa, 144Ce, 144Pr, 147Nd, 147Pm, 154Eu. These nuclides represent more than 98.5% of
decay heat for spent fuel between 1 and 50 years after unloading, for the fuels of interest in scenario studies [6] (PWR UOX / MOX / ERU1, SFR). It is important to note
that although other nuclides are not estimated by the surrogate models, they are still taken into account during the irradiation computation. For instance, 239U concentration in spent fuel is not estimated, but it still contributes to 239Pu production in the depletion
computation.
Different types of estimators were tested, including linear regressions, low-degree polynomial regressions [7] and artificial neural networks. The estimators were built using URANIE [8], the CEA/DEN statistics toolbox. The complete surrogate model construction process is summarized in Figure 2. First, the input parameters are sampled. The set of sampled input parameters is called design of experiments (DOE). Usually, the sample size is 5000 for construction and 5000 for validation. Then, in the surrogate model construction process, regression techniques such as least squares are applied to produce different types of estimators, described hereafter.
COSI-C
Depletion input parameters
CESAR Surrogate models COSI
Scenario code
COSI-S
Cooling input parameters
Iso. comp. estimation Isotopic composition
CESAR Analytic cooling Isotopic composition Isotopic composition
Three estimators were tested. First, multiple linear regressions were constructed. Such estimators are easy to comprehend and manipulate. Let 𝑐 be the concentration of a given nuclide in the spent fuel (SF), and ĉ its estimator. The expression of a multiple linear regression is given in equation (1). The 𝑎𝑖 are real constants, 𝑛 is the number of
parameters. The 𝑥𝑖 are the estimator’s parameters: burnup,
specific power, fresh fuel isotopic composition, nuclear data perturbations.
ĉ({𝑥𝑖}) = 𝑎0+ ∑𝑛𝑖=1𝑎𝑖𝑥𝑖 (1)
Then, low degree multiple polynomial regressions were tested. Their expression for the concentration of a given nuclide in spent fuel is written in equation (2).
ĉ({𝑥𝑖}) = 𝑎0+ ∑𝑖=1𝑛 𝑎𝑖𝑥𝑖, + ∑ 𝑎𝑖∏ 𝑥𝑗 𝑞𝑖𝑗 𝑚 𝑗=1 𝑝 𝑖=1 (2)
The ai are real constants and qij integers such that
∑𝑚𝑗=1𝑞𝑖,𝑗≤ 3∀(𝑖, 𝑚) (the maximal polynomial degree is
3). After a linear regression, monomials (𝑎𝑖𝑗∏𝑚𝑗=1𝑥𝑞𝑖𝑗) are
added one by one, until the estimator reaches a given quality criterion. In expression (2) there are p monomials.
A third regression technique tested in the frame of depletion surrogate models is the construction of artificial neural networks (ANN). Their generic expression is given in equation (3). S is the activation function defined in equation (4). The number of neurons in the hidden layer H equals 7 in this work, result obtained via an optimization
study. N is the dimension of {𝑥𝑖} (i.e. the number of
parameters), 𝜆𝑖 and 𝜔𝑖𝑗 are real constants.
ĉ({𝑥𝑖}) = 𝜆0+ ∑𝐻𝑖=1𝜆𝑖𝑆(𝜔0𝑖+ ∑𝑁𝑗=1𝜔𝑖𝑗𝑥𝑖) (3)
𝑆(𝑥) =1+𝑒1−𝑥 (4) Once the surrogate model is created, it is necessary to test it. The results of the surrogate models and CESAR are compared on a test sample, independent from the training sample. Detailed explanations concerning the validation process are given in references [6, 8, 9]. Table I shows qualitative a results obtained with these estimators in
different situations A, B, C, D described below.
A: the only parameters are the fresh fuel isotopic composition. Depletion parameters and perturbations are not taken into account.
B: fresh fuel isotopic composition and depletion parameters are taken into account.
C: fresh fuel isotopic composition, depletion parameters and cross-sections perturbations are taken into account.
D: fresh fuel isotopic composition, depletion parameters, cross-sections and fission yields perturbation are taken into account.
TABLE I
Qualitative analysis of the different estimator types Estimator A B C D Multiple linear regression Multiple polynomial regression Artificial neural network The lack of fit of multiple linear regressions discourages their use in uncertainty propagation studies. Multiple polynomial regressions reproduce the impact of burnup, however they are not suited to describe system with many input parameters, as it is the case in depletion computations with perturbed nuclear data. Furthermore, their time-consuming construction process discourages their use in practice. Finally, artificial neural networks give satisfactory results in the most complex cases, which justify the choice to use them in our study.
An analysis showed that the speedup due to surrogate model use in COSI is superior to 500b, and the RAM
reduction factor resulting from the shortlist of nuclides of
a Quantitative validation data cannot be summarized in a table as
many indicators are used (prediction coefficient, relative error, absolute error, etc.) and many estimators have to be tested, however complete quantitative validation data is provided in reference [6].
b The speedup does not take into account the surrogate model
construction and validation process. However, the surrogate models are widely reusable. CESAR URANIE Construction DOE CESAR Construction DOE + CESAR output URANIE URANIE Test DOE CESAR CESAR Test DOE + CESAR output URANIE Validated SF concentration estimators SF concentration estimators
Computation Data feed
… …
interest is greater than 3 in complex simulations. Consequently, the new computation scheme based on surrogate models is adapted to perform distributed stochastic uncertainty propagation in scenario studies.
III. UNCERTAINTY PROPAGATION IN A SCENARIO COMPUTATION
III.A. Description of the scenario
The aim of this work is to perform uncertainty propagation in the French historical PWR fleet. The simulation begins with the starting of the Fessenheim power plant in 1978, and the fleet is modeled until 2011. UNGG reactors such as EDF1, EDF2 and EDF3 in Chinon, EDF4 and EDF5 in Saint-Laurent, as well as Bugey1 are not taken into account. Due to the high irregularity of Phénix and Superphénix irradiation cycles, those reactors were not directly modeled, but the associated output mass balances were taken into account as spent fuel stocks.
The 58 PWR and their succession of loadings are modeled. In 2010, the fleet is composed of 6 CP0 (900MWe), 28 CPY (900MWe), 20 P4 and P’4 (1300 MWe) and 4 N4 (1450 MWe). PWR UOX fuel is loaded in CP0, CPY, P4 and P’4 cores; PWR MOX fuel is loaded in 20 CPY cores (the MOX fraction is 30%); and PWR ERU fuel is loaded into two CPY. Figure 3 corresponds to the state of the fuel cycle as of 2010, modeled in COSI.
The fleet model was designed as close as possible to the available data as of 2012. The reactors characteristics taken into account are the first grid connection date, the year-integrated load factors, the reactor yields, the time-dependent irradiation cycle length, the succession of loadings and the changes in the operating fuel cycle.
The following fuel characteristics were also taken into account: batch-wise fresh fuel composition (235U enrichment and U vector for PWR UOX and ERU; Pu content and isotopic vector for PWR MOX); batch-wise burnup; batch-wise minimum cooling time before reprocessing.
Concerning the fabrication plants characteristics, the fuel fabrication time and the heavy metal losses were considered. Finally, in the reprocessing plant, the reprocessing time and strategy, the time-dependent heavy metal capacity, and the heavy metal losses were taken into account.
III.B. Nuclear data uncertainties
Nuclear data have an impact on the physical models used in scenario studies. In particular, the depletion model
requires accurate nuclear data in order to calculate adequately the spent fuel composition.
In this study, cross-sections uncertainties are taken into account. As CESAR does not support multi-group crosssections, but only considers energy-integrated crosssections, the CESAR-based surrogate models
parameterization is limited to energy-integrated cross-sections as well.
Scenario studies include different types of reactors associated with different spectra. However, energy-integrated cross-sections uncertainties depend on the spectrum and are different in different reactors. For instance, 239Pu capture cross-section energy-integrated
uncertainty is different in a PWR UOX and in PWR MOX core. Nevertheless, although their uncertainties are different, those two energy-integrated cross-sections are likely to be correlated, because of the similarities between PWR UOX and PWR MOX spectra.
A methodology adapted to calculation of energy-integrated cross-sections uncertainties and correlation of energy-integrated cross-sections was developed in a previous work [6], producing energy-integrated cross-sections covariance matrices. First, the CADTUI [10] code runs NJOY [11] on an ENDF B-VII [12] evaluation file and computes a 26-groups covariance matrix. Then, the covariance matrix is condensed into one-group standard deviations and correlations in spectra of interest, calculated with APOLLO2 in the case of thermal spectra and ERANOS for fast spectra. The condensation process is based on conservation of reaction rates uncertainty and reaction rates correlation between different spectra.
Table II illustrates the example of 239Pu
energy-integrated covariance matrix associated with PWR UOX and PWR MOX spectra. RSD stands for the relative standard deviation, and the values in the table are Figure 3: French fuel cycle as of 2010 modeled in COSI
correlation indices. We observe that the 239Pu fission
cross-section in PWR UOX and MOX are highly correlated (0.99), the fission and capture in PWR UOX are anti-correlated (-0.52), the fission in UOX and the capture in MOX are anti-correlated (-0.42), etc. Such covariance matrices were produced for 234,235,236,238U, 237,237Np, 238,239,240,241,242Pu, 241,242M,243Am, 242,243,244,245,246Cm as well
as several fission products, for which only capture cross-section covariance matrices were necessary. The complete set of energy-integrated inter-spectra covariance matrices used in this work is available in reference [6].
TABLE II
239Pu energy-integrated covariance matrix
It has to be noted that in this study, only cross-sections uncertainty were taken into account. Tools dedicated to fission yields uncertainty propagation were also implemented, but not used in this work. The uncertainties associated with other nuclear data, including branching ratios, are not taken into account yet.
III.C. Comparison of COSI-CESAR and COSISurrogate models results
The last step before uncertainty propagation is the comparison of the results obtained via COSI-C with the results obtained via the new COSI scheme based on surrogate models, COSI-S, when both are applied to the same scenario. The surrogate models only impact the isotopic composition, and have no effect on results independent from isotopy such as spent fuel masses.
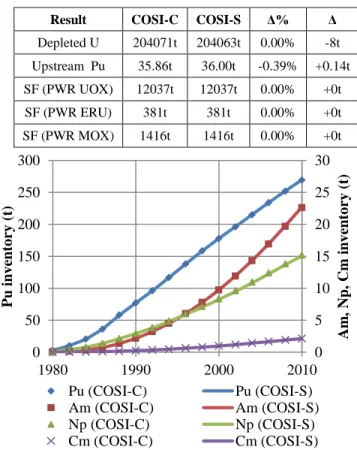
We define the upstream plutonium as the sum of the separated plutonium stocks at the reprocessing plant and MOX fabrication plant, and the plutonium in fresh MOX fuel that has not been loaded yet. Table III summarizes the discrepancies between COSI-C and COSI-S calculated on December 31st 2010 for different scenario results: the
depleted uranium, the upstream plutonium and the spent fuel mass in the pools and the reprocessing plant. Δ% is the relative bias calculated as (Δ% = COSI-S / COSI-C -1) and Δ is the bias calculated as (Δ = COSI-S – COSI-C). We observe that the bias between COSI-C and COSI-S is
very low for the available plutonium: less than 0.5%. The bias for depleted uranium is also very low, as depleted uranium is not highly impacted by biases in the spent fuel isotopic composition. The spent fuel inventories are not impacted by the depletion model, consequently the bias between COSIC and COSI-S is null.
We define the global inventories as the summation of the mass of a given element over all reactors, stocks and facilities in the fuel cycle, including waste storage. Figure 4 represents the Pu and MA global inventories calculated as a function of time with COSI-C and COSI-S. The bias resulting from surrogate models is very low: inferior to 0.2% for Pu at any date, 0.5% for Am, and 1.6% for Np. The bias is higher for curium at the beginning of the scenario, mostly because the first spent fuel had a relatively low burnup, where curium formation is very non-linear, thus difficult to predict with estimators, but very low. The curium global inventory bias drops below 2% in 1998 and keeps decreasing afterwards. Consequently, the inventories are calculated accurately with the COSI-S scheme, and it is relevant to use COSI-S in such scenario studies.
TABLE III
Comparison of COSI-C and COSI-S results on 12/31/2010
Figure 4: Pu and minor actinides inventories calculated with COSI-C and COSI-S
0 5 10 15 20 25 30 0 50 100 150 200 250 300 1980 1990 2000 2010 Am , Np, Cm inv ent o ry ( t) P u inv ent o ry ( t) Pu (COSI-C) Pu (COSI-S) Am (COSI-C) Am (COSI-S) Np (COSI-C) Np (COSI-S) Cm (COSI-C) Cm (COSI-S)
Result COSI-C COSI-S Δ% Δ
Depleted U 204071t 204063t 0.00% -8t Upstream Pu 35.86t 36.00t -0.39% +0.14t SF (PWR UOX) 12037t 12037t 0.00% +0t SF (PWR ERU) 381t 381t 0.00% +0t SF (PWR MOX) 1416t 1416t 0.00% +0t
Further tests are performed in references [6,8] including sensitivity indices and predictive relevance, showing that COSI-S is able to perform accurate stochastic uncertainty propagation computations.
III.D. Calculation of the scenario results uncertainty due to nuclear data
A straightforward uncertainty propagation method is used: capture and fission cross-sections are sampled with URANIE according to the energy-integrated covariance matrices, to produce N sets of perturbed cross-sections. In our study, N=2000 and the sampling technique is Latin Hypercube Sampling (LHS). Then, N scenario calculations are run, each one with a different set of perturbations, and their results are stored. It is important to note that the same set of perturbations is used in all the depletion calculations of one scenario. Finally, the variance and other uncertainty propagation indicators associated with the results are calculated.
Figure 5 illustrates the Pu and MA global inventories relative standard deviation as a function of time calculated with COSI-S. First, we observe the magnitude of the standard deviation: it is approximately 1.5% for Pu, 3% for Am and Np, and 10% for Cm.
III.D. Comparison of COSI results and inventories
The Plutonium uncertainty is particularly low. A variance decomposition analysis performed in reference [6] showed that in PWR UOX and MOX spectra, most of the Pu mass balance uncertainty in a depletion computation results from the 238U capture and Pu capture and fission
cross-sections, which are generally well-known.
The neptunium uncertainty is slightly higher, and stabilized after 1995. An analysis showed that the uncertainty of the neptunium inventory, mainly composed of 237Np, comes from the 236U capture cross-section, whose
uncertainty is relatively high. The Am uncertainty has the same order of magnitude as the Np. The 241Am uncertainty
mostly results from its own capture cross-section’s uncertainty, while 243Am results from 242Pu capture
uncertainty.
The Cm uncertainty is much higher: approximately 10%. The Cm isotopes are obtained through successive capture reactions, all of them subject to uncertainty. Furthermore, the fission cross-sections of the isotopes leading to curium also introduce uncertainty into the curium inventory. A variance analysis showed that 242Cm
uncertainty mostly comes from 241Am capture
cross-section uncertainty while 244Cm uncertainty results from 242Pu and 243Am capture cross-sections uncertainty.
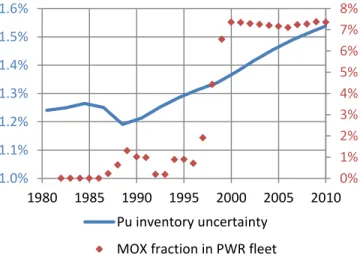
Finally, we also remark that while Am and Cm uncertainties tend to decrease over time and Np uncertainty is stabilized, the only element whose uncertainty increases over time is plutonium. Plutonium is the only recycled element in this scenario, while the MA stay in spent fuel storage or in the waste. Figure 6 illustrates the plutonium global inventory relative standard deviation (RSD) and the MOX fraction in the PWR fleet (calculated as the sum of MOX fuel in core divided by the sum of fuel in core over the fleet). It appears that the plutonium inventory RSD is rather stable before 1988, and increases after 1988 corresponding to the first MOX loadings in French PWR reactors. Consequently, Pu recycling may increase the Pu relative uncertainty over time.
Figure 6 : Pu relative standard deviation and MOX fraction in the PWR fleet 0% 2% 4% 6% 8% 10% 12% 1990 1995 2000 2005 2010
Inventory relative standard deviation
Pu
Am
Np
Cm
Figure 5: Pu and minor actinides inventories relative
standard deviations 0% 1% 2% 3% 4% 5% 6% 7% 8% 1.0% 1.1% 1.2% 1.3% 1.4% 1.5% 1.6% 1980 1985 1990 1995 2000 2005 2010 Pu inventory uncertainty
A linear fit (r2=0.993) of global Pu inventory
uncertainty on the stabilized period [2000,2010] shows that the relative standard deviation grows approximately by 0.017% per year. If the fleet stays identical and the uncertainty grows at the same rate until 2100, then the relative standard deviation in 2100 is approximately 3%.
The reduction of Am and Cm uncertainty over time is more difficult to explain, however we can provide elements of interpretation. At the beginning of the scenario, most of the Am and Cm inventory was produced in PWR UOX, while later on it mostly originates from PWR MOX, since those cores produce more MA. As a consequence, the uncertainty associated with MA around 1990 solely depends on the MA mass balance uncertainty in PWR UOX reactors, while it mostly depends on PWR MOX reactors in 2010. Therefore the reduction of the uncertainty could originate from the transition from PWR UOX MA balance uncertainty to PWR MOX MA balance uncertainty.
IV. CONCLUSIONS
In this work, we developed a new uncertainty propagation methodology for scenario studies. The method relies on depletion surrogate models in order to calculate the spent fuel composition in every depletion computation in a scenario. Surrogate models estimate the concentration of 19 actinides and 15 fission products in spent fuels. Those models also manage nuclear data so that nuclear data uncertainty propagation is possible, and must be supplied with energy-integrated fission and capture cross-sections perturbations. The estimators, composing the surrogate models, are constructed as artificial neural networks, an estimator structure that allows modeling non-linear functions of several interacting parameters. The implementation of this sub-model approach in the new COSI-S scheme provides a speedup superior to 500, thus allowing stochastic uncertainty propagation computations on complex scenarios.
The uncertainty propagation method was tested on a scenario modeling the historical PWR French fleet. This scenario models every French PWR reactor and fuel cycle plant from the commissioning of Fessenheim 1 in 1978 until 2012.
The first step is to determine the bias caused by surrogate models. Several scenario results of interest, such as plutonium and minor actinides inventories, spent fuel inventories, upstream plutonium stock and depleted uranium, are tested. The conclusion is that surrogate models generate a very slight bias in several scenario results, depending on the fuel isotopic composition, such as Pu and MA inventories. Other results such as spent fuel
inventories are independent from the isotopic composition; consequently surrogate models have no impact on them.
Then, the cross-sections uncertainty propagation computation in the scenario is performed. As surrogate models only accept energy-integrated cross-sections perturbations, the covariance matrices must be integrated over spectra of interest to provide energy-integrated spectrum-dependent cross-sections perturbations and energy-integrated inter-spectra cross-sections correlations. In this work, covariance matrices were produced from ENDF B-VII evaluation files.
The cross-sections uncertainty propagation is performed in the scenario modeling the historical PWR fleet. First, the uncertainty associated with the plutonium and minor actinides inventories are calculated. The uncertainty is very low for the global plutonium inventory: approximately 1.5% and slightly increasing over time. In the case of neptunium and americium, the relative standard deviation is higher and stable: approximately 3%. Finally, in the case of curium, the uncertainty is much higher: over 10% during most of the scenario.
The global plutonium inventory is the only inventory whose uncertainty is growing over time. Analysis of the uncertainty shows that this uncertainty begins to increase when the first Pu recycling in PWR MOX is performed. Consequently, reprocessing seems to generate uncertainty in the fuel cycle. An extrapolation of the uncertainty shows that the Pu inventory relative standard deviation may approach 3% in 2100 if the fleet remains identical. The uncertainty associated with inventories of elements that are sent to waste (Am, Np, Cm) appears to be over time.
It has to be noted that this uncertainty propagation does not take into account several sources of nuclear data uncertainty, such as fission yields or branching ratios. These parameters may be taken into account in further studies.
The next step of the study shall provide more information concerning the industrial parameters uncertainty propagation. For instance, the burnup uncertainty was not taken into account in this study, however its impact on depletion computations is very important. Consequently, it appears necessary to compute scenario results uncertainty due to burnup. Industrial parameters associated with an uncertainty may also include losses at the fabrication and reprocessing plants, fuel fabrication time, etc.
NOMENCLATURE ANN Artificial neural network COSI-C COSI-CESAR scheme
COSI-S COSI-Surrogate models scheme DOE Design of experiments
ERU Enriched reprocessed uranium IP Irradiation parameters LHS Latin hypercube sampling MA Minor actinides
RAM Random access memory RSD Relative Standard Deviation
REFERENCES
1. R. ESCHBACH, M. MEYER, C. COQUELET-PASCAL, M. TIPHINE, G. KRIVTCHIK and C. CANY, “New developments and prospects on COSI, the simulation software for fuel cycle analysis”;
GLOBAL 2013 (2013).
2. J.M. VIDAL, R. ESCHBACH, A. LAUNAY, C. BINET and J.F. THRO, “CESAR5.3: an industrial tool for nuclear fuel and waste characterization with associated qualification”, WM2012 Conference (2012).
3. A. SANTAMARINA, D. BERNARD, P. BLAISE, L.
ERRADI, P. LECONTE, R. LE TELLIER, C. VAGLIO and J.F. VIDAL, “APOLLO2.8: a validated code package for PWR neutronics calculations”.
Advances in Nuclear Fuel Management IV (2009).
4. G. RIMPAULT, D. PLISSON, J. TOMMASI, R. JACQMIN, J.M. RIEUNIER, D. VERRIER, and D. BIRON, “The ERANOS Code and Data System for Fast Reactors Neutronic Analyses”, Proc. of PHYSOR
2002 (2002).
5. A. SANTAMARINA, D. BERNARD, P. BLAISE, et.
al., “The JEFF-3.1.1 Nuclear Data Library, JEFF Report 22, Validation Results from JEF-2.2 to JEFF-3.1.1”, Technical report, OECD (2009).
6. G. KRIVTCHIK, “Analysis of uncertainty propagation in nuclear fuel cycle scenarios”, Thèse de doctorat de
l’Université de Grenoble (2014).
7. G. KRIVTCHIK, C. COQUELET-PASCAL, P. BLAISE, C. GARZENNE, J. LE MER and D. FREYNET, “Development of Depletion Code Surrogate Models for Uncertainty Propagation in
Scenario Studies”, Joint International Conference on
Supercomputing in Nuclear Applications and Monte Carlo 2013 (2013).
8. F. GAUDIER, “URANIE: the CEA/DEN uncertainty and sensitivity platform”, Procedia Social and
Behavioral Sciences, volume 2, pages 7660-7661
(2010).
9. D. FREYNET, C. COQUELET-PASCAL, R. ESCHBACH, G. KRIVTCHIK and E. MERLE-LUCOTTE, “Multiobjective Optimization for Nuclear Fleet Evolution Scenarios Using COSI”, Proceedings
of GLOBAL 2015 (2015).
10. G. NOGUERE and J.C. SUBLET, “A nuclear data oriented interface code for processing applications”,
Annals of Nuclear Energy, 35:2259-2269 (2008).
11. R.E. MACFARLANE and A.C. KAHLER, “Methods for processing ENDF B-II with NJOY”, Nuclear Data
Sheets, 11:2739-2890 (2010).
12. M.B. CHADWICK, M. HERMAN, P. OBLOŽINSKÝ et. al., “ENDF/B-VII.1 nuclear data for science and technology: Cross-sections, covariances, fission product yields and decay data”, Nuclear Data Sheets,