HAL Id: hal-01517988
https://hal.archives-ouvertes.fr/hal-01517988
Submitted on 29 Jan 2021HAL is a multi-disciplinary open access archive for the deposit and dissemination of sci-entific research documents, whether they are pub-lished or not. The documents may come from teaching and research institutions in France or abroad, or from public or private research centers.
L’archive ouverte pluridisciplinaire HAL, est destinée au dépôt et à la diffusion de documents scientifiques de niveau recherche, publiés ou non, émanant des établissements d’enseignement et de recherche français ou étrangers, des laboratoires publics ou privés.
GoldHelix: Gold Nanoparticles Forming 3D Helical
Superstructures with Controlled Morphology and Strong
Chiroptical Property
Jiaji Cheng, Guillaume Le Saux, Jie Gao, Thierry Buffeteau, Yann Battie,
Philippe Barois, Virginie Ponsinet, Marie-Hélène Delville, Ovidiu Ersen,
Emilie Pouget, et al.
To cite this version:
Jiaji Cheng, Guillaume Le Saux, Jie Gao, Thierry Buffeteau, Yann Battie, et al.. GoldHelix: Gold Nanoparticles Forming 3D Helical Superstructures with Controlled Morphology and Strong Chirop-tical Property. ACS Nano, American Chemical Society, 2017, 11 (4), pp.3806-3818. �10.1021/ac-snano.6b08723�. �hal-01517988�
GoldHelix: Gold Nanoparticles Forming 3D
Helical Superstructures with Controlled
Morphology and Strong Chiroptical Property
Jiaji Cheng, 1 Guillaume Le Saux, 1 Jie Gao, 1 Thierry Buffeteau, 2 Yann Battie,3 Philippe Barois,4 Virginie Ponsinet,4 Marie-Hélène Delville, 5 Ovidiu Ersen,6 Emilie Pouget 1* and
Reiko Oda 1*
1 Chimie et Biologie des Membranes et des Nanoobjets (CBMN), CNRS - Université
Bordeaux - Bordeaux INP, UMR5248, Allée St Hilaire, Bat B14, 33607 Pessac, France
2
Institut des Sciences Moléculaires (ISM), Université Bordeaux-CNRS UMR 5255, 351 Cours de la Libération, 33405 Talence, France
3 Laboratoire de Chimie et Physique - Approche Multi-échelles des milieux Complexes,
(LCP-A2MC), Université de Lorraine, 1 Boulevard Arago, 57078 Metz, France.
4
Centre de Recherche Paul Pascal (CRPP), CNRS-UPR 8641, Avenue du Dr Albert Schweitzer, 33600 Pessac, France
5
Institut de Chimie de la Matière Condensée de Bordeaux (ICMCB), CNRS-UPR9048, 87 avenue du Dr. A. Schweitzer, 33608, Pessac, France
6
Institut de Physique et de Chimie des Matériaux de Strasbourg, UMR 7504 CNRS–Université de Strasbourg, 23 Rue du Loess, 67034, Strasbourg, France
ABSTRACT.
Plasmonic nanoparticles, particularly gold nanoparticles (GNPs) hold a great potential as structural and functional building-blocks for 3D nano-architectures with specific optical applications. However, a rational control of their assembly into nanoscale superstructures with defined positioning and overall arrangement still remains challenging. Herein, we propose a solution to this challenge by using as building blocks, 1) nanometric silica helices with tunable and well-defined handedness and sizes as a matrix and 2) GNPs with diameter varying from 4 to 10 nm, in order to prepare a collection of helical GNPs superstructures (called Goldhelices hereafter). The resulting nanomaterials exhibit well defined arrangement of GNPs following the helicity of the silica template. Strong chiroptical activity is evidenced by circular dichroism (CD) spectroscopy at the wavelength of the surface plasmon resonance (SPR) of the GNPs with a dimensionless anisotropy factor (g-factor) of the order of 10-4, i.e. ten-fold larger than what is typically reported in the literature. Such CD signals were then simulated by using a coupled dipole method. This approach, which considers each GNP as a dipole, describes the dipolar interactions between nanoparticles. The simulated CD signals fit very well with the experimental data demonstrating the validity of this approach. Meanwhile the measured signals are 1 to 2 orders of magnitude lower than the simulated signals which is explained by the disordered GNPs grafting, the polydispersity of the diameters of GNPs as well as the dimension of the nanohelices. Also, some effects which are not taken into account in the simulations, such as multipolar effects observed in closely packed GNP structure and the image dipole effects induced by the presence of the silica surface may also have effects on the measured CD intensity. These Goldhelices based on inorganic templates are much more robust thanpreviously reported organic-based chiroptical nanostructures making them good candidates for complex hierarchical organization, providing a new promising approach for light management and new benefits in applications such as circular polarizers, chiral metamaterials or chiral sensing in the visible range.
KEYWORDS
: Chiral nanostructures, chiroptical properties, circular dichroism of plasmon, gold nanoparticles, plasmonic nanoparticles, silicaINTRODUCTION:
The unique physical properties of noble metal nanoparticles with controlled arrangements have attracted significant interest in both fundamental science and nanotechnology. When closely assembled, their localized surface plasmon resonances (LSPR) are coupled, resulting in the enhancement of the electric field in the gap between the adjacent nanoparticles.1-3 Such systems are attractive candidates for the amplification of optical signals for fluorescence4-5 or Raman scattering.6-8 In the case of helically organized gold nanoparticles (GNPs), or metal surfaces with chiral motifs, interesting chiroptical properties can be obtained.9-18 These assemblies of nanoparticles offer a promising approach in designing novel artificial materials exhibiting unique chiral properties. The targeted properties can be a large angle of rotation of linear polarization across thin films19, the generation of circularly and elliptically polarized waves, or the generation of materials with a very high dispersion of refractive indices (for a review, see [ref 20]). Most of the examples of such materials found in the literature are obtained through top-down processes, whereby the chiral patterns are obtained using highly sophisticated lithography techniques.9, 21-23 Powerful as they are, these techniques are costly, time consuming, limited to small surface areas and difficult to implement below submicron range.20 By contrast, the nano-structures obtained through bottom-up approaches24 are suitable for a larger scale production with limited technological investment. Generally, self-assembled plasmonic nanostructures with chiroptical properties can roughly be divided into two groups; one is based on hybrid systems consisting in the association of chiral molecules with achiral plasmonic NPs where the plasmon–exciton interaction is considered as the origin of the induced chirality as extensively studied over ten years.23, 25-28 The other one is based on
superstructures with chiral configurations in which the plasmon-plasmon interactions of the plasmonic building blocks are the driving force for chiroptical activity.28 The collective localized properties, the tunable chiral arrangements of metal nanoparticles and the resulting induced chirality of assembled plasmonic nanostructures are often studied using a well-defined particle number in order to figure out the mechanism for the observed optical activities. Pairwise dimers29-32 or clusters with a defined number of nanoparticles such as pyramids33-34 or tetramers35-36 are considered promising candidates as assembled chiral plasmonic basic units. More complex structures such as helices10, 37-38 are treated as higher-ordered superstructures with enhanced collective effects with particle-particle interactions, i.e. the CD signal corresponding to the plasmon-plasmon interaction of the GNPs can appear whereas in simpler systems, only the optical activity corresponding to the molecules attached to the GNPs can be measured. Kuzyk et al.,12 for example, both experimentally and theoretically demonstrated the potential of DNA templates for the programmable design of helical plasmonic nanostructures at the nanoscale precision. Collective plasmon-plasmon interactions of the GNPs were suggested as the origin of chirality, and the authors suggested that the splitting between the longitudinal and transversal modes of the incident light was due to the plasmonic dipole interactions of GNPs within the helix, resulting in positive-negative or negative-positive line shape of the CD spectrum. Meanwhile, the examples of assembled plasmonic nanostructures with defined induced chiral particle-particle interactions are much fewer and less described due to their complexity, the weak systematic control over the synthesis and the lack of, a priori, theoretical analysis. Reports on self-assembly of
fibers,16, 39 helices10-15, 26, 40-41 and films.42 Liz-Marzan and co-workers43 reported 3D chiral nanostructures consisting of gold nanorods and anthraquinone-based oxalamide fiber templates with an anisotropy factor g = 0.022.
However, most of the reported nanostructures obtained with such approaches are based on organic biomolecular scaffolds such as DNA11-12, 37, 44-46 or peptides10, 41, 47-48 which generally suffer from structural vulnerability to chemical, mechanical and thermal perturbations. Such bio-molecules also suffer from structure modification when concentrated, leading to a strong limitation for the construction of a large scale hierarchical 2D or 3D superstructures, which are potentially very interesting since such superstructures can enhance the chiroptical properties of the individual building blocks in specific directions.49-50 Robust alternatives to 3D anisotropic organic scaffolds to organize NPs are therefore desirable in order to fulfil nanophotonic materials design. In this context, the use of colloidal inorganic chiral nanostructures (for example twisted or helical nanoribbons with controlled lengths) as templates to organize the GNPs is described to form a sustainable alternative for new chiroptical materials with interesting optical properties such as giant optical activity or circular dichroism.51-52
We have previously reported the synthesis of silica nanohelices,53-54 using cationic bis-quaternary ammonium gemini surfactants55 of chemical formula C2H4-1,2-((CH3)2N+C16H33)2, noted hereafter 16−2−16, which self-assemble to form
nanometric helical structures with well controlled dimensions in the presence of tartrate counterions, (helical pitch, diameter and length).56-58 The resulting organic nanohelices were used as templates for the sol-gel condensation of a tetra alkoxysilane to obtain silica
nanohelices (See scheme 1 for a depiction of the stepwise approach to obtain GNP-decorated functionalized inorganic nanohelices, i.e. the Goldhelices). After grafting with gold nanoparticles, it was observed that these hybrid systems exhibited a Surface Enhanced Raman Scattering (SERS) effect.59
Herein, we report a facile template–assisted method to fabricate a series of GNPs (4-10 nm) organized onto the surface of a nanometric functionalized helical silica substrate, denoted as
Goldhelix, in which the plasmonic chirality is induced by the chiral arrangement of the
nanoparticles. The plasmon-plasmon coupling between neighboring helically distributed GNPs induces a circular dichroism (CD) signal, which is strongly dependent on the GNPs size, the adsorption density, as well as the surface properties of both the silica helices and the GNPs. We anticipate that this assembly strategy based on nanoparticles and nano-templates will pave the way to rationally design a variety of superstructures for light management systems such as metamaterials.60
Scheme 1. Schematic representation of the Goldhelix synthesis. Gemini surfactant self-assemble to form nanometric helices. These organic helices are used as templates for sol-gel condensation to obtain silica nanohelices which are functionalized so that they exhibit attractive interaction with GNPs.
The effects of the GNP radius and arrangement on the circular dichroism are investigated through simulations based on coupled dipole method (CDM). We clearly show that the circular dichroism increases with the GNP size. In addition, it is observed that the disorganization and the density of GNP systems have a significant impact on the magnitude of the circular dichroism. These simulations provide some clues to improve the circular dichroism of GNP systems.
RESULTS:
Generally, GNPs are produced by the reduction of chloroauric acid (HAuCl4) with a
reducing agent (RA) forming seeds as nucleation centers. To control the particles’ size and prevent their aggregation, stabilizing agents (SA) with high affinity for the GNP surface are usually added. In the present study, various reducing agents such as sodium borohydride (NaBH4) and tannic acid (TA), and stabilizing agents such as tri-sodium citrate and tannic acid
were used to synthesize GNPs in order to tune the size of the particles as well as their surface reactivity. GNPs ranging between 5 nm and 10 nm diameters were synthesized for the following reasons:59 (i) only GNPs larger than 4 nm can provide useful optical properties as smaller GNPs do not generate a collective surface plasmon excitation; (ii) meanwhile, too big
GNPs (> 10 nm) lead to inhomogeneous adsorption of GNPs with respect to the diameter of the helical ribbons (~36 nm), thus no chiral arrangement is observed. The details of the synthesis are reported in Method Section. It has recently been shown that GNPs stabilized with charged organic ligands can exhibit unique properties,61 such as high stability and versatile functionality based on the properties of the ligands. An interesting example is that of ligand exchange using carboxyl terminated mercapto-oligo(ethylene glycol), henceforth referred to as HS-PEGn-COOH. The surface density of grafted HS-PEGn-COOH was shown to depend only
on the number of EG units in the oligomer; for a given chain length, GNPs exhibit the same grafting density, regardless of the GNP diameter.62 For example for n = 7, this density is reported to be 4.3 ± 0.5 molecules per nm2.63 We have synthesized the GNPs initially stabilized by regular SA such as tri-sodium citrate and tannic acid, then exchanged them with the organic ligand HS-PEG7-COOH. The particles are named as NaBH4-GNPs or TA-GNPs (depending
on the reducing agents) and PEG-NaBH4-GNPs or PEG-TA-GNPs after the ligand exchange.
Along with these GNPs which present negative surface charges, we have also studied positively charged GNPs functionalized with aminopropyltriethoxysilane (APTES). The different types of GNPs were prepared and mixed with SiO2-helix on the one side and silica
nanohelices bearing surfaces modified with amino groups (NH2-SiO2 helix) on the other side.
Table 1. TEM images of Goldhelices with GNPs (obtained using various RAs and SAs), deposited on the surface of bare silica helices or those with amino modified ones. Scale bars are all 100 nm.
APTES-GNPs@SiO2 helix. Following the synthesis described in Method Section,
positively charged APTES-GNPs with a diameter of around 4 nm are obtained (Figure S1A). As shown in Table 1 and Figure S1B, these GNPs are densely adsorbed on the SiO2 helices
and only very few non-organized GNPs are still observed. Small UV shifts before and after grafting on helices are observed (519 nm for GNPs to 525 nm for Goldhelix, Figure S1C). Parameters such as the ratio between the APTES-GNPs and the SiO2 helices as well as the pH
of the colloidal solution are of great importance for the density and homogeneity of this grafting (optimization illustrated in Figure S2 and Figure S3). As a result of TEM
observations, the optimal conditions are for pH of 8.0, and a weight ratio between silica helices and APTES-GNPs of 1:8.4 (0.05 mg of silica helices (0.5 mg/ml) for 0.42 mg APTES-GNPs (100 µL, 10.88 µM) in 0.9 mL deionized water).
APTES functionalized SiO2 helix (NH2-SiO2 helix). When silica nanohelices are
functionalized with APTES, they are positively charged, and interact with negatively charged GNPs. The amount of effective amine groups at the surface of APTES functionalized silica helices, NH2-SiO2 helix, was estimated by UV spectroscopy titration (using
4-nitrobenzaldehyde) to be 0.7-1 amine group per nm² (titration detailed in Method Section).
NaBH4-GNPs. These GNPs synthesized by reducing gold salt with NaBH4 and stabilized
with tri-sodium citrate have a diameter 3.5 ± 0.7 nm (Figure S4A). The GNPs are densely adsorbed on NH2-SiO2 helices but also coexist with some random particles. Furthermore,
upon increasing the concentration of the GNPs, the size of the GNPs on the helices increases and becomes heterogeneous indicating a poor stability of NaBH4-GNPs (Table 1, Figure
S4B). A relatively large red shift of the UV-Vis. absorbance is observed upon the grafting and formation of NaBH4-GNPs Goldhelix (from a narrow plasmon band with a maximum at
515 nm for bare GNPs to a broadened band at around 564 nm for Goldhelix (Figure S4C)). After exchanging the ligand with HS-PEG7-COOH (PEG-NaBH4-GNPs), the GNPs
(Figure S4E) seem to exhibit a more homogeneous adsorption at the surface of NH2-SiO2
helix with no obvious random aggregation aside (Table 1, Figure S4F). A smaller red shift UV-Vis. absorbance for Goldhelix than in the previous case is observed for
PEG-NaBH4-GNPs@NH2-SiO2 helix (from 521 nm for the GNPs to 530 nm for the
Goldhelix (Figure S4G)).
TA-GNPs. These GNPs both reduced and stabilized by the mixture of TA and tri-sodium
citrate show very low and inhomogeneous adsorption on NH2-SiO2 helices (Table 1 and Figure
S5) whereas for those stabilized with PEG (PEG-TA-GNPs), for which TA is replaced by HS-PEG7-COOH, a much more efficient adsorption is observed (Table 1 and Figure S6). This
ligand exchange was monitored both by FT-IR-ATR and XPS (Figure S7). The FTIR-ART measurements clearly confirm the disappearance of OH at 3357 cm-1 and increase of CH2 at
2800-2900 cm-1 after ligand exchange proving the replacement of tannic acid by HS-PEG7-COOH molecule which is further confirmed by the high resolution XPS spectrum of
the S2p region showing the presence of sulfhydryl moieties stemming from HS-PEG7-COOH.
The small UV-Vis. absorbance shift observed upon adsorption of TA-GNPs onto silica helices (from 520 nm for 5.4 nm GNPs to 523 nm for Goldhelix) (Figure S5), increases a lot for the PEG-TA-GNPs system (narrow absorption band at around 520 nm for bare GNPs to broad peak at around 565 nm for Goldhelix) (Figure S6).
For the PEG-TA-GNPs, the observed TEM images show that their adsorption on silica helices strongly depends on the composition and the amount of salts (tannic acid salt and tri-sodium citrate as stabilizers and K2CO3 to tune the pH) which are present in the colloidal
solution as summarized in Figure S8. The most homogeneous and dense adsorption of the GNPs on the silica surface was observed when tri-sodium citrate alone was used as a stabilizer.
We investigated the effect of the quantity of the stabilizers in solution on the GNPs adsorption, comparing solutions where either all the stabilizer remained in the solution, or
where 50% or 75% or 90% were removed. As shown in Figure 1, when 75% of the excess stabilizers (tannic acid + tri-sodium citrate + K2CO3) were removed by centrifugation before
ligand exchange by HS-PEG7-COOH, a disordered but quite homogeneously covered surface
was easily observed. Interestingly, when only 50% of the free stabilizers are removed, the TEM images show poorer adsorption of GNPs on the helices (Figure S9). In the meantime, if 90% of the free stabilizers are removed, the GNPs readily form non-organized aggregates besides the silica helices.
Figure 1. (A) TEM images of 5.7 nm Goldhelix, PEG-TA-GNPs@NH2-SiO2 helix, made by
removing 75% of the free stabilizers. TEM tomography analysis of the same Goldhelix: (B) 3D representation obtained by modelling the reconstruction showing that the GNPs are located at the surface of silica helices, Yellow: GNPs, Red: silica helix. (C) Transversal cross-section slice and (D) typical longitudinal slice through the 3D reconstruction.
Thus, it is clear that the quantity of free stabilizers which coexists in solution plays a crucial role for the interaction between the GNPs and helices, the lower the quantity of the remaining stabilizer, the stronger the interactions between the GNPs as well as between GNPs and the silica surface.
Effect of PEG-TA-GNPs diameter. The advantage of the synthetic method using tannic acid
is that it gives a relatively easy access to the control of the GNP diameter in the targeted range between 5 nm and 10 nm by varying the TA concentration in the free solution (Table S1).
In Figure 2, the TEM images of PEG-TA-GNPs with diameter ranging from 5.7 to 9.8 nm adsorbed on the silica helices allow the estimation of the number of GNPs per pitch at the surface of helices: 55 ± 4 for 5.7 nm GNPs, 44 ± 3 for 6.6 nm GNPs, 32 ± 3 for 7.8 nm GNPs, and 27 ± 3 for 9.8 nm GNPs. Although the number of GNPs decreases with increasing the diameter of the GNPs, the volume of gold per pitch increases as the third power of diameter, so that the overall gold coverage of silica helices by GNPs increases with increasing GNP diameter.
Plasmonic CD spectra. Circular dichroism (CD) spectroscopy was employed to examine
the optical activity of these Goldhelices in aqueous suspensions. We focused on the PEG-TA-GNPs Goldhelix systems, with different GNP sizes, which show strong CD signals with sign reversal (Figure 2). Right handed helices exhibit negative and positive (from short to long wavelengths) signals while opposite spectra are observed for the left handed ones, with a sign reversal occurring in the vicinity of the plasmon resonance frequency of the GNPs (~ 550 nm). With increasing GNPs diameters, the amplitude of the CD signals increased and red-shifted.
Figure 2. Goldhelix made using PEG-TA-GNPs with various sizes. Top: representative TEM images of 5-10 nm PEG-TA-GNPs@NH2-SiO2 helix. Bottom: corresponding electronic CD
spectra of the Goldhelices. Dashed lines represent right-handed Goldhelix and solid lines represent left-handed Goldhelix.
Effects of concentration (of GNPs vs Silica) and pH. We evaluated the optimal conditions
for the homogeneous adsorption of GNPs on the silica helices. First, the weight ratio between silica helices and GNPs was investigated. A typical experiment was performed in which 500 µL of 9.8 nm PEG-TA-GNPs (0.015 mg) were prepared, and different amounts of NH2-SiO2-helix were added (See Method section). The results of typical
TEM images and plasmonic CD spectra are shown in Figure S10 for right-handed Goldhelices. Significant bisignate (negative-positive) CD signals were observed for GoldHelix exhibiting homogeneous and dense adsorptions of GNPs for weight ratios of NH2-SiO2–helix to PEG-TA-GNPs between 1.35:1 to 4.05:1 (weight ratio, mg:mg). The
two situations in which the ratio of silica/GNPs is either lower, and the surface of the silica helices is not totally covered, or the ratio of silica/GNPs is higher, and not all the GNPs are grafted to the surface of the silica helices, the CD signal (normalized by the GNPs absorbance) decreased.
We also studied the effect of the pH (between 4 and 5) on the adsorption of GNPs and the resulting CD activity of the targeted Goldhelices. The corresponding TEM images and CD signals are shown in Figure S11. It is clearly observed that for a pH = 4.0 below the pKa ~ 4.2 of the acid groups of the ligands, the GNPs tend to adsorb on the silica surface in a less efficient way, since the protonation of the carboxylate groups decreases the overall surface charge of the GNPs. This is also confirmed by the CD spectrum (pink line) of the Goldhelix which shows a weaker intensity. At higher pH values, around 5.0-5.5 (red and black lines) the strong CD signal correlates well with the TEM images of silica helices densely and homogenously covered by GNPs. The most homogeneous and dense GNPs adsorption is observed at pH = 5.0 along with the highest CD signal.
DISCUSSION
Chiroptical study of silica nanohelices decorated with GNPs. Let us first recall that
GNPs respond to a light illumination by a collective free electron oscillation, which presents a resonance, called localized plasmon resonance (LPR) and is responsible for an intense absorption band in the green. When achiral GNPs are arranged in a chiral configuration, a chiroptical activity may be induced by the plasmonic coupling between the GNPs, and will
therefore occur at the plasmon resonance wavelength. The magnitude of this chiroptical activity depends on the magnitude of the GNPs plasmon resonance and on the strength of the interparticle plasmonic coupling.27 This explains the bisignate CD signals of Goldhelix via the helical arrangement of the gold nanoparticles permitting the propagation of a plasmonic coupling wave along the helical directions, resulting in an enhanced adsorption of the incident light according to the handedness of the Goldhelix.12
As shown in Table 1, only three types of Goldhelices show homogeneous and dense adsorption of GNPs: 1) 4 nm APTES GNPs + SiO2 helices, 2) 3.5 nm PEG-NaBH4-GNPs +
NH2-SiO2 helices and 3) 5 – 10 nm PEG-TA-GNPs + NH2-SiO2 helices. For all these
systems, the plasmon spectra of the GNPs show a red shift after grafting on the silica helices which reveals a coupling between the GNPs as previously illustrated by the observed SERS effect.59 Note that in free suspension, we observe only a minor effect of both size and surface ligand exchange of NPs on their UV-Vis. spectra (Figures S4, S5 and S6), confirming the effect of the self-assembly once on the helices. Indeed, it is well known that the coupling between GNPs is enhanced when GNPs are closely packed, with an interparticle distance comparable to their diameter. In Table 2, the shifts of the UV-Vis. absorbance peak before and after grafting on helices, packing density of GNPs observed by TEM as well as the presence of non-chiral aggregates are summarized. As described above, the red shift upon grafting is the most significant for the PEG-TA-GNPs Goldhelix which show a close packing of GNPs. Meanwhile, smaller UV-Vis. shifts are observed for APTES Goldhelix, NaBH4-PEG Goldhelix and TA Goldhelix. These results clearly confirm the correlation
Table 2. GNPs size (nm), GNPs interparticle distances observed with TEM, UV-Vis shift of plasmon peak upon grafting on silica helices, random aggregates observed by TEM, and CD signal for different Goldhelix systems.
Type of stabilizer GNPs diameter (nm) GNPs interparticle distances UV-Vis. shift GNPs random aggregates CD signal
APTES 4.1 ± 0.5 5.2 ± 3.5 ~ 6 nm Low Low
NaBH4 3.5 ± 0.7 5.6 ± 3.5 ~ 50 nm High Low
PEG-NaBH4 4.0 ± 0.8 2.7 ± 1.1 ~ 9 nm Low Low
TA 5.4 ± 0.5 6.3 ± 0.8 7.4 ± 0.7 9.4 ± 1.0 15 ± 9.0 9.8 ± 4.1 9.7 ± 3.5 7.3 ± 3.0 ~ 3 nm Low Low Low Low Low PEG-TA 5.7 ± 0.5 6.6 ± 0.7 7.8 ± 0.7 9.8 ± 0.8 2.9 ± 0.5 2.8 ± 0.8 2.3 ± 0.3 2.1 ± 0.7 ~ 25 nm ~ 25 nm ~ 45 nm ~ 45 nm Low Low Low Low High (> 3 mdeg)
Interestingly, not all the systems with seemingly closely packed GNPs as observed by TEM show large UV-Vis. shift such as PEG-NaBH4 Goldhelix. Indeed, although the regular
transmission TEM images show close packing (~2.7 nm), the 3D reconstruction images of their Goldhelix show that the mean interparticle distance at the surface of these helices is in fact larger than 4 nm (Figure S4F) compared to much more densely packed for PEG-TA GNPs Goldhelix with 2~3 nm interparticle distances (Figure 1).
Finally, only PEG-TA Goldhelix systems showed significant CD signals (Figure 2). Although, NaBH4 Goldhelix also shows both close packing by TEM and large UV-Vis. shift,
they do not show CD signals. This feature is certainly due to the low UV-Vis. absorbance of the system because of the small size of the NaBH4 GNPs as well as the high proportion of random
It seems, therefore, that the important parameters which lead to high CD signals are, 1) large GNP size, 2) short grafted interparticle distance, and related to this, 3) larger UV-Vis. shift, with 4) the absence of random GNP aggregates. We can clearly see that in the present case, only the PEG-TA GNP systems satisfy these conditions.
Simulated CD spectra
The CD of GNP systems is simulated according to coupling dipole method (CDM). This approach, which requires smaller computational resources than discrete dipole approximation (DDA), can be used to simulate the optical properties of structures composed of a large number of GNPs. Note that CDM is only valid when the distance between nanoparticles is large enough and the nanoparticle size is small enough to neglect multipolar effects. In addition, we do not take into account the presence of silica in the simulations. CDM enables the determination of the extinction cross section (ext) GNP system for a given polarization of
light. The GNP structures are randomly oriented in the solution. To take into account these random orientations, the extinction cross section is averaged over different orientations of the wave vector of the incident light. 30 wave vector orientations are produced by generating 30 equidistant dots on a single octant of a unit sphere. This number of orientations is sufficient to ensure the convergence of the simulated optical properties. The circular dichroism (CD) of the GNP structures depends on the difference between the average extinction cross sections calculated for left and right handed circularly polarized light:
Where N is the concentration of GNP structures in solution. More details about the GNP structures considered in the simulations are given in supplementary materials (Table S2)).
The effect of various parameters affecting the intensity of the CD.
The effect of various parameters on the optical cross section as well as the intensity of CD was investigated using the model described above.
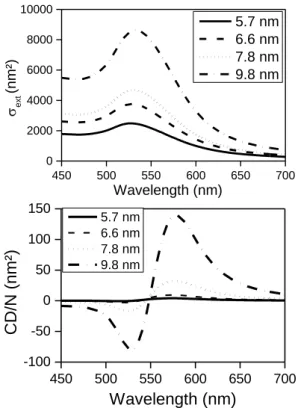
GNPs diameters: as it is shown in Figure 2, the measured optical activities of Goldhelices
bearing GNPs with diameters (5.7, 6.6, 7.8 and 9.8 nm), increase with the GNPs diameter. In Figure 3, the simulation shows the effect of this same range of GNPs diameters. Both the cross section and the CD intensities increase strongly with the increasing GNPs diameters. Both the tendency and the line shape of the CD signal were strikingly well reproduced by the simulation. 450 500 550 600 650 700 0 2000 4000 6000 8000 10000 450 500 550 600 650 700 -100 -50 0 50 100 150 ext (nm² ) Wavelength (nm) 5.7 nm 6.6 nm 7.8 nm 9.8 nm C D /N (nm ²) Wavelength (nm) 5.7 nm 6.6 nm 7.8 nm 9.8 nm
Figure 3. Influence of the GNP radius on (a) the extinction cross section and (b) the CD/N spectra simulated by considering perfectly aligned and monodisperse GNPs.
The experimental molar circular dichroism is defined as
(2)
where is the ellipticity obtained from CD measurement (mdeg), C is the concentration of the smallest chiral unit (mol/L) and l is the path length of the cell (cm). In the present case, it is difficult to compare the simulated CD signals with those obtained from the experiments in terms of the molar circular dichroism, since the concentration C depends on the species considered (GNPs or Goldhelix). Nevertheless, the optical activity of such chiral systems can be determined through the dimensionless Kuhn factor (the so-called g-factor):64
(3) where is the molar absorptivity and A is the absorbance.
In the case of simulated data, the g factor defined as the ratio between the CD and the absorption coefficient is calculated by:
(4)
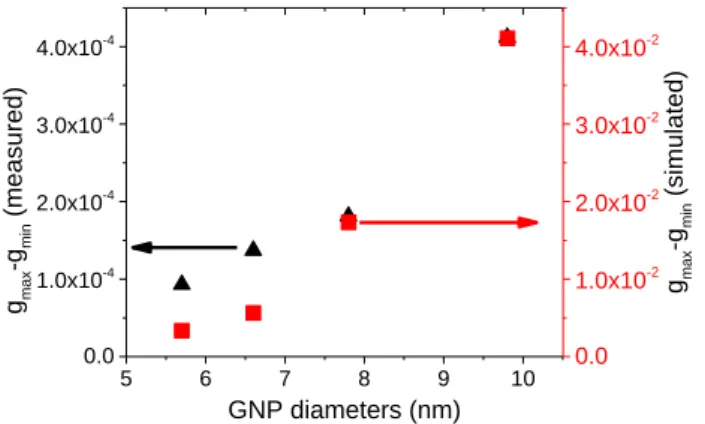
The highest value of the g-factors of Goldhelix, (gmax-gmin), both obtained by experiments
and simulations (monodispersive GNPs with crystalline organization) are shown in Figure 4 as a function of the GNPs diameters. There is a clear correlation between the size of PEG-TA-GNPs and the measured g-factor of the Goldhelix; as when the size of the GNPs increases from 5.7 nm to 9.8 nm, the g-factor is multiplied by 4.4, increasing from 9.3 x 10⁻⁵ to 4.12 x 10⁻⁴. Again, this tendency is clearly reproduced by the simulation. This is in good agreement with the previously reported data in the literature with other systems.65-66
However, the simulated g factor values are about 30 times higher for 5.7 nm and 100 times
the simulated systems and measured systems, we investigated the effect of various factors which can have effects on the CD intensity by simulation, such as disorder, polydispersity of GNPs diameters, or their grafting density.
5 6 7 8 9 10 0.0 1.0x10⁻⁴ 2.0x10⁻⁴ 3.0x10⁻⁴ 4.0x10⁻⁴ GNP diameters (nm) gmax -g min ( measured) 0.0 1.0x10⁻² 2.0x10⁻² 3.0x10⁻² 4.0x10⁻² gmax -gmin ( simulated)
Figure 4. g-factors (gmax-gmin) of TA-PEG GNPs Goldhelix for different GNP diameters
obtained from experimental CD measurements (black triangle) compared with g-factors obtained from simulation with perfectly helically aligned and monodisperse GNPs (red squares).
Disorder:
In order to evaluate the effect of the disorder, we have introduced the disorganization of the GNPs to a system with5.7 nm diameter GNPs organized in square lattice. As illustrated in Figure 5, each GNP m of the system was shifted from its initial position on the helix ribbon, by a vector . The coordinates of this vector were randomly generated from a Gaussian distribution with a standard deviation .The GNP disorder was determined by calculating the two dimensional pair distribution function of GNP on the unfolded chiral ribbon:
is the density of GNPs on the ribbon while Nnp is the number of GNPs in the system;
is the number of GNPs contained in the ring of radius r and thickness dr, centered on the GNP m. The peaks observed in the pair distribution function is getting wider as r increases,
suggesting that the GNP system becomes more and more disorganized. The result shows that the CD intensity decreases with increasing disorder. However even after the introduction of disorder with a standard deviation of nm, the g-factor decreases only by around 25%.
0 10 20 30 0 2 4 6 450 500 550 600 650 700 0 2 4 6 500 600 700 0 1000 2000 g (r ) Interparticule distance (nm) =0 nm =0.2 nm =0.4 nm =0.6 nm =0.8 nm rm CD/N (n m² ) =0 nm =0.2 nm =0.4 nm =0.6 nm =0.8 nm ex t (nm²) Wavelength (nm)
Figure 5. Effect of disorder of GNPs (5.7 nm) (a) Schematic representation of ordered and disordered structures. Effect of the GNP disorder on (b) their two dimensional pair distribution function, (c) their extinction cross section and (d) their CD/N spectra. The g-factors (gmax-gmin)
are summarized in the supporting factor (Table S3).
Polydispersity of GNPs diameters: as it is shown in Table 2, the synthesized GNPs exhibit
some polydispersity, in general around ± 10%. Therefore, we investigated the effect of such a polydispersity on the CD signals of the system. To introduce this polydispersity in the simulations, the nanoparticle diameters were randomly generated from a Gaussian distribution with an average value of 5.7 nm and a standard deviation D from 0 to 1 nm. The
simulation shows that the CD intensity decreases with the particle polydispersity (Figure 6). However the introduction of the typically observed polydispersity values close to the standard deviation of 1.0 nm has only a small impact on the CD intensity with a decrease by only 11%.
450 500 550 600 650 700 -3 -2 -1 0 1 2 3 4 C D /N ( nm² ) Wavelength (nm) D=0 nm D=0.5 nm D=1 nm 500 600 700 0 1500 3000 ext (nm²) Wavelength (nm)
Figure 6. Evolution of CD/N spectra of GNPs 5.7 nm (nm) with the standard deviation
D of the nanoparticule size distribution. The insert shows the evolution of the extinction cross
GNPs density: we then investigated how the CD signal varied with the GNPs density.
Starting from the initial system (Figure 5a), 2.4% (Nv = 10) and 12% (Nv = 50) of the GNPs were randomly removed (Nv is the number of removed GNPs). The results show that the removal of 2.4% of the GNPs does not have much effect on the CD signal, whereas, when we decreased the GNPs density by 12%, the CD signal (Figure 7) was divided by 2 as seen from the variation of g-factor (Table S3).
500 600 700 -1 0 1 2 3 4 5 6 500 600 700 0 2000 ext (nm²) Wavelength (nm) C D /N ( nm² ) Wavelength (nm) Nv=0 Nv=10 Nv=50
Figure 7. Evolution of CD/N spectra of the system with the decreasing density of nanoparticles. Among the total of 400 GNPs, 10 or 50 GNPs were randomly removed, Nv = 10 or 50. The insert shows the evolution of the extinction cross section. The g-factors (gmax-gmin) are
summarized in the supporting factor (Table S3).
CD signal simulated from the real positions of GNPs in 3D space : finally, we simulated the
CD signal from the real position of 5.7 nm GNPs obtained from TEM tomography in 3D space as seen in Figure 1B. For this simulation, the GNPs were all the same size in principle, except when they were overlapping (distances between the centers of GNPs are smaller than twice the radius). In those cases, the diameter was fixed as the distance between the GNPs centers.
In Figure 8, the measured CD signal obtained for 5.7nm GNPs is compared with the simulated CD signal obtained for perfect crystalline organization (Figure 3), as well as the CD signal simulated for the real position of the GNPs. The three spectra surprisingly show good agreement in terms of line shape as well as the peak positions (with a slight shift). It is clearly seen that the CD spectrum simulated for real position of GNPs is roughly 10 times smaller than the spectrum simulated for a perfect crystalline organization of GNPs. Note that we cannot compare here the absolute intensity of the measured and simulated CD signal.
450 500 550 600 650 0 2 4 6 measured CD crystal simulate TEM simulate wavelength (nm) Cry st al s imul ati on 0.0 0.2 0.4 0.6 TE M si mula te gmax-gmin 0.000093 0.00333 0.000376
Figure 8. measured CD signal obtained for 5.7nm GNPs (black solid line) is compared with the simulated CD signal obtained for perfect crystalline organization ( = 0, blue dotted line), as well as the CD signal simulated for the real position of the GNPs (3D tomography, red dashed line)
Here, the g-factor obtained from the simulated spectrum based on the TEM tomography is around 4 times the g-factor measured by CD. This discrepancy can come from several factors. First, as described above, the simulation of the TEM image does not take into account the real distribution of the GNPs diameter. Second, the CMD model does not take into account multipole effects, which could have a strong contribution for tightly packed GNPs assemblies.
As reported by Fan et al.,67 the red shift of the experimental CD spectra can be attributed to multipole effects. However, this effect cannot explain the difference between the magnitude of the simulated and that of the measured g-factor. Indeed, as demonstrated by Fan et al.,67 multipolar effects induce an underestimation of the circular dichroism simulated by CMD. The presence of a silica interface could also have a significant impact on the optical properties of the GNPs. Indeed, when a nanoparticle located on a substrate is exposed to an external electric field, the charges are redistributed in the vicinity of the substrate. This charge redistribution can be modeled as a virtual dipole image, which interacts with the nanoparticle. This interface effect induces a broadening and a decrease of the amplitude of the plasmon band.68
Finally, the experimental results are compared with previously reported data in the literature. Indeed, it has been observed that the localized surface plasmon resonance (LSPR) of metal NPs strongly depends on the size and shape of the NPs as well as their spatial arrangement and to date, much research has been done to investigate the effects of the size and arrangement of GNPs on CD signal. 26, 67, 69-70
For most of the GNP-GNP helical organizations found in the literature, only raw data given in mdeg are presented and g-factors are rarely calculated. In the present case, our raw data are comprised between 2 and 7 mdeg for 5 to 10 nm GNPs. Although the comparison is not quantitative, these values are either comparable or higher than what can be observed in the literature.10, 12, 35, 37 The only systems which give higher g-factor values are helical assemblies of gold nanorods. In this case, the CD is enhanced due to the polarized geometry of the rods and g-factors can reach values as high as 2×10⁻². 36, 38, 40, 43 Indeed, it would be very interesting to
In conclusion, we have introduced a simple and unique way to design 3D helical nanostructures with strong and controllable chiroptical properties by using inorganic silica nanohelices as chiral templates and GNPs as plasmonic active units. The observed g-factor by circular dichroism (CD) spectroscopy at the wavelength of the surface plasmon resonance (SPR) of the GNPs was of the order of 10-4, ten-fold larger than what is typically reported in the literature. Our study clearly showed that these optical activities depend both on the size and the organization of the GNPs on the surface of the helical silica template which are closely correlated with the surface chemistry of both the GNPs and the silica helices. The optical properties of GNP systems were simulated with the coupled dipole method. In agreement with experimental data, the simulations revealed that the g-factor of these systems increased with the GNP size. However, the simulated g-factor is 1 to 2 orders of magnitude higher than the experimental value. This discrepancy is likely due to the GNP disorder, the variation in the GNP density, the polydispersity of GNPs and silica helices and the presence of silica/water interface. Indeed, the simulations based on the positions of GNPs estimated by TEM led to the g-factor much closer to the measured one. Thus, these simulations open new ways for the design and the optimization of GNP chiral systems with specific optical properties.
Such tunable and robust chiral nanostructures with strong CD response can be developed for new applications of metamaterials in the visible range, and for chiral biosensing and chiral detection based on the importance of the SPR effect in biological structures.
Synthesis of Gemini Tartrate and Gel Formation. The 16-2-16 amphiphiles with tartrate
counter-ions were synthesized according to previously published data. To make organic gel, 3.58 mg of 16-2-16 L- or D-tartrate powder are dissolved into 5 mL of Milli-Q water to obtain a concentration of 1 mM 16-2-16 tartrate. The solution is then heated up to 60°C (above the Krafft temperature which is 43°C for 16-2-16 tartrate) for 20 minutes for a complete dissolution, and incubated at 20°C. At the concentration of 1 mM, twisted ribbons were observed after 1 h at 20°C and helical ribbons were observed after 1 day. The morphology of self-assembly was then monitored with Transmission Electron Microscopy.
Preparation of Silica Nanohelices and their Fragmentation. Once adequate ageing time
of the gels is reached, these organic self-assemblies are used as templates to prepare silica nanostructures through a sol-gel transcription procedure. In a typical preparation, 500 µL of tetraethoxysilane (TEOS) were added to the 10 mL of 0.1 mM aqueous solution of L-tartaric acid (pH 3.8) and pre-hydrolyzed at 20°C by stirring on the roller-mixer for 7 h. In parallel, a solution of 1 mM 16-2-16 gemini surfactant with L-tartrate counterion is aged between 2 h to 2 days for the formation of twisted and helical nanoribbons respectively. Equal volumes of pre-hydrolyzed TEOS in 0.1 mM aqueous solution of L-tartaric acid and organic gels are mixed (typically, 2 mL of each) and stirred at 20°C with a roller-mixer overnight. Once the transcription is completed, the mixture is washed thoroughly with isopropanol, in order to solubilize the organic byproducts and eliminate the excess of TEOS (washing 5 times with absolute isopropanol by centrifugation (5 min., 2000 G) and re-dispersing in isopropanol). Basically, from 0.36 mg of organic gel, we obtained 5 mg of silica nanohelices. This procedure
After silica nanohelices were obtained, they were re-dispersed into 1:1 ethanol/ isopropanol by centrifugation and followed by tip sonication with various sonication powers to individualize and shorten the nanohelices.54 Generally, a high intensity ultrasonic processor “Vibra cell 75186” equipped with 6 mm microtip with variable power was used (maximum power, 130 W). A 20 kHz pulse mode was chosen for the dispersion and fragmentation of silica nanohelices and twisted nanoribbons. The experimental parameters were kept constant: sample concentration (0.5 mg/mL), volume (2 mL), sonication time (15 min. with pulses of 1 s separated by 1 s pauses). Samples were cooled in an ice bath during the sonication process in order to avoid solvent evaporation and rising of the sample temperature which could influence the sonication effect.
Amine Functionalization of Fragmented Silica Nanohelices. The silica nanohelices were
then functionalized via a surface chemical modification with (3-aminopropyl) triethoxysilane (APTES).59 Generally, 25 µmol of APTES were added per 0.5 mg of short silica nanohelices in ethanol. The reaction mixture was submitted to ultrasonication for 5 min. and then kept in an oil bath overnight at 80˚C followed by five times washing by centrifugation in absolute ethanol. This modification procedure can be repeated once to improve the coverage of the silica surface with amine groups. The presence of amine groups is confirmed in XPS by the presence of N1s peak at 399.8 eV.
The quantity of amine groups at the surface of the NH2-SiO2 helix silica wall is
estimated by UV spectroscopy titration inspired by the work of Moon et al.71 In a typical process, the aminosilane is allowed to react with 4-nitrobenzaldehyde to form an imine. After washing the sample with ethanol to eliminate the excess of 4-nitrobenzaldehyde, the imine is
hydrolyzed in a known volume of water to produce again the 4-nitrobenzaldehyde and its absorbance is measured giving rise to the concentration via the Beer-Lambert law. The relation between the amount of amine groups per unit volume (d × nm²) and the quantity of amine groups (nmoles) can be expressed as below:
(6)
where ρSiO2 is the density of amorphous SiO2 (2.196 g/cm3). The factor d is the thickness of
silica wall (ranged between 2 and 3 nm). MSiO2 is the molecular weight of silicon dioxide
(60.08 g/mol) and NA is Avogadro constant. We find that the density of NNH2 per nm² is 1 (for
d = 3 nm), or 0.7 (for d = 2 nm).
Synthesis of GNPs and Surface Ligands Exchange.
NaBH4-reduced and tri-sodium citrate-stabilized GNPs (NaBH4-GNPs). Around 3.5 nm
NaBH4-GNPs (Figure S1A) were synthesized by using tri-sodium borohydride (NaBH4) as
the reducing agent and tri-sodium citrate as the capping agent through a modified method by Zhang et al.72 Typically, 0.23 mL 0.1 M HAuCl4·3H2O aqueous solution was added into 90
mL of deionized water followed by injection of 2 mL of 38.8 mM tri-sodium citrate solution. Then 1 mL of 0.075 wt% freshly prepared NaBH4 solution (in 38.8 mM tri-sodium citrated
solution) was added after 5 min. of stirring, and then the reaction mixture was stirred overnight at room temperature.
APTES stabilized GNPs (APTES-GNPs). Around 4 nm APTES-GNPs (Figure S1B) were synthesized by using Sun’s method with a slight modification.73
Typically, 400 μL of APTES were added to 0.84 mL of a 0.1 M HAuCl4 aqueous solution with 2.66 mL Milli-Q water
mixture. Then the colloidal solution was heated up to 100˚C for 30 min. and then kept at room temperature overnight, followed by centrifugation to remove the unreacted APTES and other byproducts. The synthesized GNPs have an average diameter of 4.1 ± 0.5 nm in TEM measurement.
Tannic acid/citrate stabilized GNPs (TA-GNPs). Gold nanoparticles with approximately 5-10 nm were synthesized by the method which was slightly modified from what was reported previously74 using both tannic acid and tri-sodium citrate as reducing and capping agent (Figure S6). To make 100 mL of a GNP suspension, two stock solutions are prepared. Solution A: 1 ml 1% aqueous gold chloride in 80 ml milli-Q water and. Solution B: 4 ml of 1% tri-sodium citrate·2H2O in 16 ml milli-Q water, to which a variable amount of 1% tannic acid
was added (shown in Table S1). When the volume of added tannic acid exceeds 1 mL, an equal amount of 25 mM potassium carbonate solution is added for pH adjustment. The solutions A and B are heated to 60˚C then mixed while stirring. After the solution turns red, heated further up to 100˚C, then cooled in an ice bath. The larger particles with lower concentrations of tannic acid take longer to form and it takes up to 1 hour for the solution to turn to red.
Surface Ligands Exchange. Surface ligands exchange reaction for NaBH4-GNPs and
TA-GNPs was done by using O-(2-Carboxyethyl)-O’-(2-mercaptoethyl) (noted as HS-PEG7-COOH). Briefly, in a typical preparation for TA-GNPs, 2 mL of 0.067 µM 5 nm
TA-GNPs for example, were first put under centrifugation (15000 rpm) until the colored parts of the solution are smaller than 1.0 mL (~0.13 µM) or 0.5 mL (~0.27 µM) by precipitation to remove ½ or ¾ unreacted tannic acid salt and tri-sodium citrate. If ¾ unreacted tannic acid
salt and tri-sodium citrate were removed, 0.5 mL Milli-Q water was added to balance the concentration of GNPs and prevent the GNPs aggregation. After that, 0.5 mL of 10 mM HS-PEG7-COOH in ethanol were added to the colloidal solution followed by 5min sonication
and then incubated at 4˚C overnight to reach equilibrium. After reaction, TA-GNPs with HS-PEG7-COOH were precipitated by centrifugation and washed with water (centrifugation
15000 rpm during 5 min., removal of the upper phase, addition of water, vigorous shaking, then centrifugation again). Finally, PEG-TA-GNPs were dispersed in water with a pH about 4.4 and kept at 20˚C overnight before any usage.
In the case of NaBH4-GNPs, the ligand exchange reaction is basically the same with small
modifications. 2 mL of 0.25 nM NaBH4-GNPs were first centrifuged to 1.0 mL (~0.5 nM) by
precipitation to remove unreacted tri-sodium citrate and increase the concentration. After that, 0.5 mL of 10 mM HS-PEG7-COOH in ethanol was added and the solution was sonicated
for 5 min then incubated at 4˚C overnight to reach the equilibrium. After reaction, the resulting PEG-NaBH4-GNPs were precipitated by centrifugation and washed with water as
described above. Finally, PEG-NaBH4-GNPs were dispersed in water at pH 4.4 and kept at
20˚C overnight before any usage.
Synthesis of Goldhelix.
Direct synthesis of Goldhelix without ligand exchange.
For APTES-GNP. 0.1 mL GNPs were diluted and redispersed in 0.9 mL Milli-Q water and
then, the pH was adjusted to around 8 followed by addition of 25 µL-100 µL of 0.5 mg/mL bare silica nanohelices. The suspension was submitted to 5 min. sonication and incubated at
Milli-Q water using centrifugation to eliminate unreacted APTES-GNPs. To enhance the adsorption, the mixing can be repeated as stated. The final samples were kept in 20˚C before any characterizations and measurements.
For NaBH4-GNPs and TA-GNPs. NH2-SiO2–helix were used as a template for GNPs
immobilization. Basically, 25 µL-100 µL of 0.8 mg/mL nanohelices-NH2 were added to 0.5
mL of GNPs with 10 min. sonication and then incubated at 20˚C overnight. The suspension became colorless, with dark red precipitate inside, which was then washed three times with water to eliminate unreacted GNPs. To enhance the adsorption, the procedure can be repeated as stated. The final samples were kept in 20˚C before any characterizations and measurements.
Synthesis of Goldhelix after ligand exchange. After ligands exchange, 50 µL-150 µL of 0.8 mg/mL NH2-SiO2–helix was added to 0.5 mL of PEG-TA-GNPs. 10 min. sonication was
applied to the mixed solution to make it homogenous. Then, the suspension of GNPs with silica helices was washed by precipitation with water after 24 h incubation at 20˚C in roller-mixer. The washing was repeated 5 times and the concentration of synthesized Goldhelix can be increased by condensation at the final stage of washing. The final samples were kept in 20˚C before any characterizations and measurements.
The effect of the quantity of free stabilizers in solution on the adsorption of PEG-TA-GNPs on NH2-SiO2–helix was investigated as follows. 0.5 mL of the solution of different components
in the free stabilizers, namely tannic acid, tri-sodium citrate and K2CO3, with different
combinations was added to the bare TA-GNPs colloids instead of 0.5 mL Milli-Q water after centrifugation before adding of SH-PEG7-COOH. The concentration of each component
(tannic acid, K2CO3 and tri-sodium citrate) was finely adjusted to be equal to the initial
solution. The final TEM results are shown in Figure S5 and S6.
UV measurements. The study of localized surface plasmon resonance was performed with
a Cary 300 UV-vis. spectrometer. The data were recorded with 1.0 nm data interval and 600 nm/min. scan rate. Quartz cuvettes with optical path length of 10 mm were used for measurements.
Circular dichroism measurements. Electronic circular dichroism (ECD) spectra were
recorded on a Jasco J-815 CD spectrometer. The scan rate was 20 nm/min. All CD experiments were carried out in a Milli-Q water (pH=6.0±0.1) with a quartz cuvette (10 mm path length) at 25°C. The baseline corrections of the ECD spectra were performed by subtracting the two opposite-enantiomer ECD spectra for GNPs of the same size (recorded under the same experimental conditions and normalized to have absorbance intensity of plasmon band equal to 1) then divide them by two. This baseline procedure removes the experimental artefacts coming from the ECD spectrometer.
Transmission Electron Microscopy (TEM) observation. TEM was performed at room
temperature on a Philips EM 120 electron microscope operating at 120 kV and the images were collected by 2k × 2k Gatan ssCCD camera. Drops of diluted dispersions of the hybrids were deposited on carbon films coated 200/400-mesh copper grids. The excess liquid was blotted with filter paper. Electron tomography (ET) experiments have been carried out on representative silica helices by using a JEOL 2100F TEM/STEM electron microscope
corrector. Before observations, the samples were deposited on a holey carbon membrane copper grid which was previously cleaned using a H2/Ar plasma gas using a Solarus Plasma
Cleaner. The acquisition of the tilt series was performed in the classical TEM mode with the Digital Micrograph software which provides an automated acquisition of the tilt series by varying the tilt angle step by step and by controlling the defocusing and the specimen drift at each tilt angle. Using a high tilt sample holder from the GATAN Company, TEM tilt series were acquired between 75° and -75°, with a 1.5° equal tilt increment. As a result, the total number of projections was about 100, for a recording duration of about 45 minutes. Once the acquisition of the tilt series completed, the images were roughly aligned using a cross correlation algorithm, followed by a fine alignment performed in the IMOD software 97 where the gold nanoparticles located on the silica helices were used as fiducial markers. The 3D reconstructions were computed by using algebraic reconstruction techniques (ART) 98 implemented in the TomoJ software 99 with 20 iterations. Visualization and quantitative analysis of the final volumes were carried out by using Slicer (http://www.Slicer3D.org) and ImageJ software.
CDM Simulation.
The optical properties of GNPs systems are simulated according to the coupled dipole method (CDM). Each spherical GNP m located at the position is considered as a dipole characterized by its own polarizability:
where is the GNP radius. and are the dielectric functions of water and
GNPs, respectively. Assuming that only the free electrons are affected by confinement effects, the dielectric function of GNPs can be expressed in the following way:
(8)
is the tabulated dielectric function of gold. , m.s-1, and
are the plasma frequency, the Fermi velocity of free electrons, and the electron damping of gold, respectively. Exposed to a local electric field , this nanoparticle acquires a dipole moment given by :
. (9)
By considering the local electric field as a sum of the incident electric field ( ) and fields radiated by the other dipoles l, we can deduce the following equation:
(10)
where Nnp is the number of GNPs. The second term of equation (4), described the dipolar
interaction between GNPs. This term is expressed as:
(11)
(12)
and are the 3N dipole moment and incident electric field vectors, respectively. is a tensor which described the optical and geometrical properties of the GNP structure. The 3x3 off-diagonal block elements Aml of this tensor is deduced from equation (5) while the
3x3 diagonal block elements Amm is given by:
(13)
is the 3x3 identity matrix. The vector P is determined by solving equation (6) using the
generalized minimal residual method (GMRES). For a given incident electric field, the extinction cross section of the GNP structure is calculated by:
(14)
is the amplitude of the incident electric field.
AUTHOR INFORMATION
* authors for correspondence r.oda@cbmn.u-bordeaux.fr, e.pouget@cbmn.u-bordeaux.fr
ACKNOWLEDGMENT
This work was supported by the LabEx AMADEus (ANR-10-LABX-42) in the framework of IdEx Bordeaux (ANR-10-IDEX-03-02), i.e., the Investissements d'Avenir programme of the French government managed by the Agence Nationale de la Recherche, by the Université de Bordeaux, and by the Centre National de la Recherche Scientifique. The authors are grateful to
Christine Labrugère (XPS), Sophie Lecomte and Etienne Harte (FT-IR) and Sisareuth Tan (TEM). The authors also acknowledge the French CNRS and CEA METSA (Microscopie Electronique et Sonde Atomique) network (FR3507).
REFERENCES
1. Hutter, E.; Fendler, J. H., Exploitation of localized surface plasmon resonance. Adv.
Mater. 2004, 16, 1685-1706.
2. Walker, D. A.; Leitsch, E. K.; Nap, R. J.; Szleifer, I.; Grzybowski, B. A., Geometric curvature controls the chemical patchiness and self-assembly of nanoparticles. Nature
Nanotech. 2013, 8, 676-681.
3. Wang, L.; Xu, L.; Kuang, H.; Xu, C.; Kotov, N. A., Dynamic nanoparticle assemblies.
Accounts. Chem. Res. 2012, 45, 1916-1926.
4. Aslan, K.; Lakowicz, J. R.; Geddes, C. D., Rapid deposition of triangular silver
nanoplates on planar surfaces: application to metal-enhanced fluorescence. J. Phys. Chem. B
2005, 109, 6247-6251.
5. Aslan, K.; Leonenko, Z.; Lakowicz, J. R.; Geddes, C. D., Fast and slow deposition of silver nanorods on planar surfaces: application to metal-enhanced fluorescence. J. Phys.
Chem. B 2005, 109, 3157-3162.
6. Freeman, R. G.; Grabar, K. C.; Allison, K. J.; Bright, R. M., Self-assembled metal colloid monolayers: an approach to SERS substrates. Science 1995, 267, 1629.
7. Nikoobakht, B.; El-Sayed, M. A., Surface-enhanced Raman scattering studies on aggregated gold nanorods. J. Phys. Chem. A 2003, 107, 3372-3378.
8. Tao, A.; Kim, F.; Hess, C.; Goldberger, J.; He, R.; Sun, Y.; Xia, Y.; Yang, P., Langmuir− Blodgett silver nanowire monolayers for molecular sensing using surface-enhanced Raman spectroscopy. Nano Lett. 2003, 3, 1229-1233.
9. Gansel, J. K.; Thiel, M.; Rill, M. S.; Decker, M.; Bade, K.; Saile, V.; von Freymann, G.; Linden, S.; Wegener, M., Gold helix photonic metamaterial as broadband circular polarizer.
Science 2009, 325, 1513-1515.
10. Song, C.; Blaber, M. G.; Zhao, G.; Zhang, P.; Fry, H. C.; Schatz, G. C.; Rosi, N. L., Tailorable plasmonic circular dichroism properties of helical nanoparticle superstructures.
Nano Lett. 2013, 13, 3256-3261.
11. Sharma, J.; Chhabra, R.; Cheng, A.; Brownell, J.; Liu, Y.; Yan, H., Control of
self-assembly of DNA tubules through integration of gold nanoparticles. Science 2009, 323, 112-116.
12. Kuzyk, A.; Schreiber, R.; Fan, Z.; Pardatscher, G.; Roller, E.-M.; Högele, A.; Simmel, F. C.; Govorov, A. O.; Liedl, T., DNA-based self-assembly of chiral plasmonic nanostructures with tailored optical response. Nature 2012, 483, 311-314.
13. Guha, S.; Drew, M. G.; Banerjee, A., Construction of Helical Nanofibers from Self‐ Assembling Pseudopeptide Building Blocks: Modulating the Handedness and Breaking the
14. Sone, E. D.; Zubarev, E. R.; Stupp, S. I., Semiconductor nanohelices templated by supramolecular ribbons. Angew. Chem. Int. Ed. 2002, 41, 1705-1709.
15. Wang, Y.; Wang, Q.; Sun, H.; Zhang, W.; Chen, G.; Wang, Y.; Shen, X.; Han, Y.; Lu, X.; Chen, H., Chiral transformation: from single nanowire to double helix. J. Am. Chem. Soc.
2011, 133, 20060-20063.
16. Fu, X.; Wang, Y.; Huang, L.; Sha, Y.; Gui, L.; Lai, L.; Tang, Y., Assemblies of metal nanoparticles and Self‐Assembled peptide Fibrils—Formation of double helical and Single ‐Chain arrays of metal nanoparticles. Adv. Mater. 2003, 15, 902-906.
17. Xia, Y.; Zhou, Y.; Tang, Z., Chiral inorganic nanoparticles: origin, optical properties and bioapplications. Nanoscale 2011, 3, 1374-1382.
18. Zhang, H.; Govorov, A., Giant circular dichroism of a molecule in a region of strong plasmon resonances between two neighboring gold nanocrystals. Phys. Rev. B 2013, 87, 075410.
19. Kim, Y.; Yeom, B.; Arteaga, O.; Yoo, S. J.; Lee, S.-G.; Kim, J.-G.; Kotov, N. A., Reconfigurable chiroptical nanocomposites with chirality transfer from the macro-to the nanoscale. Nature Mater. 2016, 15, 461-468.
20. Oh, S. S.; Hess, O., Chiral metamaterials: enhancement and control of optical activity and circular dichroism. Nano Convergence 2015, 2, 24.
21. Zhang, S.; Park, Y.-S.; Li, J.; Lu, X.; Zhang, W.; Zhang, X., Negative refractive index in chiral metamaterials. Phys. Rev. Lett. 2009, 102, 023901.
22. Zhao, R.; Zhang, L.; Zhou, J.; Koschny, T.; Soukoulis, C., Conjugated gammadion chiral metamaterial with uniaxial optical activity and negative refractive index. Phys. Rev. B 2011,
83, 035105.
23. Wang, Y.; Xu, J.; Wang, Y.; Chen, H., Emerging chirality in nanoscience. Chem. Soc.
Rev. 2013, 42, 2930-2962.
24. Estroff, L. A.; Hamilton, A. D., Water gelation by small organic molecules. Chem. Rev.
2004, 104, 1201-1217.
25. Wang, X.; Tang, Z., Circular Dichroism Studies on Plasmonic Nanostructures. Small
2017, 13, 1601115.
26. Govorov, A. O.; Gun'ko, Y. K.; Slocik, J. M.; Gérard, V. A.; Fan, Z.; Naik, R. R., Chiral nanoparticle assemblies: circular dichroism, plasmonic interactions, and exciton effects. J.
Mater. Chem. 2011, 21, 16806-16818.
27. Ben-Moshe, A.; Maoz, B. M.; Govorov, A. O.; Markovich, G., Chirality and chiroptical effects in inorganic nanocrystal systems with plasmon and exciton resonances. Chem. Soc.
Rev. 2013, 42, 7028-7041.
28. Lan, X.; Wang, Q., Self‐Assembly of Chiral Plasmonic Nanostructures. Adv. Mater.
2016, 28, 10499-10507.
29. Shen, X.; Zhan, P.; Kuzyk, A.; Liu, Q.; Asenjo-Garcia, A.; Zhang, H.; de Abajo, F. J. G.; Govorov, A.; Ding, B.; Liu, N., 3D plasmonic chiral colloids. Nanoscale 2014, 6, 2077-2081. 30. Smith, K. W.; Zhao, H.; Zhang, H.; Sánchez-Iglesias, A.; Grzelczak, M.; Wang, Y.; Chang, W.-S.; Nordlander, P.; Liz-Marzán, L. M.; Link, S., Chiral and Achiral
Nanodumbbell Dimers: The Effect of Geometry on Plasmonic Properties. ACS nano 2016, 10, 6180-6188.
31. Wang, L.-Y.; Smith, K. W.; Dominguez-Medina, S.; Moody, N.; Olson, J. M.; Zhang, H.; Chang, W.-S.; Kotov, N.; Link, S., Circular differential scattering of single chiral
self-assembled gold nanorod dimers. ACS Photonics 2015, 2, 1602-1610.
32. Ma, W.; Kuang, H.; Wang, L.; Xu, L.; Chang, W.-S.; Zhang, H.; Sun, M.; Zhu, Y.; Zhao, Y.; Liu, L., Chiral plasmonics of self-assembled nanorod dimers. Sci. Rep. 2013, 3, 1934. 33. Mastroianni, A. J.; Claridge, S. A.; Alivisatos, A. P., Pyramidal and chiral groupings of gold nanocrystals assembled using DNA scaffolds. J. Am. Chem. Soc. 2009, 131, 8455-8459. 34. Yan, W.; Xu, L.; Xu, C.; Ma, W.; Kuang, H.; Wang, L.; Kotov, N. A., Self-assembly of chiral nanoparticle pyramids with strong R/S optical activity. J. Am. Chem. Soc. 2012, 134, 15114-15121.
35. Shen, X.; Asenjo-Garcia, A.; Liu, Q.; Jiang, Q.; García de Abajo, F. J.; Liu, N.; Ding, B., Three-dimensional plasmonic chiral tetramers assembled by DNA origami. Nano Lett. 2013,
13, 2128-2133.
36. Wu, X.; Xu, L.; Ma, W.; Liu, L.; Kuang, H.; Kotov, N. A.; Xu, C., Propeller‐Like Nanorod‐Upconversion Nanoparticle Assemblies with Intense Chiroptical Activity and Luminescence Enhancement in Aqueous Phase. Adv. Mater. 2016, 28, 5907-5915. 37. Shen, X.; Song, C.; Wang, J.; Shi, D.; Wang, Z.; Liu, N.; Ding, B., Rolling up gold nanoparticle-dressed DNA origami into three-dimensional plasmonic chiral nanostructures. J.
Am. Chem. Soc. 2011, 134, 146-149.
38. Lan, X.; Lu, X.; Shen, C.; Ke, Y.; Ni, W.; Wang, Q., Au nanorod helical superstructures with designed chirality. J. Am. Chem. Soc. 2014, 137, 457-462.
39. Zhang, S.; Ni, W.; Kou, X.; Yeung, M. H.; Sun, L.; Wang, J.; Yan, C., Formation of gold and silver nanoparticle arrays and thin shells on mesostructured silica nanofibers. Adv. Funct.
Mater. 2007, 17, 3258-3266.
40. Hwang, L.; Chen, C.-L.; Rosi, N. L., Preparation of 1-D nanoparticle superstructures with tailorable thicknesses using gold-binding peptide conjugates. Chem. Commun. 2010, 47, 185-187.
41. Chen, C.-L.; Zhang, P.; Rosi, N. L., A new peptide-based method for the design and synthesis of nanoparticle superstructures: construction of highly ordered gold nanoparticle double helices. J. Am. Chem. Soc. 2008, 130, 13555-13557.
42. Qi, H.; Shopsowitz, K. E.; Hamad, W. Y.; MacLachlan, M. J., Chiral nematic assemblies of silver nanoparticles in mesoporous silica thin films. J. Am. Chem. Soc. 2011, 133,
3728-3731.
43. Guerrero‐Martínez, A.; Auguié, B.; Alonso‐Gómez, J. L.; Džolić, Z.; Gómez‐Graña, S.; Žinić, M.; Cid, M. M.; Liz‐Marzán, L. M., Intense Optical Activity from Three‐
Dimensional Chiral Ordering of Plasmonic Nanoantennas. Angew. Chem. Int. Ed. 2011, 50, 5499-5503.
44. Shemer, G.; Krichevski, O.; Markovich, G.; Molotsky, T.; Lubitz, I.; Kotlyar, A. B., Chirality of silver nanoparticles synthesized on DNA. J. Am. Chem. Soc. 2006, 128, 11006-11007.
45. Ma, W.; Kuang, H.; Xu, L.; Ding, L.; Xu, C.; Wang, L.; Kotov, N. A., Attomolar DNA detection with chiral nanorod assemblies. Nat. Commun. 2013, 4.