Collective Innovation Spaces in Shanghai
-
spatial patterns and social
life
By
Haijing Liu
Master of Architecture, University of Michigan (2013) Bachelor of Engineering, Nanjing University (2011) Submitted to the Department of Urban Studies and Planning
in partial fulfillment of the requirements for the degree of Master in City Planning
at the
MASSACHUSETTS INSTITUTE OF TECHNOLOGY
June 2018
C 2018 Haijing Liu. All Rights Reserved
The author hereby grants to MIT the permission to reproduce and to distribute publicly paper and electronic copies of the thesis
document in whole or in part in any medium now known or hereafter created.
Author
Signature redacted
Department of Urban Studies and Planning
Signature redacted
May14,2018Certified by
Leventhal Professor of Urban Deligww-arliiiiift-Dennis Frenchman Department of Urban Studies and Planning
Thesis Supervisor
Accepted by
Signature redacted
Professor of the Practice, Ceasar McDowell Chair, MCP Committee
MASSACHUSETTS INSTITUTE Department of Urban Studies and Planning
OF TECHNOLOGY
JUN 18 ?018
LIBRARIES
Collective Innovation Spaces in Shanghai
-
spatial patterns and social life
By
Haijing Liu
Submitted to the Department of Urban Studies and Planning on May 14, 2018, in partial fulfillment of the
requirements for the degree of Master in City Planning
Abstract
In 2014, the Chinese central government began an initiative -"mass innovation and
entrepreneurship" - as its new strategy of economic development. Collective innovation spaces were promoted as the physical manifestation to fuel this economic development strategy. As a result, the establishment of collective innovation spaces has since received significant funding from both the public and the private sector. The number of collective innovation spaces has grown exponentially over the years. With this significant growth rate, collective innovation spaces have started to exhibit a distinctive spatial pattern and made an impact on urban life. However, few systematic studies have been carried out to understand this spatial pattern and the mechanisms behind it.
This thesis takes Shanghai as the study site. Using statistical model and spatial analysis, the study identifies several clusters of collective innovation spaces (CIS) in Shanghai as well as their spatial characteristics. It demonstrates that rental housing units, IT companies, universities, restaurants, bars and coffee shops have a positive relationship with CIS clusters. However, housing developments and parks have a negative relationship with CIS clusters. Development of
CIS and the thriving third places, which are privatized social spaces other than home and
workspaces, generate an innovation network that facilitates social interactions, innovation, and entrepreneurship. It represents a new kind of urban development in China, integrating,
connecting and preserving the existing urban fabric. Furthermore, by investigating in two case studies in Shanghai, the thesis gives policy and design suggestions on the development of CIS clusters.
Acknowledgments
The two years at MIT have been an eye-opening journey to me
My sincere thanks to the members of my committee: to Professor Dennis Frenchman, your
encouragement and insights have made my thesis experience an inspiring experience. To Professor Siqi Zheng, thank you for your thought-provoking conversations during research meetings, and your life guidance has enriched my time at MIT. To Andrea Chegut, you are the one who brought me to the academic world of studying innovation spaces; thank you for your passion and also patience guiding me through my thesis prep experience.
Thank you to Professor Brent Ryan, for your support in helping me during the initial stage of my thesis.
Thank you to my family for always supporting me. This accomplishment would not have been possible without you. Thank you to my DUSP family: Chester, Daya and Pim for being constant supporter and laughter.
To Yin, whose humor and support have been an unending source of consolation and encouragement.
Contents
Chapter 1 Introduction... 9
1.1 Why collective innovation spaces? - Incentives for the Chinese government and its theoretical background... 10
1.2 Literature review and research questions... 14
Chapter 2 Understand CIS clusters in Shanghai... 19
2.1 Identify CIS clusters in Shanghai ... 19
2.1.1 Data... 19
2.1.2 Identify CIS cluster ... 20
2.2 Conceptual fram ework for cluster analysis... 24
2.2.1 Literature review ... 24
2.2.2 Historical context... 25
2.2.3 Survey Results ... 32
Chapter 3 Evaluating CIS clusters from six criteria ... 34
3.1 Six criteria...34
3.2 Statistical m odel... 35
3.2.1 Connectivity ... 42
3.2.2 A ffordable housing ... 43
3.3 Case studies ... 47
3.3.1 Building typology ... 48
3.3.2 W alkability ... 50
3.3.3 Innovation environm ent ... 54
3.3.4 Urban development models ... 59
Chapter 4 Conclusion ... 67
References ... 69
Appendix I ... 74
Chapter 1 Introduction
In the year 2015, Chinese central government coined a new term: "Collective Innovation Spaces"
(CIS) as a new measure to promote innovation and entrepreneurship. The term CIS includes
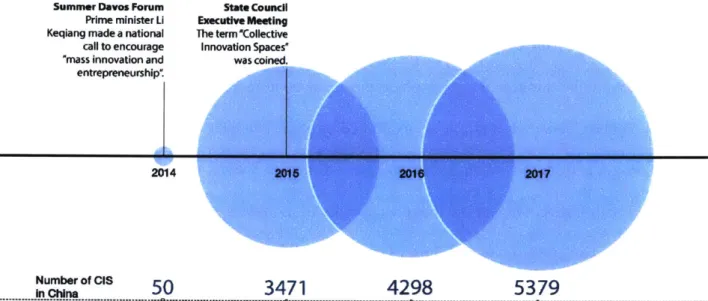
coworking spaces, makerspaces, hackerspaces and innovation centers, which are platforms that support and facilitate innovation and entrepreneurship activities. Since then, the number of CIS has increased exponentially. Before 2015, there were only 50 CIS in China. However, the
number of CIS grew to 2,300 in 2015 and reached 4,000 in 2016'. This rapid growth has become a phenomenon that many urban design projects and master plans are using CIS as a justification and promotion for their design strategy. However, few studies have looked into this phenomenon from the perspective of the built environment in China.
This thesis is one of the first attempts to investigate collective innovation spaces as an urban phenomenon in China. The study selects Shanghai as the study site because of its unique economic and cultural status among other Chinese cities. Using interviews, surveys, and statistical spatial modeling, this research provides solid evidence to show that the balance between housing, workspaces and social spaces are essential to the clustering of CIS in Shanghai. Existing industries have the largest impact in predicting the clustering of CIS, followed by accessibility to social spaces. Accessibility to rental units has a positive effect on
tend to locate around IT companies and universities with a focus on related industries. However, research institutions do not have any significant impact on CIS clusters. The statistical model, along with case studies demonstrate that the privatized public spaces, connecting with CIS clusters are generating nested social spaces in the city, which becomes an essential component to the innovation network. However, parks and plaza are not a preference for CIS developers. This thesis also describes how the rapidly emerging CIS have been shaping the current built
environment.
The rest of the thesis is organized as follows: the remaining of this chapter will introduce the background of this thesis. Chapter two identifies CIS clusters in Shanghai and introduces the methodology and conceptual framework of this thesis. Chapter three identifies six criteria based on chapter two and using statistical models and case studies to investigate the relationship between built environment and the clustering of CIS, how specific CIS clusters are performing regarding life quality and innovation environment. Chapter four concludes the findings and limitations in this thesis.
1.1 Why collective innovation spaces? - Incentives for the Chinese government and its theoretical background
China saw an economic boom from the 1990s till the early 201 Os, where it became the "manufacturer of the world." However, such economic development has caused severe environmental externalities, including air, water, and soil pollution. The severity of environmental problems has raised concerns from around the globe, as well as its urban
residents, especially after the smog crisis in 2013 in Beijing. To establish legitimacy in being a one-party system and regain trust from its rising middle-class, the central government has had to
make progressive steps in tackling pollution issues(Zheng & Kahn, 2017). Except for environmental problems, the central government is also concerned about the slowdown of economic growth. Since 2011, China has seen a gradual decrease in annual GDP growth rate (Figure 1-1.). GDP Growth Rate 14 -12 -10 2008 2010 2012 2014 2016 2018 SOUACETADHIGECONOMCS.COM I NATIONAL BUREAU OFSTATISTICSOF CHINA Figure 1-1 China GDP Annual Growth Rate
The central government considers entrepreneurship and innovation as the solution to address both environmental crisis and economy slowdown, which is also a typical post-industrial
economic development strategy around the globe (Kunzmann, 2012). Many developed countries have transformed from manufacture-based to service-based economy. However, recognizing that the economic multiplier from service industries is relatively low, it has become a trend to
promote knowledge-based urban developments (Yigitcanlar, 2010). This consideration has its roots in literature. In Birch's study (Birch, 1981), empirical evidence suggests that the most significant job increase and successful urban growth happens where it has "the highest rates of innovation and failure." Baumol (Baumol, 2008) argues that "entrepreneurship stimulates economic growth by putting innovation to work," and the profit incentive constantly encourages entrepreneurs to innovate through intense market competition. Thus, entrepreneurs are critical to economic growth. It is widely believed that innovation will help China in the mass transition
from heavy-pollution manufacturing to more advanced and cleaner industries from two aspects(Zheng & Kahn, 2017). First, innovation will generate more high-tech companies and spin-off for old industries. Second, innovation in clean energy and manufacturing process can lower the cost of pollution. Therefore, innovation helps with economic growth, as well as environmental issues.
However, there is a perception hurdle2 for entrepreneurship rooted in Chinese culture, which
prohibits the mass population from opening startups. Therefore, the central government used mass media and policy documents to state that entrepreneurship and innovation should and will be the new engine of China's economy, and entrepreneurs will be the future of China. In the 2014 Summer Davos Forum, prime minister Li Keqiang made a national call to encourage "mass innovation and entrepreneurship." Soon after that, during the State Council executive meeting in January 2015, he introduced "Collective Innovation Spaces" as the physical platform to support "mass innovation and entrepreneurship." The term CIS does not have an absolute definition, but mostly it refers to entrepreneurial service platforms that provide physical spaces, facilities, and professional services for startups and entrepreneurs. CIS took the form originated from the U.S, where they are more well known as coworking spaces, makerspaces, incubators, startup cafes and so on. The term CIS encompasses all these terms together.
2 Merchants as an occupation has been undemined in the mainstream culture. Chinese market was dominated by
state-owned enterprises since 1949. It is not until 1990s that private companies emerge because of the open reform. 12
In China, policy suggestions from the central government play a critical role in local
governments' decision making and also the interest of the capital market. Since the national call of "mass innovation and entrepreneurship", local governments have offered a substantial amount of financial support to CIS, including financial subsidies and tax incentives3. The capital market
has also made a considerable investment in CIS, which increased by two times in the year 2016. For urban study researchers, it is important to document this new trend of urban development, to understand its underlying mechanism and to evaluate its impact on urban life.
Summer Davos Forum Prime minister Li Keqiang made a national call to encourage "mass innovation and
entrepreneurship.
State Council
Eiecutive Meeting
The term "Collective
Innovation Spaces' was coined. 2014 2015 2016 2017 Inu tclS
50
3471
4298
5379
Source sootooinstith~t 10Figure 1-2 The timeline of CIS growth in China from 2014 to 2017
I For instance, "firms that meet the specific requirements can get subsidies of RMB 500 per square meter for three consecutive years. Firms categorized as the province or state-level CIS, are eligible for lump sum subsidies of
1.2 Literature review and research questions
Existing literature has introduced the theoretical background of the importance of proximity for industrial activities. This review of literature begins with the agglomeration theory in the regional scale. The Marshall-Arrow-Romer (MAR) theory (Glaeser et al., 1992) argues that the geographic concentration of industry will facilitate knowledge spillovers between firms and hence, facilitate industry and city growth. Generating from Marshallian's industrial district idea, Porter conceptualizes the clustering of industrial activities and the locational competitive
advantages (Porter, 2000). Firms tend to seek proximity to an established industrial cluster to employ the inventory that has already been present at that location. However, with the newly emerging industries, the evolvement of the internet, and the trend of interdisciplinary crossover specific sectors, the traditional agglomeration idea has continuously been challenged. Glaeser and his coauthors (Glaeser et al., 1992) examined three growth theories: Marshall-Arrow-Romer (MAR), Porter and Jacobs. Their findings align with Jacobs' theory, contradictory with MAR, and mixed with Porter. They argue that the diversity of industries, rather than the monopoly facilitates knowledge spillover and thus, expedites the growth of industries and increases job employment. Audretsch and Feldman (Audretsch & Feldman, 1996) further examined the underlying propensity for the agglomeration theory; they find out that innovative activities tend to cluster more in industries that knowledge spillover is relatively more critical.
Many other scholars introduced several other dimensions of the traditional cluster and agglomeration theory on a more intimate scale. Feldman introduced the time dimension of industrial agglomeration. The paper suggests that the condition of a place has a cumulative effect that provides resources and expertise considered as the industrial heritage that "might constitute 14
the basis for innovation, technical advance, and sustainable competitive advantage" (Audretsch
& Feldman, 1996). Feldman argues against the traditional emphasis on financial incentives, but
the ability of policymakers to translate underlying potential and to be aware of conditions that support entrepreneurship plays a more important role as innovation has allowed industries to grow out of its traditional segment and types. She also criticizes the wasteful government expenditures based on the cluster theory. Certain places facilitating "close contact and exchanging ideas" will be more efficient in generating economic growth and social values
(Feldman & Choi, 2015). As Feldman has stated the importance of close contact to the success of entrepreneurship and innovation, Uzzi further argues that it is the social interactions between people rather than the physical closeness that contribute to knowledge spillover (Uzzi, 1999). It is more so in the case of China as building relationships ("guanxi") is a huge component of business success (Su & Littlefield, 2001). Thus the relational proximity is more important than physical proximity (Wang & Loo, 2017). Saxenian also provides alternatives for cluster theory
by emphasizing the importance of social networks and collaboration in the innovation-based
economy (Saxenian, 1994). These theories, in large part, facilitate the growth of innovation spaces such as coworking spaces in the US and Europe.
Coworking offices can be seen as "microclusters" of small businesses,
entrepreneurs, and freelancers where intensive knowledge transfer takes place (Capdevila, 2014).
Capdevila argues that coworking spaces as innovation networks have been replacing the
traditional industrial clusters (Capdevila, 2013). In many coworking spaces, large companies act as anchor institutions to attract startups or SMEs. Capdevila (Capdevila, 2014) categorizes
coworking spaces into three types based on their collaboration models: cost-related
collaboration, resource-based collaboration, and relational collaboration. For each collaboration model, Capdevila has associated characteristics in structural dimension, cognitive dimension and
support and collaboration activities to them. In this sense, coworking spaces act as the platform for social networks and circulation of information that "leads to valuable outcomes(Gandini,
2015)."
With the theories mentioned above, there is a shift in urban lifestyle in Chinese cities, where spaces for social interactions come back to play a more critical role in the urban economy, built environment and everyday life. However, few research documents or studies this transformation, which lead to three research questions in this thesis:
1. Where do collective innovation spaces (CIS) cluster?
The existence and sense of community is the core of collective innovation spaces, and the value of this community exists within a social and innovation network. Social events, lectures, pitches and so on take place in spaces such as the lounge or the common area inside CIS, which are essentially the platform and hub for social interactions, innovation, and entrepreneurship. These platforms and hubs become the connection nodes in the innovation network. Hence spatial proximity becomes the key to the viability of this innovation network. The more innovation spaces one CIS can have proximity to, the larger innovation network this CIS resides in, which gives the users in these spaces more potential to excel and innovate. Thus, this thesis first identifies the CIS clusters in the city.
2. What are the critical urban amenities for CIS clusters?
Although many scholars have indicated the importance of certain urban amenities to creative industry, there have been few empirical studies carried out in Chinese cities to examine these theories. On the other hand, more and more cities embrace the idea of innovation districts or knowledge-based urban development in either urban redevelopment or new town planning projects. Without an accurate understanding of the mechanism underlying the innovation ecosystem, the buzzwords are merely used as a title to gain central government's support and brand projects to the mass media. Thus, this thesis is one of the first attempts to draw
conclusions from both existing literature and current practices in CIS and shed light on the design and planning of knowledge-based urban development in China.
3. What are the implications of CIS clusters for the built environment and urban life?
After 1949, Chinese cities experienced a series of urban development projects which were designated by the central government according to its economic and political goals at that time. The three major urban development projects are danwei, high-tech development zones, and creative industry clusters. These urban development projects play a significant role in shaping citizens' public life across Chinese cities. Therefore, it is worth examining social and political implications for this emerging urban development model and being aware of its impact on people from various backgrounds and social status.
This thesis will use Shanghai as the site to investigate. According to data from Ctoutiao4,
Shanghai ranks the 1st at the number of investment firms, 3rd for number of startup companies and 4th for the number of CIS. The first makerspace in China was founded in Shanghai in 2010. Right now, there are over 20 major CIS operators in Shanghai, diversified with different business model and user groups. The world industrial leader in coworking space, Wework, has recently acquired a local coworking brand in Shanghai. Therefore, it is a heated CIS market in Shanghai where competition is intensive.
' By far, Ctoutiao has the most complete data on collective innovation spaces, startups, and investment firms. It has
also received official recognition.
Chapter 2 Understand CIS clusters in Shanghai
Chapter two has two parts. The first part uses data collected from online sources to construct spatial statistical models to obtain a general idea about the spatial pattern of CIS in Shanghai. The second part looks into literature, historical context and survey results to build the conceptual framework for the evaluation of CIS clusters.
2.1 Identify CIS clusters in Shanghai 2.1.1 Data
Data used in this thesis comes from multiple online sources. The primary dataset for CIS is from Ctoutiao', which has 716 entries with name and address. Among the 716 entries, some items are missing while some items do not fit into the definition of CIS. Thus, the author took four steps to examine the dataset. First, entries of high-tech development zones, tech-parks, creative industrial clusters, and office parks are eliminated because it does not suit the definition of collective innovation spaces in this thesis. Second, from site visits, the author found out that some places that listed as CIS on the website do not function as CIS defined by the central government. Thus, from the naming, the author was able to eliminate these items from the list. Third, there are some missing locations from chain CIS brands, such as people squared, fttown, and so on. The author went to each of these chain brands' website and scraped all the locations down to add to the list.
Finally, the list does not include transnational coworking brands such as Wework. The author further added those items to the list to finalize it as a cleaned and complete CIS dataset for
Shanghai, which ends up at 361 items with name, geolocations, and brand. Because of the limited available attributes, the author also looks into some other open data source for
commercial office rents and tried to match with the CIS list. There are 14,924 entries scraped from ma36 with five attributes and 182 entries scraped from Parkmap7 with ten attributes. The author was only able to obtain 86 items with floor level, building type, rents, vacancy rate, floor area and available amenities associated.
The author aggregated the 86 items and came up some general findings. 48% of CIS locate in class A commercial office buildings; 21% of CIS locate in office parks; 16% of CIS locate in class B commercial office buildings. The average vacancy rate is 36%. Rent ranges from 500 RMB/desk/month to 5,290 RMB/desk/month, with an average of 1,769 RMB/desk/ month.
2.1.2 Identify CIS cluster
Two different methods are used to identify CIS clusters. The first method is kernel density estimation. The advantage of using kernel density estimation as the first step is because no model specification is needed. As there is limited knowledge in the methodology to identify spatial pattern of CIS clustering, kernel density estimation gives the first estimation and look for the cluster pattern. In addition, all other parametric or non-parametric density estimation methods are
6 An online web platform for commercial office listing
7 Another online web platform for CIS
*1
close to kernel methods. Employing the kernel density method in ArcGIS, the result identifies several hotspots in the city (see Figure 2-1). However, using this method, the author only gets a vague sense of the clusters' spatial distribution. Kernel density estimation does not give a clear boundary. Therefore it is hard to code each CIS to identify whether they are in or not in a cluster. However, this first step gives a good sense of the spatial pattern of CIS in Shanghai.
Figure 2-1 Hoispol analsis using kernel densitv
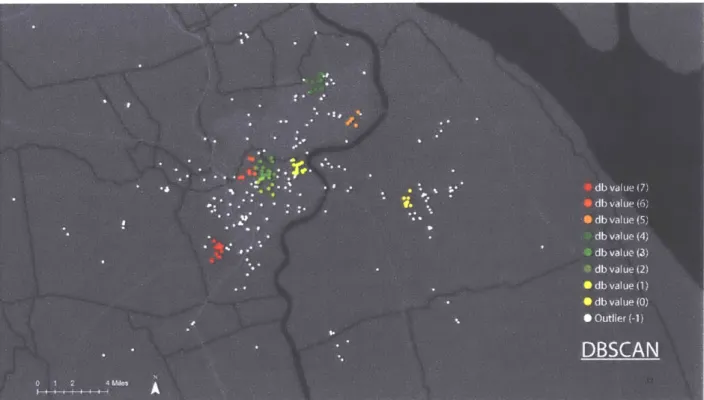
To do the statistical analysis and modeling for the next part, the author needs to have a clear understanding of which CIS are within a cluster and which spaces are not. Density-based spatial clustering of applications with noise (DBSCAN) is one of the most common and cited clustering algorithms in the scientific literature (Ester, Kriegel, Sander, & Wu, 1996). The algorithm mainly
has three steps (Schubert, Sander, Kriegel, Xu, & Ester, 2017): first, the user defines the radius for the searching of points, and then the algorithm will identify core points which have at least minPts number of neighbors. Second, find the connected components of core points on the neighbor graph, ignoring all non-core points. Finally, designate each non-core points to the cluster if it is within the radius of a nearby cluster. Otherwise, it will be identified as noise.
N
Figure 2-2 Illustration of dbscan (source: Wikipedia)
Using this algorithm, the user needs to define two parameters, the radius and the minimum number of points (minPts) within the radius. Lacking references in literature, the author used the result from kernel density estimation as a reference. Radius is defined as 1 000m to evaluate proximity by foot traffic, and most studies that evaluate pedestrian behavior in Shanghai use
1 000m as the study area (Chen, Jiao, Mao, & Wu, 2017; Pan, Shen, & Zhang, 2009; Xinjun, Hailong, & Yinghui, n.d.). For minPts, the author gradually increased the number from 3 to 12 and finally got a result that saw a similar pattern with kernel density estimation (see Figure 2-3). The algorithm will assign a db value to each of the points. Outlier points will be assigned -1, and others will be assigned value larger than -1 based on their cluster. Each point in the clusters will be assigned a value larger than minus one.
Figure 2-3 DBSCA analy'sis o/ clusters
2.2 Conceptual framework for cluster analysis
2.2.1 Literature review
CIS practice in Shanghai translates some theories mentioned in chapter one into practice. From
interviews with space managers, they are extremely sensitive to locations, emphasize community building and hosting events. The market of CIS in China is very competitive over the last three years, which it has already seen a wave of close-downs. When the author was investigating at the beginning of 2018, the CIS market in Shanghai has been relatively stabilized, and spatial patterns have generated within the city. In theory, in a market-based economy, what CIS managers
consider essential is user preference. CIS users are mainly creative, talents and high-skilled workers. Existing literature has discussed a lot about how non-market public goods, such as affordable housing, transportation, healthcare, education, leisure facilities, retail, natural
amenities makes certain places more attractive for creative and talent workers, and what spatial qualities shall urban planners and stakeholders value in knowledge-based urban developments (Florida, 2002, 2008; Glaeser & Saiz, 2003; Insch & Florek, 2008; Kunzmann, 2012;
Yigitcanlar, Baum, & Horton, 2007). Yigitcanlar (Yigitcanlar et al., 2007) expands the
discussion about social interactions and argues that because high-skilled workers process abstract information every day, it becomes a psychological necessity for them to have face to face
communications, to see and to be seen in public spaces. Therefore, parks with outdoor activities, streets with outdoor seatings, storefronts with transparent glass windows make the streetscape a stage-setting to help facilitate the psychological needs for this particular group (Yigitcanlar et al.,
2007).
2.2.2 Historical context
Most of the literature is based on the context in the U.S. and other western countries. Regarding the cultural differences between China and western countries, the author wants to take a review back to the history of the social and cultural context in Chinese cities.
2.2.2.1 Danwei
Danwei was the "basic unit of urban life" during the central planning period in socialist China. As Bray defined (Bray, 2005): "danwei is a generic term denoting the Chinese socialist
workplace and the specific range of practices that it embodies, which marks a common system shared by all urban Chinese workplaces."
The economic goal of China in the 1950s entailed transformation from a small-scale peasant economy to an industrialized nation. The policy at that time was to create state-owned enterprises for industries. Regarding science and technology, the government established Chinese Academy of Science and other industrial research institutes, where research institutes were dedicated to research, and universities were dedicated to education. As a result, the "danwei" model emerged as the physical response to this central planning strategy. Estimation showed that in 1978, 95% of urban residents were assigned to danwei (Lyu, Ding, Fan, & Meng,
R~1:
) Ii'Zr
-j I Ot ImjI
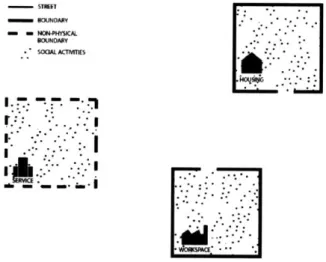
30m WORKSPACE SERVICE g c~r-HOUSINGFigure 2-5 An example Danwei layout of Beijing Cotton Factory
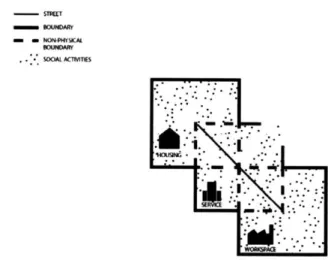
The design of a typical danwei model was a walled or fenced compound with controlled access points (gates). Headquarters will locate along or at the end of the central axis. A danwei complex
is designed to have three kinds of spaces: spaces for living, spaces for working and spaces for social services. These three spaces, although functionally distinct, remain physically
interconnected or juxtaposed. Amenities included within a danwei unit varied according to the 26
r.0Le
..
..
i!...
rI LoVAMP I I I'll 140status of danwei and shared in a hierarchical order. A high-status danwei will have well-developed shopping centers, schools, gyms, movie theatres and so on. A modest danwei will have only basic laundry spaces and some open spaces.
- OUNM
= mm
Figure 2-6 A conceptual diagram of Danwei model
In general, danwei mixes live, work and play within one spatial unit of the city. Through the design of space, it confines one's administration association, as well as creating a strong tight within the commune, where life and work can hardly separate.
2.2.2.2 High-tech Development Zone
After the 1978 open door policy, Chinese government focused their effort on restoring and reforming science and technology development. In 1988, the torch program was set up to expedite the development of science and technology sector. Following the theory of industrial agglomeration and inspired by the model of Silicon Valley and route 128, the high-tech
development zone was thus introduced on the urban edge. High-tech development zone is also the first attempt that Chinese urban planning institutes introduces the zoning system in the US.
zoning is employed to facilitate the agglomeration of high-tech research and production. Most of HIDZ were located on farmlands isolated from the urban center. Incubators, as an early form of
CIS, were mainly located in HIDZ or industrial parks.
L
200m
HOUSING SERVICE WORKSPACE
Figure 2-7 An example plan of HIDZ in Hefei
Over the years, many high-tech industrial parks have been praised for their contribution to total factor productivity, foreign direct investment, and local income level (Wang, 2013), as well as shaping the edge cities (Zheng et al. 2017). The most successful ones are Beijing ZGC and the Suzhou high-tech zone. However, developments of HIDZ also raised many controversies. Feldman criticizes the phenomenon that governments blindly rely on the cluster theory and
provides a substantial amount of subsidies, yet the city received little economic return and social benefits. It is not only a financial waste but also a waste of land resources. In many of the high-tech development zones in China, the financial subsidies did not bring the promised industrial agglomeration but raised many conflicts between the farmers and the government. Furthermore, it is also discovered there is a diminishing return of industrial agglomeration. A study of Beijing
ZGC suggests that recently, the park has been facing problems such as weakening linkage
between the university and industry, as well as rising rents that drives startups away (Tan, 2006). The spatial layout of HIDZ is radically different from any traditional Chinese city layout or the danwei layout. The streetscapes where used to be the spaces for everyday social interactions lost its unique spatial quality to be a claimable space to facilitate socializing. The segregation
between living spaces, workspaces, and public spaces becomes the primary defects of HIDZ. Big box shopping malls are designed as a substitution for social spaces. However, unlike danwei or
- SaNDWN -- NON*Ur
SOONA~1Rr
B
L 7.
Figure 2-8 A conceptual diagram of HIDZ
the traditional urban spaces, where the intimate building scale improvises encounters, and social interactions, the built environment of HIDZ prohibits everyday social lives happen due to a
On the other hand, there is a growing number of studies discussing how the quality of life and urban spaces affect location choices of high skilled workers (Chatterji, Glaeser, & Kerr, 2014; Florida, 2002). As most HIDZ are designed with wide streets targeting auto transportation, strict zoning regulations that separate live, work and play, as well as long distances from city centers, they are losing attractiveness for young urban professionals and talents.
2.2.2.3 Creative Industrial Clusters
The emergence of Creative industrial clusters (CIC) is a beginning to bring the production spaces back to the city center. CIC have formed largely as a transformation of danwei starting from the late 1990s. Many famous CIC such as 798 in Beijing and M50 in Shanghai were used to be state-owned factory-units in the 1950s. In the 1980s, many state-state-owned factories either moved to the high-tech development zones on the urban edge or declined with economic reform. Thus, they left a significant number of building stocks vacant or underutilized in central urban areas. After renovation and reprogramming, these underutilized properties become art galleries, artist studios, office spaces or lofts.
Red Town is an economically successful example of CIC in Shanghai. The site of the red town was a factory established in 1956 (Lu, 2016). The project started with a sculptural park as the central public art space. The typical typology in Red Town is commercial spaces on the ground level, such as restaurants, coffee shops, dessert shops or gallery spaces, while offices are on the second floor. Therefore, it combines social spaces with production spaces, which has ambient street-level activities as well as a relatively independent production space.
Figure 2-9 A conceptual digram of CIC
- mNDM
- - NOWFTYTAL
2.2.2.4 Knowledge-based Urban Development
Knowledge-based urban development (KBUD), also known as innovation district, has become one of the primary economic development strategies for many global city governments.
Although Chinese government promoted CIS instead of innovation district, many recent master plans have caught up with the buzzword "innovation and entrepreneurship," including the Xiong'an new city plan. Distinct from previous typologies, KBUD focuses on characters other than production spaces. One is the quality of urban life, and the other one is space for interaction. According to Katz and Wagner (Katz & Wagner, 2014), key factors of innovation districts are to integrate with its urban context; break organizational hierarchies; enhance interactions,
communication, and collaboration between industries and other knowledge communities; promote face-to-face interactions and eventually lead to technology advancement.
Knowledge community precincts in a city are not ivory towers in the urban jungle, nor communities gated against visitors and burglars. They are, ideally, catalytic locations for urban life. They are experimental life spaces for the next urban
generation and laboratories for testing new forms of work-leisure- home lifestyles.
(Yigitcanlar, 2010)
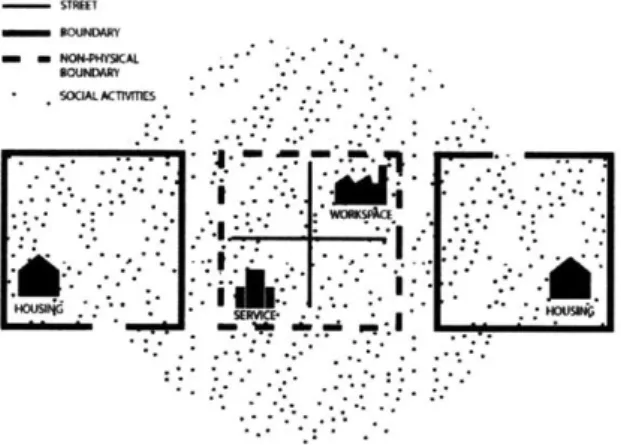
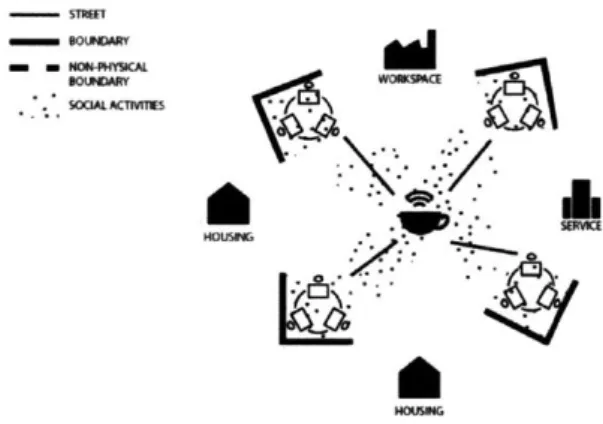
From a design perspective, the design of KBUD requires a compact spatial layout to increase density; integration to existing urban fabric; connectivity to public transportation; a diversity of programs and functions, as well as a diverse population; walkability and bikability, public spaces and social spaces for interaction, communication and collaboration (Katz & Wagner, 2014; Kunzmann, 2012; Yigitcanlar, 2010). Thus, the author proposes that, with the CIS
developments in Chinese cities, it will bring back the proximity between workspaces, live spaces and social spaces. Through the network constructed by CIS and other types of third places, spaces for social interactions and the sense of community will also resume in everyday life in Chinese cities (refer to Figure 2-10).
Figure 2-10 A conceptual diagram of KBUD
2.2.3 Survey Results
After a review of the literature and historical context, the author takes a closer look at the variables that can define or measure the live-work-play model mentioned above, as well as spaces for social interactions. At the beginning of 2018, the author went for a site visit to several
CIS. Interviews were conducted with 18 space users and 15 space managers (see appendix1).
Space users claim restaurants, and convenience stores are the most visited among CIS users.
72.2% of the users claim to be frequent visitors to convenient stores and restaurants. 50% of the users claim to be frequent visitors to coffee shops. 11 out of 17 users live in rental units, and their primary transportation method is by metro. Here (Figure 2-111) is a summary of the interview results, which will help construct the conceptual framework in the next chapter.
Figure 2-11 Survey results
Perspective from Space Managers
Proximity to metro station
64%
Proximity to restaurants
43%
Proximity to big companies 36%
Proximity to shopping mall 29% Proximity to housing 14% Perspective from Space Users Proximity to restaurants 100%
Proximity to metro station 92%
Proximity to shopping mail
42%
Proximity to housing
Chapter 3 Evaluating CIS clusters from six criteria
3.1 Six criteriaDrawn from the conclusions in the last part, the author comes to six criteria that are generated to direct the evaluation: affordable housing, connectivity (to anchor institutions), social space, are the three criteria refer to the live-work-play model. Building typology and walkability are two measurements for the built environment, and the last criterion, innovation environment is a conclusion of the evaluation of the innovation ecosystem of the cluster.
Affordable housing has been proposed as one of the essential public goods to attract creative
class and talents to the city (Kunzmann, 2012; Yigitcanlar et al., 2007). The affordability can be measured comparing rental units to owner-occupied housing developments. As Shanghai has a high price-to-rent ratio8, rental units represent a more affordable housing choice.
Social spaces such as coffee shops, bars, and restaurants, which are claimable spaces that people can have face-to-face interactions, are critical to the innovation ecosystem (Jackson, 2017).
Connectivity to anchor institutions or companies is one of the primary considerations for CIS
developers. As Glaeser argued (Glaeser et al., 1992), a diversity of industry will facilitate knowledge spillover and thus, expedite the growth of industries.
Building typology: As many scholars have claimed, having a variety of building ages is a
critical factor to attract CIS (Feldman & Choi, 2015; Zapalac, 2015). Thus, looking into the
8 Price-to-rent ratio in Shanghai is 45 vs Boston is 28.7 in 2017. 34
building typologies in the neighborhood will be an excellent way to understand how the urban form could have an impact on the clustering effect of CIS.
Walkability has been elaborated in the literature review part that it is a crucial component in the
development of innovation district. Walkability is also a representation of the live-work-play model that emphasize urban life quality, rather than the production spaces itself.
Innovation environment is a concluding measurement for the previous five characters and also
incorporate interviews with CIS users to evaluate how these CIS clusters perform in the urban environment.
The first three criteria will be examined using statistical modeling. The latter three criteria will use case studies to examine partially because of data limitation, and partially because certain aspects in the latter three criteria need to have a closer look into the context beyond merely data analysis.
3.2 Statistical model
Affordable housing, social spaces, and connectivity reflect three aspects of live, play and work respectively. The construction of the model will mainly focus on whether the emerging CIS clusters respond to the live-work-play urban development model. Other factors such as gravity index of entertainment facilities and its Shannon diversity index, accessibility to metro stations, distance to city center, gravity index of shopping malls, gravity index of convenient stores will be included in the model as control variables (Zi).
0 if CIS's db value is - 1 1 if CIS's db value is > 0
yi* = oc +f31Livei + f32Worki + fl3SocialSpacei + fl4Zj + E (1)
For living spaces, accessibility to housing and rental units are the indicators. For workspaces, accessibility to anchor companies (as defined in the POI dataset), accessibility to IT companies, distance to the nearest university, accessibility to research institutes are the indicators. For social
spaces, accessibility to coffee shops, bars, parks, Chinese restaurants and exotic restaurants are included. Control variables include accessibility to restaurants, entertainment facilities, metro
stations, retail and distance to city center9. The gravity index is used to measure accessibility. Gravityr[i] represents a node i at a radius of r is defined as follow:
Gravityr [ = [j]
jEG-ti ;dli,jlr
(2)
/ is the exponent that controls the effect of distance decay on each shortest path between i and
j,
d[ij] is the distance between i and j. In this thesis, # is set to be 0.002 (Sevtsuk, 2017). W[j] is
the weight of a specific destinationj that is within the defined radius r from i, however, this thesis will not include any weight because of the limitation of the data.
9 People plaza as the city center.
Table 3-1 Summary table of independani variables Description Mean Housing Irental Workspaces AnchorCompany IT University ResearchInstitutions Social Spaces Coffee Bar Park ChineseRes ForeignRes
Continuous variable, gravity index between the CIS and all reachable housing developments (centroid) within a
1 000m radius
Continuous variable, a log of gravity index between the
CIS and all reachable rental units within the 1 000m
radius
Continuous variable, gravity index between the CIS and all reachable anchor companies within a 1000m radius Continuous variable, gravity index between the CIS and all reachable IT companies within a I 000m radius Continuous variable, the distance between the CIS and its nearest university gate (m)
Continuous variable, gravity index between the CIS and all reachable research institutions within a 1 000m radius
Continuous variable, gravity index between the CIS and all reachable research coffee shops within a 1 000m radius
Continuous variable, gravity index between the CIS and all reachable research bars within a I 000m radius Continuous variable, gravity index between the CIS and all reachable research parks(centroid) within a 1 000m radius
Continuous variable, gravity index between the CIS and all reachable research Chinese restaurants within the
I000m radius
Continuous variable, gravity index between the CIS and all reachable research foreign restaurants within the
1 000m radius 34.531 26.520 -1.737 6.312 0.245 0.462 10.830 9.794 872.463 896.197 4.302 5.459 9.994 10.785 4.556 6.594 0.946 1.165 64.667 60.683 23.012 26.604 Variables Living Spaces Std
Table 3-2 Probit model of CIS cluster
Live Work Play L-W-P
Living paces Housing 0.006*** 0.007*** irental -0.009** -0.005 Workspaces AnchorCompany -0.169*** -0.195*** IT 0.019*** 0.015*** University -0.0001* -0.00005 ResearchInstitutions -0.002 -0.006 Social Spaces Coffee 0.011 0.003 Bar -0.014 -0.017 Park 0.110*** 0.088*** ChineseRes 0.002* 0.001 ForeignRes 0.002 0.006**
Control variables YES YES YES YES
Observations 361 361 361 361
pseudo R2 0.227 0.312 0.291 0.401
*p<0.1; **p<0.05; ***p<0.01
Some results from this model are counter-intuitive and do not align with the findings from the interview and existing literature. For example, the result of rental units, as well as distance to universities, research institutions, coffee shops and Chinese restaurants do not show any significant results. The cluster method used here may be problematic. The dbscan method is based on point-to-point linear distance without considering the road network. However, the independent variables take into consideration of road network and distance decay. Thus, the 38
calculation of independent variables does not align with the calculation of the dependent variable.
Given this mismatch of calculation method, the author employs a third methodology to define the density of CIS: the gravity method, which aligns with the calculation of the independent variables. The gravity index of a particular CIS i is the sum of the decayed distance between point i and all the other CIS within the 1000m radius (Sevtsuk & Mekonnen, 2012). Therefore, the measure of density is a more accurate measure of the network, which takes into consideration pedestrian travel between different spaces. From interviews, events held in many CIS are open to other community members, therefore, if there are more CIS around within a 15 minutes walking distance, the more attractive the CIS will be and the larger a community it can reach. The author remapped the CIS gravity index and achieved a similar result with the previous two mapping results ( Figure 3-/).
V V. -A
)
I-i
t 'N-Tb
Si
J4A 'tat-'7
'(K
jt, -~40PS,
14
T Knowleqge innovation Co ni 'O -qn an pie Cluster 4N (KC) 1 it Oust n 4 6.~# cluster, fr 4 59 1 14,Figure 3-1 CIS cluster map in Shanghai using gravity index as the measurement
Table 3-3 OLS Model
Variables Live Work Play L-W-P
Living Spaces Housing -0.018** -0.015** irental 0.025 0.041** Workspaces AnchorCompany 0.241 -0.328 IT 0.184*** 0.162*** University -0.0004*** -0.0004*** ResearchInstitutions -0.023 -0.031 Social Spaces Coffee 0.077** 0.070** Bar 0.108* 0.255*** Park 0.075 -0.228** ChineseRes 0.026*** 0.026*** ForeignRes 0.037*** 0.008
Control variables YES YES YES YES
Observations 361 361 361 361
Adjusted R2 0.114 0.346 0.298 0.477
*p<0.1; **p<0.05; ***p<0.01
In Table 3-2 and Table 3-3, each of the two tables has four models: live, work, play and live-work-play. The live model only includes parameters associated with living spaces and control variables. The work model only includes parameters associated with workspaces and control variables. The play model only includes parameters associated with social spaces and control variables. The live-work-play model includes all parameters and control variables. Comparing
the first three models in each table, the work model always has the highest value of r square, which means that the industry has the largest impact on CIS clusters compared to the other two. This finding aligns with Darchen and Tremblay's (Darchen & Tremblay, 2010) argument that the quality of space does not play as important as a role of career choices among knowledge workers/ creative class.
3.2.1 Connectivity
For industry part, there are two factors significantly contributing to the clustering of CIS. When accessibility to IT firms increases by one, the gravity index of the CIS increases by 0.162. When the distance to the nearest university decreases by one kilometer, the gravity index of the CIS increases by 0.4. These results indicate that CIS tend to cluster near IT companies and
universities.
The effect of universities to innovation industries has been well documented in the
literature(Chatterji et al., 2014). The first reason is the innovation spillover from universities. Being close to university means more cooperation with university professors and more opportunities to convert innovation into commercial products. The second reason is the talent from universities. Encourage college graduates to start their own companies is one of the initiatives that follow the mass innovation and entrepreneurship initiative. Therefore, college students are potential users for CIS and many CIS are jointly funded by the university and government. Lastly, being close to universities means more affordability and more opportunities for knowledge exchange for CIS users. During one of the interviews with one CIS user, he claimed that being close to university has many advantages. One is that he can go to school's cafeteria for lunch, which is much more affordable for an early stage entrepreneur. The other 42
advantage is that he can get easy access to the lectures and talks hosted by the university.
Therefore, it is economical to work near universities, and being close to universities makes easy access to knowledge. These two advantages are especially important to early entrepreneurs and high-skilled workers.
The impact of IT industry has not documented in the literature. However, the accessibility to IT companies remained strongly significant in many models that the author tried, which also adds to the higher prediction ability of the model. Meanwhile, the rapid expansion of the IT industry in China in recent years has been a phenomenon. In recent years, IT industry has the highest growth rate among other industries and has fostered a large number of startups, such as internet
platforms related to the shared economy, e-commerce, and also new media. Therefore, IT startups are the major users of CIS and CIS cluster in an area where it has a high IT industry density to gain access to a larger pool of potential users.
3.2.2 Affordable housing
Regarding places for living, owner-occupied housing has an negative effect on the clustering of
CIS, whereas renter-occupied units, has a positive effect on the clustering of CIS. This statistical
finding also aligns with the interviews, where 64.7% CIS users are renters. Results from table 2 suggest that when gravity index between CIS and rental units increases by one, the gravity index of CIS will increase by 0.041. However, when gravity index between CIS and housing
developments increases by one, the gravity index of CIS will decrease by 0.015. These empirical results suggest that CIS tend to cluster in places where there are more available rental units instead of owner-occupied housing developments.
One reason is that many of the CIS users are new graduates from college, and they cannot afford to purchase housing units in Shanghai. Another reason is that for many entrepreneurs, time is precious for them. Since the market competition is intense, many entrepreneurs have no regular working hours, let alone weekends. Therefore, entrepreneurs cannot afford long commuting hours and being able to live nearby is of critical importance. The results show some instability between table 1 and table 2. The limitation here is the lack of subway network in the calculation. Since the previous survey indicates that 70.6% of CIS users commute mainly by metro, when calculating the gravity index between CIS and housing units, the author shall also add the subway network into the calculation. However, due to the limitation of the subway network data and time, this thesis only considers the reachable housing developments within the 1 000m radius.
3.2.3 Social Spaces
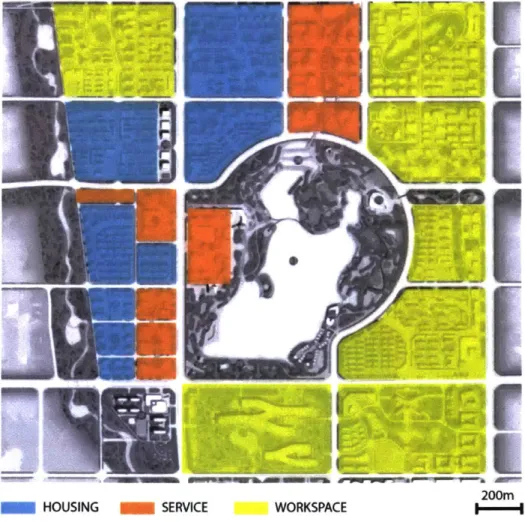
For social spaces, accessibility to coffee shops, bars, and Chinese restaurants play a positive role in the clustering of CIS, while parks play a negative role. While findings for coffee shops and restaurants align with existing literature (Green, 2014; Jackson, 2017; van Oort, Weterings, & Verlinde, 2003), the effect of the park is contrary to one paper from Yigitcanlar (Yigitcanlar et al., 2007). There are three explanations to interpret this different finding.
First, Yigitcanlar focused on Australian cities, where it has a different cultural context. Second, many parks in Shanghai occupy a large area separated by major infrastructures, such as
highways (Figure 3-2). Therefore, the actual accessibility to parks is low. Finally, office
buildings around park spaces are usually expensive. For startups or CIS users, it is less likely that
they are willing to pay the premium for parks or open spaces. Therefore, CIS tend not to cluster around parks.
One adding here is about the restaurants. In China, restaurants are the primary places for meetings and businesses. Therefore, restaurants are also an important social space for Chinese entrepreneurs. One conclusion here is worth noticing, regarding social spaces, restaurants, bars and coffee shops, compared to parks, are privately owned public spaces which are semi-private or semi-public, which adds a layer of public spaces and social life. An example of Jiang'an Temple Cluster is demonstrated here: for every CIS, there are more than 100 social spaces reachable within the I000m radius (Figure 3-3).
Parks**
Ip 4 A 2 #fmh4
,e~~~RinggRoad Park 67cis
LL Metro Station
University Social Spaces
Figure 3-3 Reachable social spaces fron CIS in JTC
46
3.3 Case studies
As discussed previously, the latter three criteria (building typology, walkability, and innovation environment) will be evaluated using case studies. Among the four clusters, the Caohejing cluster and Zhangjiang cluster are located in high-tech development zones, which are out of the discussion in this thesis. Thus, the case study will use knowledge innovation community (KIC) and Jing' an cluster (JTC) as the case study sites.
KIC is a public-private-partnership development project jointly developed by a Hongkong real estate developer, Shui-on group, and Yangpu district government. With physical proximity to two famous universities in Shanghai, the project brand itself as the community of innovation and entrepreneurship. KIC has an even number of public funded CIS and private funded CIS, with the lowest rent prices and vacancy rate.
JTC located in the old city center of Shanghai has the highest concentration of CIS in Shanghai
but also has the highest average rent prices. The formation of the cluster is a bottom-up process, which is an opposite approach with KIC. According to government reports'0, the potential of
JTC will keep rising in following years. The author thinks it will be interesting to compare KIC
case with JTC case since both of them are successful in different dimensions with entirely different approaches.
3.3.1 Building typology
3.3.1.1 JTC
Jing'an Temple community resides in the old city center of Shanghai, which is also a part of the old French concession area. Because of its richness in culture, it is also known as the place for creative class in recent years. Rather than the ubiquitous new towns constructed in a few years, evolvement in the city center is an incremental process, resulting in a mixture of low rise fine-grained neighborhoods and high-rise tower structures, maintaining its livability, its richness in culture and at the same time flourish regarding economic development (Zhou, 2017).
The neighborhood has quite a vast range of different building typologies, ranging from the most expensive class A office buildings along Nanjing West Road to the old and dilapidated, two-story height residential buildings back in the early 1920s. The diversity of building typologies leads to attractions of different types of production entities. Big brand transnational companies locate in the pricy Class A office buildings, whereas art studios, small and medium enterprises rent in lower prices in the old neighborhoods, which is affordable but with excellent location and resources.
The diversity of building typologies JTC also attracts a diversity of CIS developers, including major players in both global and local market, such as wework, xnode, Soho 3Q, fttown, and so on. Not only the CIS developers are from different backgrounds, but also their occupants. In Xnode, 50% of its occupants come from abroad, and their startup teams come from 18 different countries. CIS such as Xnode and Wework provide a platform for startups from abroad to make their path in markets in China. Most foreigners are more comfortable in hanging around JTC, because of its spatial qualities and its unique cultural characters.
Building Typology
Jing'an Temple Cluster (JTC)
Figure 3-4 Building tvpologies in Jing'an Temple
3.3.1.2 KIC
The design of KIC emphasized on creating diversity regarding building typologies to attract different types of tenants, thus accommodate a mixture of big and small firms. A 20-meter wide expressway Songhu Road divides the site of KIC, which divide this project into two distinct neighborhood scales. On the east side of Songhu Road, where it has the historical stadium nearby, the neighborhood scale is relatively big. Because of the historic stadium on the east, the height limit of this block adjacent to the stadium is 50m. The building typology on the east side has large anchor companies in IT industries, such as Google, IBM and so on.
KIC on the west side provides a more intimate building scale. Each block is about 100m by 55m, with building depth being approximately 6m or so. The buildings are designed with loft units,
which are ideal spaces for startup companies. The spatial character of loft gives the flexibility to mix work and live. Its flexible spatial layout allows entrepreneurs to adapt the space to their
offices, labs, or galleries. If combined with ground floor parking space or retail space, it creates more design opportunities with a two-story space and thus stimulates the social life on the street level.
However, these two sites are spatially segregated by the wide road in between. Unlike JTC, CIS developers and users in KIC are mostly related to IT-related industries, and many of them are funded by IT-related companies, such as Tencent, itjuzi, and innoway.
3.3.2 Walkability
Walkability relates to three characteristics: ground level commercial activities, edge
permeability, parcel width, and setback space (Sevtsuk, Kalvo, & Ekmekci, 2016). Limited to data availability, the author is only able to map out the ground level commercial activities, edge permeability and some of the setback conditions for each of the clusters.
3.3.2.1 JTC
Figure 3-5 shows the betweenness of the streets between CIS and metro stations' ", ground level commercial activities, edge permeability and the setback conditions. It can be observed from the map that CIS and ground level commercial activities are more likely to located at the "back street" or branch roads, where it is not the most used roads with major public transportation access.
" The betweeness level represents how often the street will be used between the origin and destinition. In this case,
the origin is the CIS, and the destinition is the metro station.
-JT-ew bBetweenness
High LOW .
t wh - wl tCoffee, bar, restaurant
- *.. ii Parks
-- Wall or Fence - . . .Transparent
Figure 3-5 A portion of JTC CIS cluster network
In JTC, when walking between those CIS, you can find yourself crowded in these kinds of narrow streets with people and traffic. The cafes and restaurants were initially the first floor of
residential units, transformed to commercial activities. From the street section, you can see the street is not designed to accommodate such social spaces, but because of the demand, these spaces are emerging in the neighborhood and encroaching the public spaces to the most extent. In some cases, there is only 0.6m for the width of pedestrian (Figure 3-6). Although crowded, this is a lively social space for interactions.
I
UI
iLU,
0. El]
i -i l J 1J\ 0rim, M
116 Hi
I r!
i 71 ALL T7 W rEli
1. -1 111-! j M /1~J1JjJ1
0.6 m 1.2 mFigure 3-6 A street section of Yuyuan Road
3.3.2.2 KIC
For the case in KIC, walkability is one of the key points emphasized in the design process. University Road, which is a road connecting the universities on the west side to the metro station on the east side, has been one of the example street design written in Shanghai's new street design guidelines. As explained in the previous section, the loft design makes a lively public