HAL Id: hal-02986741
https://hal.archives-ouvertes.fr/hal-02986741
Submitted on 17 Nov 2020HAL is a multi-disciplinary open access archive for the deposit and dissemination of sci-entific research documents, whether they are pub-lished or not. The documents may come from teaching and research institutions in France or abroad, or from public or private research centers.
L’archive ouverte pluridisciplinaire HAL, est destinée au dépôt et à la diffusion de documents scientifiques de niveau recherche, publiés ou non, émanant des établissements d’enseignement et de recherche français ou étrangers, des laboratoires publics ou privés.
Influence of dopant size and doping method on the
structure and thermoelectric properties of PBTTT films
doped with F 6 TCNNQ and F 4 TCNQ
Vishnu Vijayakumar, Pablo Durand, Huiyan Zeng, Viktoriia Untilova,
Laurent Herrmann, Patrick Algayer, Nicolas Leclerc, Martin Brinkmann
To cite this version:
Vishnu Vijayakumar, Pablo Durand, Huiyan Zeng, Viktoriia Untilova, Laurent Herrmann, et al.. Influence of dopant size and doping method on the structure and thermoelectric properties of PBTTT films doped with F 6 TCNNQ and F 4 TCNQ. Journal of Materials Chemistry C, Royal Society of Chemistry, 2020, �10.1039/d0tc02828b�. �hal-02986741�
Influence of dopant size and doping method on the structure and
thermoelectric properties of PBTTT films doped with F
6TCNNQ and
F
4TCNQ
Vishnu Vijayakumar
1, Pablo Durand
2, Huiyan Zeng
1, Viktoriia Untilova
1, Laurent
Herrmann
1, Patrick Algayer
1, Nicolas Leclerc
2*, Martin Brinkmann
1*(1) Université de Strasbourg, CNRS, ICS UPR 22, F-67000 Strasbourg, France (2) Université de Strasbourg, CNRS, ICPEES UMR 7515, F-67087 Strasbourg, France
2 Corresp. Authors : martin.brinkmann@ics-cnrs.unistra.fr
leclercn@unistra.fr
Abstract
Doped polymer semiconductors are ideal candidates to capture waste heat in ambient conditions using modest temperature gradients close to room temperature. Mastering the doping mechanism of polymer semiconductors is therefore crucial to enhance the performances of these materials. This study focuses on the structure-property correlations in oriented films of poly(2,5-bis(3-dodecyl-2-thienyl)thieno[3,2-b]thiophene) (C12-PBTTT) doped with
1,3,4,5,7,8-Hexafluoro-tetracyanonaphthoquinodimethane (F6TCNNQ) and
2,3,5,6-tetrafluoro-7,7,8,8-tetracyano-quinodimethane (F4TCNQ). Slower diffusion of the larger F6TCNNQ molecules in PBTTT crystals
results in a better ordering upon intercalation in the layers of alkyl side chains as compared to F4TCNQ. Both, the higher degree of polymer chain oxidation and ordering of F6TCNNQ- dopants in
the C12-PBTTT crystals accounts for the improved electrical conductivity and thermoelectric
properties. A new doping protocol called “incremental concentration doping” leads to electrical conductivities of up to 2400 S/cm and thermoelectric power factors of 530±200 µWm-1K-2 in aligned C12-PBTTT doped with F6TCNNQ. The progressive intercalation of dopants helps preserve the high
level of order initially present in the aligned C12-PBTTT films, hence, to reach higher charge
mobilities. The correlations between thermopower S and charge conductivity measured parallel and perpendicular to the polythiophene chain follow two master curves regardless of the chemical
3
nature of the dopant: S-1/4 along the chain direction whereas S-ln( perpendicular to the chains.
1. Introduction
Conducting polymers are of central interest in plastic electronics not only for their charge transport properties used for instance in polymer injection layers using for instance poly(3,4-ethylenedioxythiophene)/poly(styrenesulfonate) (PEDOT: PSS) but also for their interesting thermoelectric (TE) properties. [1] TE properties of conducting polymers depend on several quantities such as their charge conductivity , their Seebeck coefficient S and their thermal conductivity . Ideally, a good TE material should have high and S and low . Since the measure of is difficult, the performance of TE materials is often quantified by their power factor PF=S2. Several studies on doped polythiophenes have shown that the power factor PF scales with the charge conductivity such as PF . This is why a common strategy to enhance TE properties of polymers is to maximize their charge conductivity i.e. the charge mobility and the charge carrier density, while keeping to a minimum.
Doping is a well-known method to transform polymer semi-conductors (PSCs) such as regioregular poly(3-hexylthiophene) or PBTTT into conducting ones.[2–6] P-type doping of PSC is readily performed by using acceptor molecules such as 2,3,5,6-tetrafluoro-7,7,8,8-tetracyanoquinodimethane (F4TCNQ) that can withdraw an electron from the PSC and create
positively-charged polarons on the polymer backbone. Various groups have focused on the doping method as a handle to reach improved TE performances in doped polymer semiconductor films.[7–12]
4
Sequential doping, i.e. the doping of a highly crystalline PSC film with a dopant solution in an orthogonal solvent is an effective method to enhance the TE properties as compared to direct mixing of polymer and dopant in a common solvent.[9,10,13,14] Vapor phase doping leads to even higher charge conductivities as it preserves order along the chain direction in the doped polymer crystals. As demonstrated in previous studies, dopants such as F4TCNQ are mainly intercalated in the layers of
alkyl side chains of the polymers[15,16] and the highest possible doping level depends on the length and packing of alkyl side chains. [16] The final thermoelectric properties of the doped films can further be enhanced if the films are oriented. [14-16] Both, thermopower and charge conductivity are augmented in aligned P3HT and PBTTT films along the chain direction, making it possible to improve substantially the TE power factor of the layers.
The choice of the dopant is also of paramount importance. The LUMO level of the acceptor molecules must be well situated with respect to the HOMO of the p-type polymer. The high electrical conductivity observed in F4TCNQ doped polythiophenes relates to the favorable energetic
offset between the HOMO of the polymer and the LUMO of F4TCNQ. For instance, the HOMO of
P3HT and PBTTT is in the range -4.8 eV to - 5.2 eV versus -5.24 eV for the LUMO of F4TCNQ (see
Figure 1). Besides F4TCNQ, stronger inorganic dopants such as I2 and FeCl3 have also been used with
P3HT and PBTTT. [17, 18] Doping aligned films of C12-PBTTT with FeCl3 leads to very high conductivities
of the order of 105 S/cm.[15] However, FeCl3 and I2 are difficult to use because of both their high
instability in air and corrosive nature. [19,20] In this perspective, the electron-deficient molecular dopant 1,3,4,5,7,8-Hexafluoro-tetracyanonaphthoquinodimethane (F6TCNNQ) (see figure 1) is
particularly appealing.[21,22] Karpov and co-workers showed that doping P3HT with F6TCNNQ allows
to reach charge conductivities of 7 S/cm i.e. larger than for F4TCNQ doping. [22] The improved
electrical conductivity was attributed to a combination of higher charge carrier mobilities and higher doping strength (LUMO at -5.37 eV for F6TCNNQ versus -5.24 eV for F4TCNQ) leading to a higher
charge carrier concentration. Moreover, integer charge transfer between P3HT and F6TCNNQ was
5
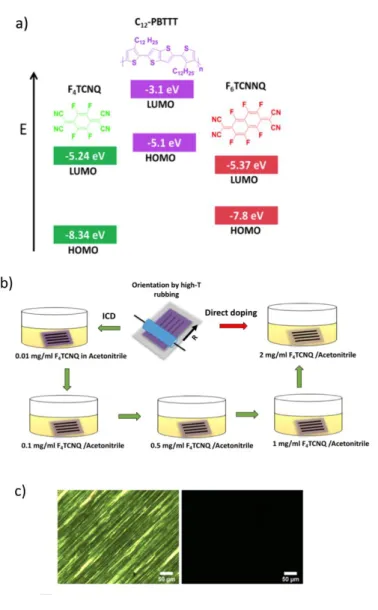
Figure 1. A) Schematic representation of HOMO and LUMO levels F4TCNQ, F6TCNNQ and C12-PBTTT.
B) Two-step preparation of highly oriented and crystalline C12-PBTTT films. Schematic illustration of
incremental concentration doping (ICD) and direct doping (DD). The first step consists of chain alignment and crystallization by high-T rubbing followed by sequential doping in solutions of F4TCNQ
or F6TCNNQ in acetonitrile. ICD implies doping the same sample with solutions of increasing
concentration whereas for DD, the sample is directly doped at a high concentration. C) Polarized optical microscopic images of F6TCNNQ doped C12-PBTTT using the ICD method and showing high
6
birefringence (TR =125C , film doped up to CF4TCNQ= 1mg/ml) i.e. preservation of alignment after
doping.
Given the proposed context and state-of-the-art, the present contribution aims at investigating the following important issues. First, we want to know to what extent the doping of C12-PBTTT with
F6TCNNQ differs from that with F4TCNQ in terms of structure, doping kinetics and resulting TE
properties. We will also determine how the intercalation of F4TCNQ in the layers of alkyl side chains
of C12-PBTTT compares with that of F6TCNNQ. Importantly, we will investigate the relationship
between the degree of order of the dopant anions in the PSC and the resulting electrical conductivities.
To answer these issues, we have chosen C12-PBTTT as a model PSC (see Figure 1). This polymer is
readily aligned by high-temperature rubbing leading to dichroic ratio beyond 15. [24,25] Polarized UV-Vis-NIR spectroscopy and low dose electron diffraction have been used to uncover the location and orientation of the dopant anions in the side chain layers of C12-PBTTT. Polarized UV-Vis-NIR
spectroscopy helped determine the correlations between the orientation of the dopant anions and the polythiophene backbones. Polarized UV-vis-NIR spectroscopy has been used to measure the diffusion kinetics of both F4TCNQ and F6TCNNQ into the layers of the interdigitated alkyl side chains
of C12-PBTTT. [16]
Finally, a new protocol for sequential doping called incremental concentration doping (ICD) is introduced with the objective to intercalate dopant molecules in a progressive manner in the structure of C12-PBTTT. The changes in the crystal structure of the thin films were followed by low
dose electron diffraction. Promising thermoelectric performances are observed record conductivities of 2430±500 S/cm and PF=530 µWm-1K-2.
7 2. Results and discussion.
2.1 Fabrication of highly oriented conducting PBTTT thin films.
It has been shown that polymers such as PBTTT can be easily oriented by rubbing at high temperature.[24,25] Based on these results, oriented C12-PBTTT thin films were doped sequentially by
dipping the films in acetonitrile solutions of F4TCNQ and F6TCNNQ, respectively (see figure 1B). The
doped thin films show high levels of orientation evidenced by polarized optical microscopy (see figure 1C). Herein we introduce a new doping procedure called “incremental concentration doping” (ICD). It is a modified version of classical sequential doping (see figure 1.B). In ICD, the oriented thin films are doped by dipping a given sample successively in solutions of dopants of increasing concentration. This is different from the conventional sequential doping referred to as direct doping (DD) for which each sample is dipped a single time in a solution of given concentration. In this study, all the thin films are doped by ICD and direct doping is used as a reference.
2.2. Spectroscopic signatures of polarons and anions obtained by polarized UV-vis-NIR spectroscopy.
Let us first present the spectroscopic signatures of the two dopants and corresponding anions in solution. Both, F4TCNQ- and F6TCNNQ- anions display distinct signatures in the form of vibronic
structures. In order to confirm the presence of the F6TCNNQ- anions in the thin films of PBTTT, a
solution of pure F6TCNNQ- anions was prepared by reduction with ferrocene in dichloromethane, the
corresponding UV-Vis-NIR spectrum is shown in figure 2 and compared to that of F6TCNNQ.
F6TCNNQ- shows characteristic bands at 1143, 976 and 850 nm and there are no corresponding
absorption bands in that spectral range for neutral F6TCNNQ. The latter is characterized by two
8
extinction coefficient of F6TCNNQ- has been determined and amounts to 53700 L.Mol-1.cm-1 (see
Figure ESI1). As seen in figure 2, the vibronic structure of the F6TCNNQ- anions in the doped C12
-PBTTT films matches quite well that of the anion in solution. There is only a small redshift in the thin films (1157 nm versus 1143 nm in solution).
Having identified the spectral signatures of the F6TCNNQ- anion, we can now analyze in more
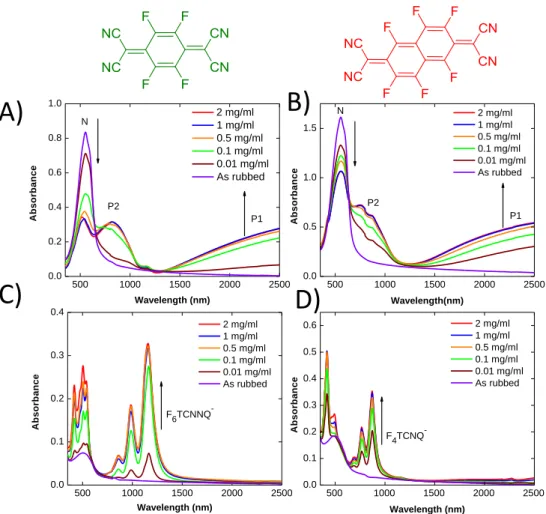
details the polarized UV-vis-NIR spectra of the films doped with F6TCNNQ. As seen in Figure 3A, the
polaronic bands P1 and P2 are polarized along the rubbing direction and their intensities increase with doping concentration and saturate once the concentration reaches 0.5 mg/ml. Even for very low doping concentrations such as 0.01 mg/ml, the P1 and P2 bands are present. Contrary to the polaronic bands, the absorption bands of the neutral polymer (N) decrease with increasing dopant concentration. The polarized UV-Vis-NIR spectra along the perpendicular direction are dominated by the absorption bands of the F6TCNNQ- anions. As observed in our previous studies,[15,16] the
F6TCNNQ- anion bands are polarized perpendicular to the rubbing direction. This demonstrates that,
both F4TCNQ- and F6TCNNQ- anions are intercalated in the layers of the interdigitated side chains of
9
Figure 2. Absorption in solution of neutral F6TCNNQ (blue) andF6TCNNQ- anion (brown) after
reduction with ferrocene. The absorption of F6TCNNQ- in thin films is shown in red.
For both F4TCNQ and F6TCNNQdopants, the intensity of the anion bands increased with doping
concentration and saturates for C= 0.5-1.0 mg/ml. The polaron bands P1 and P2 show a similar saturation for POL//R. Interestingly, no absorption from the polarons is seen for POL R. In the case of P3HT, this absence has been attributed to the fact that the amorphous phase of P3HT is little doped with F4TCNQ due to a larger offset between the amorphous polymer’s HOMO and the
dopant’s LUMO as compared to crystalline P3HT.[26] The present results with F
6TCNNQ suggest a
similar effect for C12-PBTTT: F6TCNNQ cannot dope efficiently the amorphous phase of C12-PBTTT.
The comparison with the study on FeCl3-doped C12-PBTTT further confirms this point.[14] It has been
shown that FeCl3 is able to dope both the amorphous and ordered phase of C12-PBTTT, as inferred
10
Figure 3. A) and B) Evolution of the UV-Vis-NIR spectra of rubbed C12-PBTTT films doped with
increasing concentration of F4TCNQ for POL//R and for POL R, respectively. C) and D) Evolution of
the UV-Vis-NIR spectra of rubbed C12-PBTTT films doped with increasing concentration of F6TCNNQ
for POL//R and for POL R, respectively. P1 and P2 correspond to polaronic bands of doped C12-PBTTT
and the neutral polymer absorption is labelled as N.
Comparing the UV-vis-NIR spectra of F4TCNQ and F6TCNNQ-doped films shows differences in the
apparent P1 and P2 band positions. For F6TCNNQ, P2 is centered at 824 nm whereas for F4TCNQ, it is
centered around 780nm. The shape of the P1 bands, with the appearance of a plateau/saturation in P1 absorption in the F4TCNQ case, suggests a similar red-shifted band position for F6TCNNQ. The
position of the polaronic bands is linked to the localization of the polarons due to Coulombic
500 1000 1500 2000 2500 0.0 0.2 0.4 0.6 0.8 1.0 N A b s o rb a n c e Wavelength (nm) 2 mg/ml 1 mg/ml 0.5 mg/ml 0.1 mg/ml 0.01 mg/ml As rubbed P1 P2 500 1000 1500 2000 2500 0.0 0.1 0.2 0.3 0.4 A b s o rb a n c e Wavelength (nm) 2 mg/ml 1 mg/ml 0.5 mg/ml 0.1 mg/ml 0.01 mg/ml As rubbed F6TCNNQ -500 1000 1500 2000 2500 0.0 0.1 0.2 0.3 0.4 0.5 0.6 A b s o rb a n c e Wavelength (nm) 2 mg/ml 1 mg/ml 0.5 mg/ml 0.1 mg/ml 0.01 mg/ml As rubbed F 4TCNQ -500 1000 1500 2000 2500 0.0 0.5 1.0 1.5 2 mg/ml 1 mg/ml 0.5 mg/ml 0.1 mg/ml 0.01 mg/ml As rubbed A b s o rb a n c e Wavelength(nm) P2 N P1
A)
B)
C)
D)
11
interactions with the anions as demonstrated by Ghosh et al.[27, 28] Accordingly, the polaron seems to be more delocalized in the case of F6TCNNQ as compared to F4TCNQ.
Another important difference is related to the oxidation level of the PBTTT chains. Figure 3A and B show that the contribution of neutral PBTTT to the absorption is larger for the films doped with F4TCNQ than F6TCNNQ. The presence of remaining neutral polymer absorption (N) was attributed to
the presence of undoped polymer chain segments in the doped films. A lower remaining absorbance of the neutral polymer for F6TCNNQ indicates higher overall oxidation of C12-PBTTT as compared to
F4TCNQ. This is consistent with the lower lying LUMO of F6TCNNQ, favoring charge transfer to the
PBTTT chains. Integer charge transfer between polymer and dopant is evidenced from the linear dependence between polaron and anion absorbances for both F4TCNQ- and F6TCNNQ- (see figure
ESI2). Accordingly, F6TCNNQ seems to induce a larger doping level of the polymer, hence, should
induce a higher charge carrier density (vide infra).
2.3. Doping kinetics.
The fact that the UV-vis-NIR spectra for POL R are dominated by the absorption of the dopant anions helped determine the diffusion coefficients of the dopantanions into the layers of the alkyl side chains of the thin films. Polarized UV- Vis-NIR spectroscopy can be used to follow the time dependence of the absorbance of both F4TCNQ- (875 nm) and F6TCNNQ- (1158 nm) anions (see
figure ESI3) versus doping time. [15,16] The kinetics of dopant diffusion into the C12-PBTTT thin films
are measured by recording the UV-vis-NIR spectra of the doped films for various doping times.
The contact time of the oriented polymer with the dopant solution is increased and the corresponding UV-Vis-NIR spectra along both perpendicular and parallel directions are recorded (see figure ESI3A-D). The signals of the dopant anions are visible even for short contact time of 5s and their intensity increases and saturate with doping time.
12
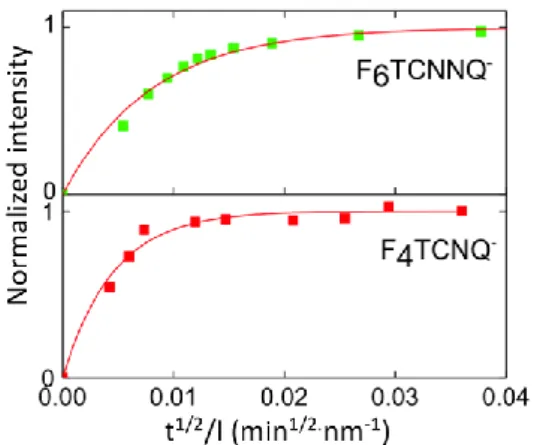
For short doping times, the absorption of both dopant anions scales like . This is an indication for a diffusion-limited doping mechanism. The saturation observed for longer doping times is due to the finite film thickness: the whole film is doped after 6-10 min (see Figure ESI3).The fact that no clear absorption of the neutral F6TCNNQ is seen in the UV-vis-NIR spectra indicates that the
time-dependence of the F6TCNNQ- bands reflects the diffusion of the anion rather than the diffusion of
the neutral dopant into the polymer film.[16] This is consistent with the assumption of Li et al. that the rate of equilibration between the two species (neutral and ionized dopant) is much faster than the rate of diffusion i.e. the observed kinetics reflects the dopant diffusion. [29] The plot of normalized intensity of anions vs t1/2/l helped determine the diffusion coefficients of F4TCNQ- and
F6TCNNQ- and this representation is independent of the polymer film thickness.[16] The following
phenomenological equation was used to fit the absorbance of the anion as a function of the doping time:
(1)
Where Ais the absorption at wavelength of the anion ( = 873 nm for F4TCNQ- and 1158 for
F6TCNNQ-). A0 is the absorbance of the anion at saturation, l is the film thickness and D is the
diffusion coefficient of F4TCNQ-or F6TCNNQ- in the matrix of C12-PBTTT.
The larger F6TCNNQ- anion shows a lower 2×10-12 cm2/s diffusion coefficient with respect to 9×10-12
cm2/s for F4TCNQ- (see figure 4A). Both diffusion coefficients were close to the diffusion coefficients
of iodine into the P3HT films reported by Maliakal (2.5×10⁻¹¹ cm2/s). [30] This result highlights the influence of the size of the dopant anion on its diffusion into the highly interdigitated side chain layers. Smaller anions such as F4TCNQ- can diffuse and intercalate faster into the layers of alkyl side
chains than the longer and bulkier F6TCNNQ-. However, the final amount of dopants at saturation in
13
Figure 4. A) Plot of normalized absorptions of both F 6TCNNQ (λ=1158 nm) and F4TCNQ (λ=1158 nm)
vs t1/2/l to determine the diffusion coefficients (1 mg/ml dopant solution in acetonitrile).
2.4. Angular distribution of dopant anions and polarons.
Angle-dependent polarized UV-Vis-NIR spectroscopy was used to further probe the degree of order and the distribution of the dopant anions in the oriented C12-PBTTT matrix following the approach by
Untilova et al. for F4TCNQ-doped aligned P3HT.26 The UV-Vis-NIR spectra were recorded for a
variable polarization angle of the incident light with respect to the direction of rubbing in the 0 - 90 range (see figure ESI4C and ESI4D). On one side, comparing the angular distributions of the polaron band P1 and the original neutral polymer band of the pristine film highlights the impact of doping on in-plane alignment of the polymer chains. 15,24 On the other side, the comparison between the
angular distributions of the anions and the polarons gives an indication on the correlations between dopant and polymer chain orientations. Such an analysis makes it possible to see if the dopant molecules are intercalated in the layer alkyl side chains in a random or highly ordered manner.
The plots of the absorbance of the neutral polymer, polarons and the dopant anions as a function of incident polarization angle are shown in Figure 5. The overlap of the anionic bands (873 nm for F4TCNQ and 1158 nm for F6TCNNQ) with the broad polaronic contribution made it difficult to
14
evaluate the true absorbance of the anions from the spectra directly. Hence, it was necessary to deconvolute the as-obtained spectra in order to extract the actual absorbance of the anions by subtracting the contribution from the polaron P2 (see figure ESI4). The angular dependences of the F4TCNQ- and F6TCNNQ- absorption bands after the subtraction of the P2 contribution are
represented in figure 5A and B, respectively, whereas the angular dependences of the band amplitude versus angle are depicted in Figure 5C and D.
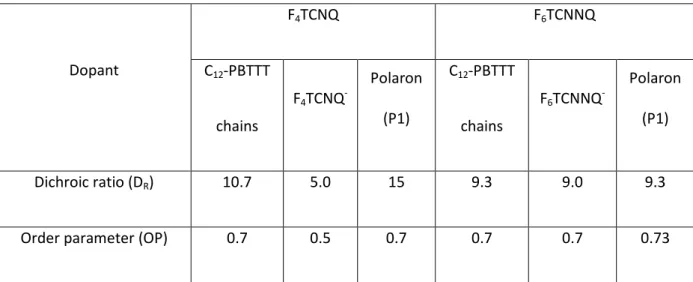
Table 1. Characteristics of angular distribution curves for the neutral polymer chains, the polaron and the anions in F4TCNQ- and F6TCNNQ-doped PBTTT C12 thin films.
Dopant F4TCNQ F6TCNNQ C12-PBTTT chains F4TCNQ -Polaron (P1) C12-PBTTT chains F6TCNNQ -Polaron (P1) Dichroic ratio (DR) 10.7 5.0 15 9.3 9.0 9.3
15
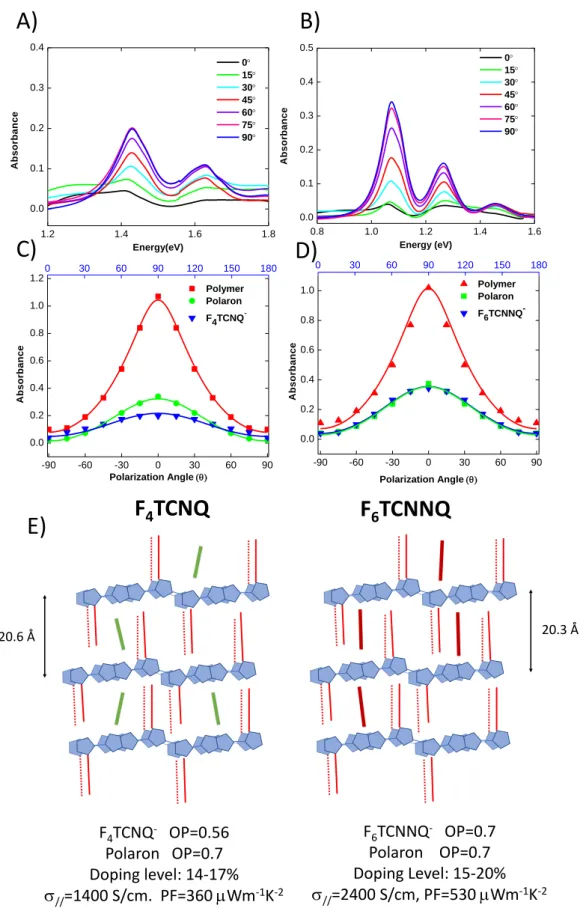
Figure 5. Absorbance of the dopant anions after subtracting the background absorbance of the
polaronic contribution P2 for A) F4TCNQ- and B) for F6TCNNQ-. C) Angular distribution of absorption
0.8 1.0 1.2 1.4 1.6 0.0 0.1 0.2 0.3 0.4 0.5 0 15 30 45 60 75 90 A b s o rb a n c e Energy (eV) 1.2 1.4 1.6 1.8 0.0 0.1 0.2 0.3 0.4 A b s o rb a n c e Energy(eV) 0 15 30 45 60 75 90 -90 -60 -30 0 30 60 90 0.0 0.2 0.4 0.6 0.8 1.0 1.2 Polarization Angle Polymer Polaron F4TCNQ -A b s o rb a n c e 0 30 60 90 120 150 180 -90 -60 -30 0 30 60 90 0.0 0.2 0.4 0.6 0.8 1.0 A b s o rb a n c e Polarization Angle Polymer Polaron F6TCNNQ -0 30 60 90 120 150 180
A)
B)
C)
D)
F4TCNQ- OP=0.56 Polaron OP=0.7 Doping level: 14-17% //=1400 S/cm. PF=360 mWm-1K-2 F6TCNNQ- OP=0.7 Polaron OP=0.7 Doping Level: 15-20% //=2400 S/cm, PF=530 mWm-1K-2 20.6 Å 20.3 ÅF
4TCNQ
F
6TCNNQ
E)
16
bands of pristine C12-PBTTT before doping, the F4TCNQ- anion (= 873nm) and the P1 band (= 2500
nm). D) Angular distribution of the absorption bands of oriented pristine C12-PBTTT before doping,
the F6TCNNQ- anion (= 1158 nm) and the polaronic P1 band (= 2500 nm). E) Schematic illustration
of the dopant intercalation of F4TCNQ and F6TCNNQ in the layers of alkyl side chains of C12-PBTTT and
corresponding TE properties for films doped by ICD.
The dichroic ratio (DR) and 3D order parameters (OP) were used to quantify the degree of orientation of the neutral polymer, the polarons and the anions in the oriented C12-PBTTT matrix.
Table 1 collects the values of DR and OP for the films doped with F4TCNQ and F6TCNNQ.
The very small value of the absorption offset (A0 = 0.07) before doping indicates that most of
the chains are aligned and there is almost no contribution from a non-oriented fraction of C12-PBTTT.
The absorption offsets for both polarons and anions are also very small ( 0.05), which further confirms that the high degree of alignment of C12-PBTTT is maintained after doping. In the case of
F4TCNQ doping, the calculated order parameters (OP) is 0.7 for the undoped C12-PBTTT and 0.7 for
the polarons. The similar values indicate that doping does not alter the alignment of the chains. The same observation was also obtained for the angular distribution measurements of F4TCNQ-doped
P3HT films.[15,26] In addition to this, the maximum of the angular distributions of both F4TCNQ- and
F6TCNNQ- anions are clearly centered at 90. This implies that the long axis of the dopants is indeed
oriented around a plane orthogonal to the average polymer chain direction and not tilted.
Surprisingly, the order parameter calculated for the F4TCNQ- anions (0.56) is substantially lower as
compared to that of the polarons (0.7). Similar trends were obtained in oriented P3HT films for the angular distribution of F4TCNQ.[26] This suggests that the F4TCNQ dopants are not strictly located in a
17
The case of F6TCNNQ doping is different. In that case, the polymer chains, polarons and the
dopant F6TCNNQ- anions have a similar OP 0.7. This result supports the idea that, unlike F4TCNQ-
anions, the long axis of F6TCNNQ- lies essentially in a plane that is perpendicular to the oriented C12
-PBTTT chains with little angular spread around this average orientation. In other words, the orientation of the F6TCNNQ dopants is defined in a better way with respect to the polythiophene
chains as compared to F4TCNQ.
Why are F6TCNNQ molecules better ordered in the layers of alkyl side chains than F4TCNQ? To
answer this question, we have used low-dose electron diffraction to probe the structure of the films as a function of doping concentration. As shown in our previous studies, doping results in the intercalation of dopant molecules in the layers of alkyl side chains as witnessed by the lattice expansion along the alkyl side chains and the contraction of the -stacking periodicity.[8,10,15,31] Similarly, to the previous studies, we followed the structural changes in both F4TCNQ and F6TCNNQ
doped C12-PBTTT thin films and Figure 6 exemplifies the changes in the ED patterns upon doping (ICD
protocol). The changes in d100 lattice periodicity are shown in figure H and G for F4TCNQ and
F6TCNNQ, respectively.
Undoped C12-PBTTT films prepared by high temperature rubbing show a sequence of h 0 0 (h= 1 - 4)
reflections along the equatorial direction and no π-stacking (d020) reflection. In addition, a strong 0 0
3 reflection is present along the rubbing direction, indicating that PBTTT crystals are mainly in face-on orientatiface-on (see figure 6 and ESI5). Doping with either F4TCNQ or F6TCNNQ does not modify to
great extent the diffraction patterns and no change of contact plane or loss of in-plane orientation is observed upon doping. However, both d100 and d020 periodicities change with increasing doping
concentration. Figure 6.G and 6.H depict the unit cell parameter variation as a function of dopant concentration for both ICD and DD methods for both F4TCNQ and F6TCNNQ-doped films.
18
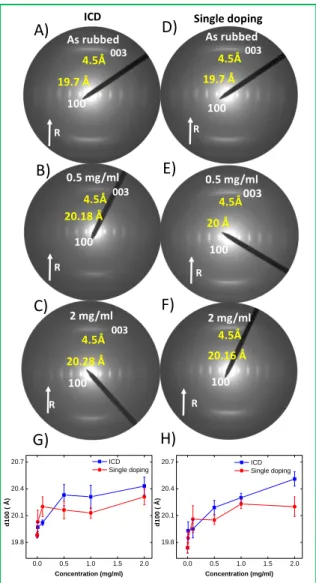
Figure 6. Evolution of the electron diffraction patterns of F6TCNNQ doped C12-PBTTT (A-C) sequential
addition (D-F) direct doping as a function of dopant concentration represent the rubbing direction Evolution of d100 spacing of the sequentially and directly doped C12-PBTTT. G) Variation of d100 spacing
of sequentially and directly doped F6TCNNQ/C12-PBTTT. H) Variation of d100 spacing of sequentially
and directly doped F4TCNQ/C12-PBTTT. ICD at a concentration C means that the sample has been
doped at all concentration steps below.
For both dopants, an expansion along the side chain direction of the C12-PBTTT unit cell is observed.
For F4TCNQ, a larger interlayer spacing variation from 19.7 Å up to 20.57 Å is evidenced than for
R 100 003 4.5Å 19.7 Å 100 003 4.5Å 20.18 Å 100 4.5Å 20.28 Å 003 R R As rubbed 0.5 mg/ml 2 mg/ml
ICD Single doping
R 100 003 4.5Å 19.7 Å R 100 003 4.5Å 20 Å R 100 4.5Å 20.16 Å As rubbed 0.5 mg/ml 2 mg/ml A) B) C) D) E) F) G) H) 0.0 0.5 1.0 1.5 2.0 19.8 20.1 20.4 20.7 d 1 0 0 ( Å ) Concentration (mg/ml) ICD Single doping 0.0 0.5 1.0 1.5 2.0 19.8 20.1 20.4 20.7 d 1 0 0 ( Å ) Concentration (mg/ml) ICD Single doping
19
F6TCNNQ, (from 19.7 Å to 20.28 Å). Surprisingly, the longer and bulkier F6TCNNQ produces a smaller
increase of d100 spacing up as compared to F4TCNQ. Incidentally, the lattice expansion for both
F4TCNQ and F6TCNNQ is significantly smaller with respect to FeCl3 (d100 increases up to 23.7 Å). The
lattice expansion in C12-PBTTT is therefore not correlated to the dimensions of the dopants (F4TCNQ
has a long axis of 12 Å versus 14.4 Å for F6TCNNQ). UV-Vis-NIR spectroscopy has shown that the
doping level at saturation are 14% and 20% (dopant per thiophene cycle) for F4TCNQ and F6TCNNQ,
respectively. Hence, the lower lattice expansion for F6TCNNQ is not associated with a lower doping
level.
Accordingly, TEM shows that doping C12-PBTTT with F6TCNNQ produces a smaller structural
modification with respect to F4TCNQ despite a larger dopant dimension and a higher doping level at
saturation. Both these observations are counter-intuitive. Moreover, polarized UV-vis-NIR spectroscopy has shown that F6TCNNQ dopants are better ordered in the side chain layers of C12
-PBTTT than F4TCNQ. One element of response for these results is given by the study of the doping
kinetics. Indeed, it has been shown that the diffusion coefficient of F4TCNQ- anions is larger than that
of F6TNNQ by a factor of 4-5. In other words, F4TCNQ- anions intercalates more rapidly in the lattice
of C12-PBTTT than F6TCNNQ. This faster diffusion is possibly responsible for the more disordered
distribution of F4TCNQ dopants in the side chain layers of C12-PBTTT. This fast F4TCNQ intercalation
may imply that the dopant molecules cannot find the optimal positions in the side chain layers. Accordingly, the C12-PBTTT lattice expands more upon doping with F4TCNQ than with F6TCNNQ. Due
to a slower diffusion in C12-PBTTT, F6TCNNQ- molecules can find the best position in the side chain
lattice, causing a smaller lattice expansion despite their larger molecular dimension (long axis of 1.47 nm for F6TCNNQ versus 1.1 nm for F4TCNQ). Preservation of pristine order in C12-PBTTT films upon
doping with F6TCNNQ is also supported by the fact that the polaronic bands are more red-shifted for
F6TCNNQ than for F4TCNQ. Overall, these results indicate that the control of doping kinetics is
possibly a means to produce doped PSC films with enhanced structural perfection. This was an incentive to study the impact of the doping method on the TE properties of aligned C12-PBTTT films.
20
In particular, it is shown that a progressive intercalation of dopants can produce films with superior TE performances.
2.5. Influence of the method of sequential doping on the charge conductivity.
Two different procedures were used to dope the oriented films i.e. incremental concentration doping (ICD) and direct doping (DD) (see Figure 1). In ICD, each sample is doped by dipping it successively in the solutions of dopants of increasing concentration up to a given concentration while in the direct doping procedure, each sample is dipped a single time in a solution of a given concentration. Typically for ICD, we consider the doping in successive solutions of 0.01, 0.1, 0.5, 1, 2 and 5 mg/ml. ICD at a concentration C means that the sample has been doped at all concentration steps below. For instance ICD at 1.0 mg/ml means that the sample has been doped successively at
0.01, 0.1 and 0.5 mg/mL ).
Figure 7 shows the evolution of the charge conductivity, Seebeck coefficient and power factors for oriented C12-PBTTT films as a function of doping concentration for F4TCNQ and F6TCNNQ.
21
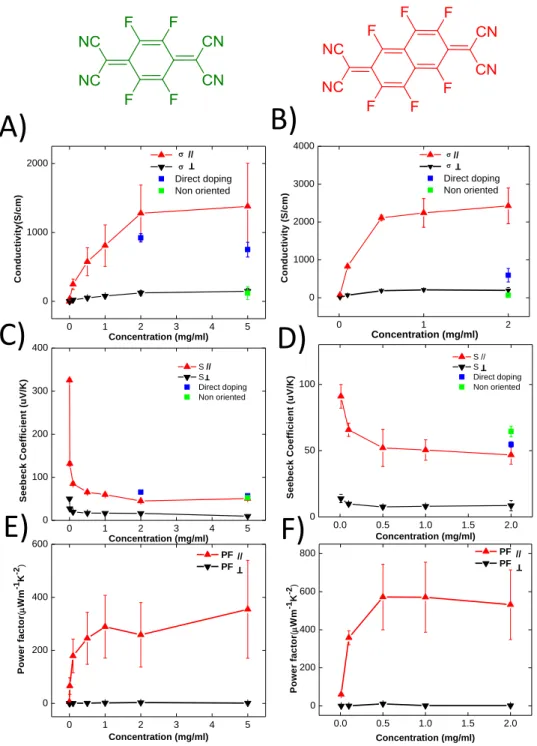
Figure 7. Evolution of the charge conductivity (A and B) and of the Seebeck coefficient (C and D) in
oriented films ofC12-PBTTT as a function of increasing doping concentration of F4TCNQ and F6TCNNQ,
respectively. The curves correspond to one sample doped by incremental increase of doping concentration (ICD). Each value of conductivity and Seebeck coefficient for a given concentration corresponds to the value after doping the sample successively at all lower doping concentrations. Both S and are measured parallel (red) and perpendicular (black) to the rubbing directions. For comparison, we also show the values of samples obtained for direct doping at high doping
0.0 0.5 1.0 1.5 2.0 0 50 100 T S e e b e c k C o e ff ic ie n t (u V /K ) Concentration (mg/ml) S // S Direct doping Non oriented 0 1 2 3 4 5 0 100 200 300 400 T S e e b e c k C o e ff ic ie n t (u V /K ) Concentration (mg/ml) S // S Direct doping Non oriented 0 1 2 3 4 5 0 1000 2000 C o n d u c ti v it y (S /c m ) Concentration (mg/ml) Direct doping Non oriented T // 0 1 2 0 1000 2000 3000 4000 C o n d u c ti v it y ( S /c m ) Concentration (mg/ml) Direct doping Non oriented //T 0 1 2 3 4 5 0 200 400 600 P o w e r fa c to r ( m Wm -1K -2) Concentration (mg/ml) PF PF // T 0.0 0.5 1.0 1.5 2.0 0 200 400 600 800 P o w e r fa c to r ( m Wm -1K -2) Concentration (mg/ml) PF PF//T
A)
B)
C)
D)
E)
F)
22
concentration (2 and 5 mg/ml for F4TCNQ and 5 mg/ml for F6TCNNQ) in parallel direction. The
conductivity of non-oriented samples was also measured at maximum doping concentration using the ICD method. E) and F) Evolution of the power factor as a function of increasing doping concentration of F4TCNQ and F6TCNNQ doped films of C12-PBTTT, respectively. Films were oriented by
high temperature rubbing at 125°C and doped by incremental concentration doping.
As observed previously, the doping of all oriented thin films produces higher electrical conductivity along the rubbing direction than perpendicular to it (see Figure 7). [14–16,26] The conductivity in the direction perpendicular to the rubbing at saturation is close to that of non-oriented thin films (65±4 S/cm for F6TCNNQ and 120±94 S/cm for F4TCNQ).
Incremental doping on the same device results in higher electrical conductivities as compared to direct doping. ICD with F4TCNQ leads to a very high electrical conductivity of //=
1380±700 S/cm along the rubbing direction versus //=920±60 S/cm for the same film doped by DD.
Hence, ICD produced 1.5 times higher electrical conductivity than direct doping in the case of F4TCNQ. The trend is even more pronounced for F6TCNNQ: //=2430±500 S/cm for ICD (2mg/ml) versus //=600±200 S/cm for DD. The electrical conductivities measured perpendicular to the
rubbing direction are similar to those observed for the non-oriented films of C12-PBTTT). This further
confirms that the lower electrical conductivity in non-oriented samples is limited by the poor transport perpendicular to the polymer chains.
The larger charge conductivity observed in samples doped by ICD can be either a consequence of a higher doping level leading to a higher charge carrier density or to a higher charge mobility. Therefore, an oriented C12-PBTTT thin film was dipped 4 times in pure ACN before direct doping (2
mg/ml of F6TCNNQ in acetonitrile) (4ACN+DD) and its UV-vis-NIR spectra was compared with that of
the film doped by ICD (the reason for the dipping of the films in pure ACN was to rule out a possible influence of the solvent on the film structure). As seen in figure ESI5, the polarized UV-Vis-NIR of both ICD and 4ACN+DD films show the same intensities of polaronic bands P1 and P2 and almost
23
similar contributions from the neutral polymer. This implies that doping levels are quite similar for ICD and 4ACN+DD samples and cannot explain the large difference in conductivity observed for ICD and DD. Moreover, as seen from Table 2, the 4ACN+DD sample shows a lower conductivity as compared to the ICD sample, indicating that dipping in ACN does not explain the observed conductivity enhancement seen for ICD. Hence, ICD and DD produce similar charge carrier densities and the observed higher electrical conductivities for ICD might be related to a difference in the charge carrier mobility.
TEM was accordingly used to evaluate the impact of doping method on the film structure that determines charge mobility. Figure ESI6 compares the evolution of the ED patterns of C12-PBTTT
films doped by ICD and DD for different doping concentrations of F4TCNQ. Overall, no clear
differences in the intensities or the width of the reflections are evidenced. Order along the chain direction, side chains and -stacking are preserved for both doping protocols. To highlight differences, it is necessary to look more carefully at the variation of d100 and d020 lattice spacing
versus doping concentration (figure 6.G and 6.H). For both dopants, ICD leads to a larger interlayer spacing variation as compared to DD (F4TCNQ: 20.57 Å for ICD versus 20.27 Å for DD; F6TCNNQ:
20.28 Å for ICD versus 20.16 Å for DD). For both dopants, the lattice expansion becomes larger for ICD than DD for doping concentrations beyond 0.5 mg/ml. These observations demonstrate that ICD and DD produce C12-PBTTT films with rather similar structures and very subtle differences in lattice
expansion along the alkyl side chains and contraction in the -stacking direction. These observed differences in structure may account, at least in part, for the difference in charge transport between ICD and DD. As an alternative, it might be that the differences in charge conductivity between DD and ICD are related to differences in the doping of the amorphous phase that is not probed by electron diffraction.
24
2.6. Influence of doping method on Seebeck coefficients and power factors.
Seebeck coefficients were also anisotropic and higher Seebeck coefficients were measured along the rubbing direction for both F4TCNQ and F6TCNNQ doped C12-PBTTT. The values of the Seebeck
coefficients were little affected by the doping method. For instance, ICD with F4TCNQ (5 mg/ml)
leads to S//= 51±4 µV/K while for DD S//= 57±3 µV/K (see figure 7.C and D). This difference is
consistent with the higher conductivity seen for ICD versus DD. Similarly, ICD with F6TCNNQ (2
mg/ml) leads to S//=47±3 µV/K versus 64.5±3 µV/K for DD at the same concentration. It is worth to
mention that the Seebeck coefficients of non-oriented samples were similar to the values measured along the chain direction (53±3 µV/K for F4TCNQ and 65±4 µV/K for F6TCNNQ), indicating that
alignment is not detrimental for the Seebeck coefficient while it is highly beneficial to enhance charge conductivity.
As expected, the increase of electrical conductivity in oriented C12-PBTTT thin films enhances the
power factors along the chain direction. Incremental concentration doping (ICD) of C12-PBTTT films
with F4TCNQ and F6TCNNQ produced high power factors of 355±200 µWm -1
K-2 and 530±200 µWm-1 K-2, respectively. For comparison, a very high PF of 1900 µW.m-1. K-2 was obtained for FeCl3-doped
C12-PBTTT. [15] As expected, ICD provided higher power factors than DD for both F4TCNQ and
F6TCNNQ. The poor electrical conductivities of the non-oriented C12-PBTTT thin film lead to a PF that
is lower by more than one order of magnitude compared to the aligned films: only 33 µW.m-1.K-2 for F4TCNQ and 27±3 µW.m
-1.
K-2 for F6TCNNQ. The dependence of PF with doping concentration (figure
6) shows the same characteristic increase and saturation for concentrations in the range 2-5 mg/ml for both dopants.
25
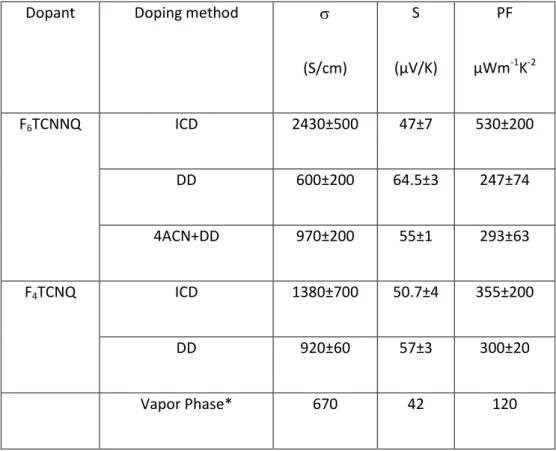
Table 2. Summary of maximum electrical conductivities, Seebeck coefficient and power factors
observed upon incremental and single doping methods.DD: direct doping. ICD: Incremental Concentration Doping.
Dopant Doping method
(S/cm) S (µV/K) PF µWm-1K-2 F6TCNNQ ICD 2430±500 47±7 530±200 DD 600±200 64.5±3 247±74 4ACN+DD 970±200 55±1 293±63 F4TCNQ ICD 1380±700 50.7±4 355±200 DD 920±60 57±3 300±20 Vapor Phase* 670 42 120
2.7. Correlations between Seebeck coefficient and charge conductivity in oriented thin films.
The ICD method is particularly useful to probe S- correlations because a single sample of well-defined initial structure and orientation is progressively doped at higher dopant concentration, which alleviates all issues related to sample-to-sample statistics due to structural variations. In the previous publications,15,16 we have demonstrated that the S- correlation is well described as proposed by Chabinyc[4] and co-workers by the relation S////-1/4 for F4TCNQ and FeCl3 dopants in
the direction parallel to the polymer chains. In oriented samples, we have observed a different correlation in the direction perpendicular to the backbone, namely S-ln(). The open question
26
This is why we collected all S, data for films doped by ICD with the dopants F4TCNQ, F6TCNNQ and
FeCl3 (data recovered from our previously reported study) [15] on the same plot (see Figure 8). The
correlations were plotted for both parallel and perpendicular orientations with respect to the chain direction.
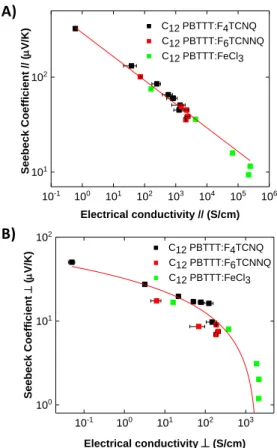
It is remarkable to see that all the data points align on the same master curves over 5 decades of charge conductivity, regardless of the dopant and for both directions parallel and perpendicular to the C12-PBTTT chains. This demonstrates that the S- correlation in C12-PBTTT is not
dependent on the chemical nature of the dopant but mainly on the packing and electronic structure of the oxidized polymer. Accordingly, this correlation is characteristic of the charge transport of the
polymer C12-PBTTT as long as its structure is marginally modified upon dopant intercalation during
ICD. The only notable difference related to the dopants is the limit in conductivity that is reached for each dopant. This limit correlates with the maximum doping/oxidation levels reached for each dopant that follows the sequence F4TCNQ<F6TCNNQ<FeCl3.
27
Figure 8. Correlation between Seebeck coefficient S and electrical conductivity in highly oriented thin films of C12-PBTTT (TR=125°C) doped with F4TCNQ (black squares), F6TCNNQ (red squares) and
FeCl3 (green squares). The full lines correspond to the results of the fit using the scaling laws S//// -1/4
and S-ln ().
In a recent work by Scheunemann et al, the impact of structural anisotropy on the thermoelectric properties of organic semiconductors was analyzed by kinetic Monte Carlo simulations. [32] The difference in the S versus correlations along and perpendicular to the rubbing is explained by introducing an anisotropic localization length of the carriers (larger in the direction of chain orientation). The anisotropy in S and is found to correlate with the anisotropy in localization length. The simulations show that, in the direction perpendicular to the chains, the thermopower follows a universal curve versus that is independent of the dopant and polymer side chain. In strong contrast, along the chain direction, a different trend is observed and a dependence with the length of the alkyl side chains has been evidenced. [32] While most studies have reported the S
-10-1 100 101 102 103 104 105 106 101 102 See be ck Coe ffi cien t / / ( m V/K ) Electrical conductivity // (S/cm) 10-1 100 101 102 103 100 101 102 See be ck Coe ffi cien t ( m V/K ) Electrical conductivity (S/cm) 100 101 102 103 104 105 101 102 C12 PBTTT:F4TCNQ C12 PBTTT:F6TCNNQ C12 PBTTT:FeCl3 See be ck Coe ffi cien t / / ( m V/K ) Electrical conductivity // (S/cm) 100 101 102 103 104 105 101 102 C12 PBTTT:F4TCNQ C12 PBTTT:F6TCNNQ C12 PBTTT:FeCl3 See be ck Coe ffi cien t / / ( m V/K ) Electrical conductivity // (S/cm) A) B)
28
1/4 power law, a recent work by Tanaka et al. reported a departure from this law for non-oriented
PBTTT doped by the electrolyte-gating technique when high charge conductivities beyond 102 S/cm are reached. [33] This result can be understood by the fact that the S vs relation in non-oriented PBTTT is dominated by the transport phenomena perpendicular to the side chains of the polymer. This is why the observations by Tanaka et al. are similar to the ones reported in this study for S and
. Only for highly aligned PBTTT films is it possible to evidence the intrinsic S vs correlation along the chain direction.
3. Conclusion.
A combination of Polarized UV-Vis-NIR spectroscopy and electron diffraction is used to uncover various characteristics of the doping of C12-PBTTT with F4TCNQ and F6TCNNQ. F6TCNNQ- anion are
better ordered in the layers of alkyl side chains and lie in a plane strictly perpendicular to the C12
-PBTTT backbone whereas F4TCNQ- anions are more distributed around this direction. The better
ordering of F6TCNNQ in the layers of alkyl side chains of C12-PBTTT is attributed to the slower
diffusion of this molecule as compared to F4TCNNQ. Similarly to rr-P3HT, doping C12-PBTTT with
F6TCNNQ and F4TCNQ produces an expansion of the unit cell along the d100 and a compression along
the π stacking direction. However, the extent of lattice expansion along the alkyl side chains is not correlated to the length of the dopant’s long axis.
In addition, a new doping protocol called incremental concentration doping (ICD) is proposed. Doping a C12-PBTTT film with solutions of increasing dopant concentration leads to higher electrical
conductivities and higher power factors than direct doping. The enhanced TE properties achieved by ICD are attributed to the preservation of pristine order and higher resulting carrier mobilities. The degree of ordering of the dopant anion in the alkyl side chain layers is an important factor that determines the resulting TE performances of the doped polymer. From that perspective, it would be instructive to determine the ordering of dopants in the polymer matrix when doped from the vapor phase since such doping leads usually to higher TE performances. The determination of the
angular-29
dependence of the anion and polaronic bands via polarized UV-vis-NIR spectroscopy on oriented polymer films is an elegant methodology to address this issue. Preliminary results further demonstrate that ICD is a versatile method that can be applied to other polymers such as P3HT and other dopants (FeCl3) to reach better thermoelectric performances. Using the ICD method at higher
temperatures might be a further means to enhance the thermoelectric performances of such aligned thin films.
4. Experimental section.
a) Orientation and doping of thin films: C12-PBTTT was synthesized following the procedure
described in the literature and in our previous work (Mw = 26 kDa, PDI = 1.73). [24]
F6TCNNQ was synthesized following the general method given in the SI. F4TCNQ was
purchased from TCI. Anhydrous solvents such as acetonitrile and ortho-dichlorobenzene were obtained from Sigma-Aldrich and used without purification.
The C12-PBTTT films were prepared by doctor-blading a solution of P3HT in
ortho-dichlorobenzene (10 mg mL-1) at 160°C on glass slide substrates pre-covered with a sacrificial hydrosoluble NaPSS (10 mg mL-1 aq) layer. The orientation of the films by high temperature-rubbing followed the protocol described in previous publications.[24,26] Oriented polymer films were prepared by using a homemade set up consisting of a translating hot plate on which the sample is fixed and a rotating cylinder covered with a microfiber cloth. The films were rubbed at different rubbing temperatures. To determine the film thickness after rubbing, the films were melt-annealed to randomize the in-plane chain direction and the thickness was extracted from the UV-vis absorbance.
The doping was performed following the sequential doping method with full sample immersion for 10 s in the dopant solution at a constant concentration of 1 mg mL-1 in anhydrous
30
acetonitrile.[9] No rinsing step was conducted. Doping as well as rubbing were performed under nitrogen atmosphere.
b) Structural analysis by TEM. Oriented areas were identified for TEM analysis by optical microscopy (Leica DMR-X microscope). For TEM investigations, the oriented C12-PBTTT thin films
prepared on NaPSS by high temperature rubbing were carbon-coated and the films were recovered on copper TEM grids by floating on water. The TEM grids were doped by ICD using dopant solutions (F4TCNQ or F6TCNNQ) in acetonitrile in the glove box. The dopant solution was allowed to stay on
the TEM grid for 20-30 s and the excess solution was removed by blotting. The structural variation in the doped thin films was followed by electron diffraction using a transmission electron microscope. In the direct doping method, carbon-coated TEM grids were doped directly at a given concentration of dopants. In the case of ICD, the grids were doped by dipping in solutions of increasing concentration up to the desired concentration.
TEM was performed in bright field and diffraction modes using a CM12 Philips microscope equipped with a MVIII (Soft Imaging System) charge coupled device camera. Calibration of the reticular distances in the ED patterns was made with an oriented polytetrafluoroethylene (PTFE) film. Beam exposure was set to a minimum using the low dose system to avoid dedoping under the electron beam that is observed when the same zone is exposed for a prolonged period of time.
c) Polarized UV–Vis–NIR absorption. A Varian Cary 5000 spectrometer with polarized incident light and spectral resolution of 1 nm was used to measure the polarized UV–vis–NIR absorption (350– 2500 nm) of the doped films. For all polarized UV-vis-NIR measurements, the C12-PBTTT/NaPSS/glass
films are used without floating. Alignment of pristine and doped polymer films was quantified by the dichroic ration DR and the 3D order parameter OP following the equations :
(2)
31
Where Abs// is the absorption parallel to the rubbing and Abs is the absorption perpendicular to the
rubbing direction. DR is the dichroic ratio.
The angular distributions of the absorption for the polarons, F4TCNQ- and F6TCNNQ- anions in
oriented C12-PBTTT are fitted following the same procedure as described in reference 28. In
particular, we used the following equations: [26]
(4)
Where,
(5)
Here A0 is the un-polarized offset absorption related to the non-aligned fraction of C12-PBTTT and
ΔA= Amax – Amin, Amax (0°, //) and Amin (90°, ⏊) for P1 and Amax (90°, ⏊) and Amin (0°, //) for both
F4TCNQ- and F6TCNNQ-.
The apparent doping level is calculated as proposed in references 15 and 26 using the ratio
, where and are the molar concentrations of thiophenes and
dopant anions, respectively. is calculated from the unit cell parameters of the doped
PBTTT phase and from the fact that the unit cell hosts 8 thiophene rings. Thus where
V
- is the volume of the doped unit cell. The dopant anion concentration was calculated from the Beer-Lambert-Bouguer law:
where
A
- is the absorbance of the anion, - the extinction coefficient of the anion,l
- the film thickness and, -the molar concentration of the anion. The extinction coefficients for F4TCNQ32
d) Charge conductivity and Seebeck coefficient. The detailed device preparation method is described in ref 14. All devices were fabricated on glass substrates, cleaned by ultrasonication in acetone, ethanol, Hellmanex and deionized water (x3 times). The cleaned substrates were dried under nitrogen and exposed to plasma prior to film deposition. Gold electrical contacts (40 nm thick) in a four-points probe geometry (1 mm spacing between electrodes, 5 mm length) were evaporated through a shadow mask (rate of 4–6 Å/s) after deposition of a first layer of chromium (2.5 nm thick) (evaporation rate 0.5–1 Å/s).
The geometry of deposited gold electrodes allows determining the charge transport and thermopower on a same substrate in both parallel and perpendicular directions to rubbing (see Figure S3 reference 14). Oriented films of P3HT were floated on distilled water and carefully recovered on the device with pre-deposited gold electrodes. After float-off, the samples are left for drying 1hr in ambient and then transferred in the glovebox via the transfer chamber under primary vacuum (pumping for several minutes). Doping using DD or ICD methods were performed on the polymer/device samples in a glovebox (Jacomex). Four-point probe measurements of electrical conductivity were performed using a Keithley 4200-SCS and a Lab Assistant Semiprobe station under N2 atmosphere. To derive the resistivity ρ from the sheet resistance R measured on the device, the
geometrical correction factor C was first determined such that ρ = R.C.t where t is the film thickness. The geometrical correction factor C was determined for four-line electrode geometry by measuring the sheet resistance on the same sample using a classical four-point apparatus and the four-line electrode device , yielding C = 1.81. The average conductivity value for a given rubbing temperature was taken as the average of two to four devices.
Thermopower measurements were conducted in nitrogen atmosphere on the same devices. The thermopower was measured using a differential temperature method whereby a temperature gradient is established across the sample along or perpendicular to the rubbing direction. The details of the experimental setup are given in reference 14.
33 Acknowledgements
Bernard Lotz is acknowledged for careful reading of the manuscript. We thank Christian Blanck and Marc Schmutz for technical support in TEM. We thank Nicolas Zimmermann for the preparation of the pre-patterned devices (gold deposition). MB is grateful for the financial supports from the ANR Anisotherm (ANR-17-CE05-0012) and CNRS grant PEPS Thermobody. Viktoriia Untilova is grateful for financial support from IRTG Softmatter / Région Grand’Est.
Conflicts of interests.
The authors declare no conflict of interest.
Supporting Information
The Supporting Information is available free of charge.
References
[1] O. Bubnova, Z. U. Khan, A. Malti, S. Braun, M. Fahlman, M. Berggren, X. Crispin, Nature Materials 2011, 10, 429.
[2] O. Bubnova and X. Crispin, Energy Environ. Sci. 2012, 5, 9345.
[3] K.-H. Yim, G. L. Whiting, C. E. Murphy, J. J. M. Halls, J. H. Burroughes, R. H. Friend, J.-S.
34
[4] A. M. Glaudell, J. E. Cochran, S. N. Patel and M. L. Chabinyc, Advanced Energy Materials 2015, 5, 1401072.
. iefer . u E. ransson . G me , D. Primetzhofer, A. Amassian, M. Campoy-
uiles . ller, Adv. Sci. 2017, 4, 1600203.
[6] D. T. Duong, C. Wang, E. Antono, M. F. Toney and A. Salleo, Organic Electronics, 2013, 14, 1330– 1336.
[7] C. Y. Kao, B. Lee, L. S. Wielunski, M. Heeney, I. McCulloch, E. Garfunkel, L. C. Feldman, V. Podzorov, Advanced Functional Materials 2009, 19, 1906.
[8] S. N. Patel, A. M. Glaudell . . Peterson E. . Thomas . . O’Hara E. im and . . habinyc
Sci Adv, 2017, 3, e1700434.
[9] D. T. Scholes, S. A. Hawks, P. Y. Yee, H. Wu, J. R. Lindemuth, S. H. Tolbert, B. J. Schwartz, J. Phys.
Chem. Lett. 2015, 6, 4786.
[10] D. T. Scholes, P. Y. Yee, J. R. Lindemuth, H. Kang, J. Onorato, R. Ghosh, C. K. Luscombe, F. C. Spano, S. H. Tolbert and B. J. Schwartz, Advanced Functional Materials 2017, 27, 1702654.
[11] J. E. Cochran, M. J. N. Junk, A. M. Glaudell, P. L. Miller, J. S. Cowart, M. F. Toney, C. J. Hawker, B. F. Chmelka, M. L. Chabinyc, Macromolecules 2014, 47, 6836.
[12] . Hynynen . iefer . u R. roon R. unir . massian . emerin . ller,
Macromolecules 2017, 50, 8140.
[13] I. E. Jacobs, E. W. Aasen, J. L. Oliveira, T. N. Fonseca, J. D. Roehling, J. Li, G. Zhang, M. P. Augustine, M. Mascal and A. J. Moule, J. Mater. Chem. C 2016, 4, 3454–3466.
[14] . Hamidi‐Sa r . Binie .-L. Bantignies, D. Maurin, L. Herrmann, N. Leclerc, P. Lévêque, V. Vijayakumar, N. Zimmermann and M. Brinkmann, Advanced Functional Materials 2017, 27, 1700173.
[15] V. Vijayakumar, Y. Zhong, V. Untilova, M. Bahri, L. Herrmann, L. Biniek, N. Leclerc and M. Brinkmann, Advanced Energy Materials, 2019, 9, 1900266.
35
[16] V. Vijayakumar, E. Zaborova, L. Biniek, H. Zeng, L. Herrmann, A. Carvalho, O. Boyron, N. Leclerc and M. Brinkmann, ACS Appl. Mater. Interfaces 2019, 11, 4942.
[17] K. Tashiro, M. Kobayashi, T. Kawai and K. Yoshino, Polymer 1997, 38, 2867.
[18] J. Yamamoto and Y.Furukawa, J. Phys. Chem. B 2015, 119, 4788.
[19] Z. Liang, Y. Zhang, M. Souri, X. Luo, A. M. Boehm, R. Li, Y. Zhang, T. Wang, D.-Y. Kim, J. Mei, S.-R. Marder and K.-R. Graham, J. Mater. Chem. A 2018, 6, 16495.
[20] B. Yurash, D. X. Cao, V. V. Brus, D. Leifert, M. Wang, A. Dixon, M. Seifrid, A. E. Mansour, D. Lungwitz, T. Liu, P. J. Santiago, K. R. Graham, N. Koch, G. C. Bazan and T.-Q. Nguyen, Nature
Materials 2019, 18, 1327.
[21] P. K. Koech, A. B. Padmaperuma, L. Wang, J. S. Swensen, E. Polikarpov, J. T. Darsell, J. E. Rainbolt, D. J. Gaspar, Chem. Mater. 2010, 22, 3926.
. arpo T. Erdmann . Stamm . appan O. Gus o a . alanin I. Ragu in T. Beryo ina . Ba ule . G nther, S. Gemming, G. Seifert, M. Hambsch, S. Mannsfeld, B. Voit, A. Kiriy,
Macromolecules 2017, 50, 914.
[23] P. Pingel and D. Neher, Phys. Rev. B 2013, 87, 115209.
[24] L. Biniek, N. Leclerc, T. Heiser, R. Bechara and M. Brinkmann, Macromolecules 2013, 46, 4014-4023.
[25] L. Biniek, S. Pouget, D. Djurado, E. Gonthier, K. Tremel, N. Kayunkid, E. Zaborova, N. Crespo-Monteiro, O. Boyron, N. Leclerc, S. Ludwigs and M. Brinkmann, Macromolecules 2014, 47, 3871. [26] V. Untilova, T. Biskup, L. Biniek, V. Vijayakumar and M. Brinkmann, Macromolecules, 2020, 53, 2441.
[27] R. Ghosh, C. M. Pochas and F. C. Spano, J. Phys. Chem. C 2016, 120, 11394.
[28] R. Ghosh, A. R. Chew, J. Onorato, V. Pakhnyuk, C. K. Luscombe, A. Salleo and F. C. Spano, J. Phys.
Chem. C 2018, 122, 18048.
[29] J. Li, C. Koshnick, S. O. Diallo, S. Ackling, D. M. Huang, I. E. Jacobs, T. F. Harrelson, K. Hong, G. Zhang, J. Beckett, M. Mascal and A. J. Moulé, Macromolecules, 2017, 50, 5476–5489.
[30] A. J. Maliakal, ACS Appl. Mater. Interfaces 2013, 5, 8300.
36 2019, 32, 175.
[32] D. Scheunemann, V. Vijayakumar, H. Zheng, P. Durand, N. Leclerc, M. Brinkmann and M. Kemmerink, Advanced Electronic Materials 2020, 6, 20000218.
[33] H. Tanaka, K. Kanahashi, N. Takekoshi, H. Mada, H. Ito, Y. Shimoi, H. Ohta and T. Takenobu, Sci.