Cold Start Fuel Management of Port-Fuel-Injected
Internal Combustion Engines by
James M. Cuseo
B.S., Mechanical Engineering The George Washington University, 2002
SUBMITTED TO THE DEPARTMENT OF MECHANICAL ENGINEERING IN PARTIAL FULFILLMENT OF THE REQUIREMENTS FOR THE DEGREE OF
MASTER OF SCIENCE IN MECHANICAL ENGINEERING AT THE
MASSACHUSETTS INSTITUTE OF TECHNOLOGY
JUNE 2005
©2005 Massachusetts Institute of Technology
All Rights Reserved MASSACHU8ETTS INS E
OF TECHNOLOGY
JUN 16 2005
LIBRARIES
Signature of Author:
1V
)epartment of Mechanical Engineering May 6, 2005 Certified by: Wai K. Cheng of Mechanical Engineering Thesis Supervisor Accepted by: Lallit Annand
(This page intentionally left blank)
.
-Cold Start Fuel Management of Port-Fuel-Injected Internal Combustion Engines
by James M. Cuseo
Submitted to the Department of Mechanical Engineering on May 6th, 2005 in partial fulfillment of
the requirements for the Degree of Master of Science in Mechanical Engineering
ABSTRACT
The purpose of this study is to investigate how changes in fueling strategy in the second cycle of engine operation influence the delivered charge fuel mass and engine out hydrocarbon (EOHC) emissions in that and subsequent cycles. Close attention will be paid to cycle-to-cycle interaction of the fueling strategy. It is our intent to see if residual fuel from each cycle has a predicable influence on subsequent cycle's charge mass and EOHC emissions.
The fast flame ionization detector is employed to measure both in-cylinder and engine out hydrocarbon concentrations for various cold start strategies. The manufacturer's original fueling strategy is used as a starting point and is compared to a "in-cylinder fuel
air ratio (0) 1" case (a fueling strategy that results in an in-cylinder concentration of approximately stoichiometric for each of the first five cycles) and to a number of cases that are chosen to illustrate cycle-to-cycle mixture preparation dependence on second cycle fueling.
Significant cycle-to-cycle dependence is observed with the change in second cycle. A fueling deficit in cycle two has a more pronounce effect on future cycles delivered charge mass than a fueling surplus while a fueling surplus in cycle two has a more pronounce effect on future cycles charge mass than a fueling deficit.
Thesis Supervisor: Wai K. Cheng
Dedication
Thesis topics come and go, but the musical stylings of Journey are forever...
Acknowledgements
This work was made possible by the MIT Engines and Fuels Consortium. Without the help of Ford, GM, DaimlerChrysler, Delphi and Saudi-Aramco I'd have much larger
student loans to pay off.
Special thanks to Devon Manz and Craigory Craigbert Wildberry Wildman XXIV. Best. Officemates. Ever.
To my family: Mom, Dad and Christina, thanks for all of the support and encouragement through the years. Mama, thank you for starting me out on the right track. Papa, growing up would not have been the same without you. So much of what makes me who I am I
owe to you. Grandma Cuseo, I owe so much of my intellect to you, thank you for your help making it this far. Grandpa Cuseo, I'm sure you would be proud of where I have ended up. I owe my love of cars and mechanics to the time I spent with you, Dad and Uncle Albert at the garage.
Table of Contents
A B ST R A CTA ... 3 A C K N O W LED G EM EN TS ... 7 TA BLE O F C O N TEN T S...9 TA B LE O F FIG U R ES...11 N O M EN C LA TU R E ... 12 1: IN TR O D U C TIO N ... 13 1.1 BACKGROUND... 13 1.2 PREVIOUS W ORK ... 14 1.3 O BJECTIVE ... 16 1.4 M ETHODOLOGY ... 16 2: EX PER IM EN TA L A PPA RA TU S... 19 2.1 TEST ENGINE ... 192.2 CUSTOM ENGINE CONTROLLER ... 20
2.3 IN-CYLINDER PRESSURE M EASUREM ENT ... 21
2.4 H YDROCARBON M EASUREM ENTS ... 21
2.5 D ATA A CQUISITION SYSTEM ... 22
2.6 ENGINE O PERATING CONDITIONS ... 23
3: FAST FLAME IONIZATION DETECTOR...25
3.1 PRINCIPLE OF O PERATION ... 25
3.2 FFID CALIBRATION ... 25
3.3 FFID SAM PLING SYSTEM ... 26
3.4 INTERPRETATION OF FFID SIGNAL ... 27
3.4.1 In-cylinder ... 27
3.4.2 Exhaust...29
3.5 VALIDATION OF IN-CYLINDER AFR CALCULATION ... 29
3.5.1 Q uantifying the Uncertainty ... 29
3.5.2 Sources of Uncertainty ... 30
4: EFFECT OF FUEL METERING STRATEGY ON COLD-START MIXTURE PR EPA R A TIO N ... 33
4.1 ECU FUELING STRATEGY ... 33
4.2 BASELINE FUELING CASE ... 35
4.3 EFFECT OF CHANGES IN CYCLE 2 FUEL METERING STRATEGY ... 38
5: H Y D R O C A R BO N EM ISSIO N S... 43
5.1 EFFECT OF CHANGES IN CYCLE Two FUEL METERING STRATEGY ON EOHC ... 43
5.2 H YDROCARBON A CCOUNTING ... 44
6: SUM MARY AND CONCLUSIONS ... 49
6.1 IN-CYLINDER HC MEASUREMENT BY FAST FLAME IONIZATION DETECTOR...49
6.2 COLD-START M IXTURE PREPARATION ... 49
6.3 H YDROCARBON EM ISSIONS ... 50
APPENDIX A: FUEL/SPARK CONTROLLER CODE ... 51
A .1 O VERVIEW ... 51
B.1 OVERVIEW ... ... 61
B.2 SINGLE-ZONE BURN RATE ANALYSIS ... 62
B.3 SINGLE CYLINDER RICARDO W AVE M ODEL ... 63
Table of Figures
FIGURE 1.1: EOHC AND VOHC DURING TYPICAL COLD-START [2]... 14
FIGURE 1.2: FUEL ACCOUNTING. INJ. = INJECTED FUEL; REM. = REMAINING FUEL; C.O. = CARRIED-OVER FUEL. A DAPTED FROM [1]...15
FIGURE 2.1: 2.4L DCX DOHC TEST ENGINE. ... 20
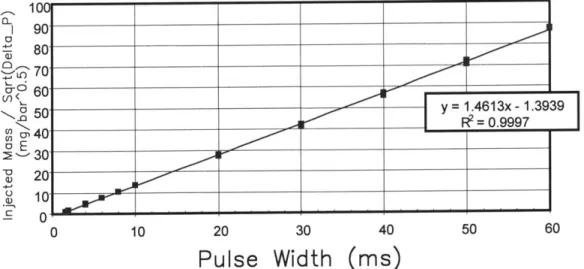
FIGURE 2.2: INJECTOR CALIBRATION. ... 20
FIGURE 2.3: IN-CYLINDER SENSOR CONFIGURATION ... 22
FIGURE 3.1: SCHEM ATIC OF FFID ... 25
FIGURE 3.2: TYPICAL FFID CALIBRATION CURVE ... 26
FIGURE 3.3: TYPICAL FFID SIGNAL...28
FIGURE 3.4: VALIDATION OF FFID DATA. COMPARISON OF FFID CALCULATED PHI TO PHI AS MEASURED BY A UEGO. PHI = 1.0. SPEED = 1400 RPM. M AP =.4 BAR. ... 30
FIGURE 3.5: SENSITIVITY OF PHI CALCULATION TO RESIDUAL GAS FRACTION ESTIMATE...31
FIGURE 3.6: IMPACT OF RESIDUAL GAS FRACTION UNCERTAINTY ON PHI CALCULATION...31
FIGURE 4.1: EVALUATION OF AVERAGE ECU FUELING STRATEGY. SMALL AND LARGE POINTS REPRESENT INDIVIDUAL TEST RUNS AND AVERAGE VALUES, RESPECTIVY. ECT=25 DEG C. TAMB= 20 DEC C. RELHUMID = 10% . NO ADDITIONAL LOAD. ... 34
FIGURE 4.2: IN-CYLINDER MIXTURE EQUIVALENCE RATIO FOR BASELINE FUELING. SMALL AND LARGE POINTS REPRESENT INDIVIDUAL TEST RUNS AND AVERAGE VALUES, RESPECTIVY. ECT=25 DEG C. TAMB= 22 DEC C. RELHUMID = 36.5 %. ADDITIONAL ACCESSORY LOADING APPLIED. ... 36
FIGURE 4.3: IN-CYLINDER FUEL MASS FOR AVERAGE BASELINE FUELING. ECT=25 DEG C. TAMB= 22 DEC C. R ELH U MID = 36.5 % . ... 37
FIGURE 4.4: DELIVERY EFFICIENCY FOR AVERAGE BASELINE FUELING CASE. ECT=25 DEG C. TAMB = 22 DEC C . R ELH UM ID = 36.5 % ... 38
FIGURE 4.5: EFFECT OF CHANGES OF CYCLE 2 FUELING ON IN-CYLINDER MIXTURE EQUIVALENCE RATIO. ALL DATA SHOWN ARE BASED ON AN AVERAGE OF FIVE TESTS. ECT=25 DEG C. TAMB= 22 DEC C. RELHUMID = 36.5 %. ADDITIONAL ACCESSORY LOADING APPLIED...39
FIGURE 4.6: EFFECT OF CHANGES OF CYCLE 2 FUELING ON IN-CYLINDER CHARGE FUEL MASS. DATA SHOWN IS BASED ON AVERAGE PHI AND A CHARGE MASS BASED THE INDIVIDUAL TEST CLOSES TO THE DATASET AVERAGE. ECT=25 DEG C. TAMB = 22 DEC C. RELHUMID = 36.5 %...40
FIGURE 4.7: SENSITIVITY OF MIXTURE PREPARATION TO CHANGES IN CYCLE 2 FUELING. -100% AND +100% CYCLE 2 FUELING REPRESENTS NO FUEL INJECTED AND DOUBLE FUEL INJECTED, RESPECTIVELY. ECT=25 DEG C. TAMB = 22 DEC C. RELHUMID = 36.5 %. ... 40
FIGURE 4.8: SENSITIVITY OF MIXTURE PREPARATION TO CHANGES IN CYCLE 2 FUELING. THE DEPENDANT AXIS SHOWS THE INCREASE OR DECREASE OF IN-CYLINDER FUEL MASS RELATIVE TO THE BASELINE CASE. ECT=25 DEG C. TAMB = 22 DEC C. RELHUMID = 36.5 %... 41
FIGURE 5.1: EFFECT OF CHANGES OF CYCLE 2 FUELING ON EOHC. DATA BASED ON SINGLE CASE CLOSEST TO DATASET AVERAGE. ECT=25 DEG C. TAMB = 22 DEC C. RELHUMID = 36.5 %. ... 43
FIGURE 5.2: SENSITIVITY EOHC TO CHANGES IN CYCLE 2 FUELING. -100% AND +100% CYCLE 2 FUELING REPRESENTS NO FUEL INJECTED AND DOUBLE FUEL INJECTED, RESPECTIVELY. ECT=25 DEG C. TAMB= 22 DEC C . RELH UM ID = 36.5 % ... 44
FIGURE 5.3: HC ACCOUNTING FOR A TYPICAL BASELINE CASE. ECT=25 DEG C. TAMB = 22 DEC C. R ELH U M ID = 36.5 % . ... 45
FIGURE 5.4: HC ACCOUNTING FOR VARIATIONS OF CYCLE 2 FUELING. THE Y-AXIS IS THE TOTAL MASS OF HC OVER THE 10 RECORDED CYCLES. BASED ON SINGLE CASE CLOSEST TO DATASET AVERAGE. ECT=25 DEG C. TAMB = 22 DEC C. RELHUMID = 36.5 % ... 46
FIGURE 5.5: RUN-OUT FUEL ACCOUNTING FOR 60 CYCLES OF ENGINE OPERATION. CYCLES 25-60 EXTRAPOLATED FROM DATA. BASED ON A SINGLE BASELINE CASE. IN THE CALCULATION OF UNACCOUNTED FOR FUEL THE MASS OF CHARGE TERM IS ONLY COUNTED UNTIL THE MISFIRE CYCLE.
Nomenclature
AFR Air fuel ratio
BDC Bottom dead center
CP Constant pressure
ECT Engine coolant temperature
ECU Engine control unit
EHCC Exhaust hydrocarbon concentration
EOHC Engine out hydrocarbon
EVC Exhaust valve close
EVO Exhaust valve open
FFID Fast flame ionization detector
HC hydrocarbon
HCC Hydrocarbon concentration
IHCC In-cylinder hydrocarbon concentration
IVC Intake valve close
IVO Intake valve open
ma Mass fraction air
ma Mass air
MAP Manifold absolute pressure
fff Mass fraction fuel
mf Mass fuel
rn r Mass fraction residual
N Engine speed (rev/sec)
OF Overlap factor
PFI Port fuel injected
TDC Top dead center
THEATA Spark timing
UEGO Universal Exhaust gas oxygen sensor
VOHC Vehicle out hydrocarbon
Wa Molar mass air
Wf Molar mass fuel
Xa Mole fraction air
Xci Mole fraction C1
Xf Mole fraction fuel
1:
Introduction
1.1 Background
Ever stricter emissions regulations have been pushing the limits of current exhaust gas after treatment technology. In order to meet future federal emissions standards the combustion process must be improved with the goal of reducing engine out hydrocarbon pollutants.
With the invention of the fast light off catalyst, which becomes effective within seconds of engine operation, increased importance is being placed on understanding and improving the cold-start regime. This is due to the fact that the fast light off catalyst does not become operational until it reaches its active temperature, approximately 250 degrees Celsius. Until this time, approximately 10 seconds into engine operation, all engine out hydrocarbon emissions (EOHC) pass through the catalyst unprocessed, directly into the environment. The cold-start process, the first few seconds of engine operation, currently account for more than 60% of total trip emissions effluence. [1]. Therefore, improving the engine start-up process will significantly contribute to meeting future regulations.
Port-fuel injected (PFI) engine cold-start, which is to be defined as any engine start that occurs while the engine coolant temperature (ECT) is well below fully warmed temperature (80-100 degrees Celsius), is a challenging regime for engine calibrators to deal with. During this period engine conditions such as low engine port and cylinder wall surface temperatures, high manifold absolute pressures and low port air velocity do not promote efficient fuel vaporization and mixing. Because of these factors, it is necessary to inject much more fuel than what is required for combustion because only a small portion of this injected mass will vaporize and contribute to the combustible mixture. A portion of the liquid fuel that is not consumed by combustion may find its way through the engine and be emitted from the vehicle, unprocessed by the inactive catalyst. Figure
4 X10⁴ 2 ppmC1 2 0 4 x10⁴ ppmC1 2 0
F
HC - Catalyst entrance HC - Catalyst exit 2 RPM RPM/I 000;MAP (bar) I MAP *-v
0
0 1 2 3 4 5
Figure 1.1: EOHC and VOHC during typical cold-start [2].
Current emissions regulations (for Federal Tier I and II vehicles) are lenient enough so that strict control of the cold-start process is not necessary. Over-fueling the first cycles of engine operation is a common strategy employed in order to ensure consistent, robust start up in a variety of environmental conditions with a variety of fuel types. This strategy, though acceptable at the present time, will be unacceptable when
stricter regulations are adopted (e.g. for vehicles with California SULEV designation).
1.2 Previous Work
Over the past ten years additional emphasis has been placed on understanding the cold-start process. In this time a number of studies have been done investigating the various aspects of the start-up process.
In one study performed by Takeda, et al, mixture preparation during cold-start of a 4-valve PFI engine was analyzed. In this study an accounting of injected fuel was performed where the mass of fuel injected was separated into intake port wall-wetting
and fuel in-cylinder, which is further separated into burned and unburned fuel. Unburned fuel is further separated into cylinder wall-wetting and EOHC. Details of the experiment can be found in SAE950074, while the experimental apparatus is described in
SAE955044. The outcome of this work is an accounting of the ultimate destination of injected fuel detailed in Figure 1.2.
Inj.
Rem.
C.O.
150
0
1
2
3
CYCLE
Burned LWet Port (remaining fuel)
[] Engine Out H.C. Wet Port (remaining fuel)
Injected E Carry Over (C.O.)
Figure 1.2: Fuel accounting. Inj.= injected fuel; Rem.= remaining fuel; C.O. = carried-over fuel. Adapted from [1].
The relevant conclusions of this study are as follows. A portion of fuel injected in each cycle does not contribute to the combustible mixture nor does it contribute to the mass of EOHC emissions of the current cycle. This fuel mass wets the port or cylinder wall and is carried over into the next cycle of engine operation where it may contribute to that cycle's combustible mixture. Both cylinder wall wetting and EOHC emitted are shown to decrease gradually with time as the engine warms up, an indication that the EOHC emissions are due to vaporization of fuel remains on the cylinder wall during the expansion stroke. This fuel vaporizes after it is too late to bum or be sufficiently oxidized but just in time for the exhaust stroke to purge the raw HC [1].
Takeda's work illustrates a cycle-to-cycle mixture preparation interdependence. A portion of fuel injected in the early cycles of engine operation remains in the engine contributing to future cycles' charge mass and emissions effluence. Takeda's work was based on one fueling strategy and did not investing the effect of a change in this baseline
Work done in the Sloan Lab by Halim Santoso [2, 3] also investigated cold-start mixture preparation. Santoso investigated the effect of cranking speed on first cycle fuel to charge delivery as well as the effect of first cycle fueling to second cycle equivalence ratio. It was found that delivery efficiency, the fraction of injected mass that ends up in the charge, decreases as first cycle injected mass is increased. Furthermore, as first cycle mass is increased the second cycle equivalence ratio increased. Both effects were shown to have a large sensitivity to engine coolant temperature [3].
1.3 Objective
In the Takeda experiments the injected fuel amount is calibrated to the minimum amount needed for stable combustion. No investigation in to different fuel metering
strategies was performed. In the Santoso study only first cycle fueling was varied. Furthermore, no fuel was injected into the second cycle, only first cycle fueling contributed to second cycle phi values. The objective of this study is to expand the
fueling cases studied, investigating how changes in fueling strategy over the second cycle of engine operation influence the fuel delivery to charge ratio and EOHC emissions. Close attention will be paid to cycle-to-cycle interaction of the fueling strategy. It is our intent to see if residual fuel from each cycle has a predicable influence on subsequent cycle's charge mass and EOHC emissions
1.4 Methodology
Previous work has attempted to decouple the effects of the many variables of engine cold start in order to make investigating the phenomenon easier. Our work will attempt to make the cold start experiment as true to life as possible, running on a stock 4 cylinder engine, cranked by started motor, with all four cylinders firing. Preserving the majority of the aspects of true to life start behavior will undoubtedly increase the variability in the data, but provide an investigation that is more readily applicable to the actual cold start process.
Both engine start position and fuel remaining from previous engine operation have been shown to have a large effect on in-cylinder phi and EOHC [4, 5]. These variables will be eliminated by motoring the engine before each experiment to purge the cylinder of leftover fuel and by starting the engine from a repeatable starting position.
Investigation begins by evaluating the ECU start program. Data is recorded for manifold absolute pressure (MAP), in-cylinder pressure, fuel pulse width, spark timing and in-cylinder and engine our hydrocarbon concentrations. This data set can be used to calculate both in-cylinder equivalence ratio and exhaust gas hydrocarbon levels. The ECU start-up case is used to generate a baseline fueling case. The baseline fueling case is then modified by increasing or decreasing the fueling in cycle two, the same data is collected and the same values calculated. Cycle-to-cycle interdependence will be investigated by comparing the modified fueling strategy cases to the baseline case.
2:
Experimental Apparatus
2.1 Test Engine
The test engine used is a production 2003 Daimler-Chrysler 2.4L, dual overhead cam, 4-valves per cylinder, 4-cylinder engine, the same engine used in the 2003 Town and Country minivan (Table 2-1 and Figure 2.1).
Bore 87.5 mm
Stroke 101 mm
Displacement 2.43 L
Clearance Volume 71.45 cc
Compression Ratio 9.5
Con Rod Length 155.5 mm
Intake Valves Diameter 30.25 mm Lift 8.25 mm IVO 25 0 BTDC IVC 245 0 ATDC Exhaust Valves Diameter 26.55 mm Lift 6.52 mm EVO 420 0 ATDC EVC 40 0 BTDC Valve Overlap 15 *
Table 2-1: 2003 2.4L DCX engine specifications.
The engine is connected directly from the output side of the flywheel to an engine dynamometer, sans transmission or driveline components. Initially the engine was
configured to run without the stock alternator and power-steering pump. After initial tests determined that the lack of accessory loading adversely affected startup performance, causing misfires in the early cycles for the ECU start-up calibration, an alternator was
added to increase the load on the engine. The alternator was configured with a custom controller so that the loading could be varied as desired.
Figure 2.1: 2.4L DCX DOHC test engine.
2.2 Custom Engine Controller
In order to control the fueling of each cycle of engine start-up independently a custom fueling controller was developed. The stock fuel injector (see calibration, Figure 2.2) was controlled by an injector driver which, in turn, received control signals from a PC based control program (see appendix for details). The program uses crank angle and BDC compression signals from a modified shaft encoder mounted to the crankshaft of the engine to determine engine position. I/O is handled by an Adio 1600 controller card.
The program is also capable of controlling spark timing, although this feature was not used in this study. Spark timing for all four cylinders are controlled by the ECU.
I
______I
___ _ y = 4613x .3939 10 ____1" _ 6 0 10 20 30 40 50Pulse Width (ms)
Figure 2.2: Injector calibration. 100 90 80-70 O 50 40 0 4-C 0 0
2.3 In-cylinder Pressure Measurement
In-cylinder pressure is measured using a Kistler 6125A piezoelectric pressure transducer installed in cylinder 4 though the cylinder head at the back of the engine (Figure 2.3). The signal is processed using a Kistler 5610 charge amplifier before being sent to the data acquisition system. Since piezoelectric type sensors measure relative pressure and are extremely susceptible to drift, the pressure signal must be "pegged" each cycle to a known value. Traditionally pressure as measure by the MAP sensor at BDC of the intake stroke is used. Calibration was performed by Kistler at the time of purchase and was found to be 16.6 mV/bar. A BDC signal as measured by the shaft encoder was superimposed on the pressure signal, synchronizing the pressure data to the crank angle pulse.
2.4 Hydrocarbon Measurements
Hydrocarbon measurement was performed using a Cambustion HFR400 fast response flame ionization detector (FFID). One channel of the FFID was used to measure in-cylinder HC concentration while the other was simultaneously used to measure
exhaust concentration.
In order to measure the in-cylinder concentration during normal engine operation a special purpose sparkplug manufactured by Kistler was used. The spark plug has an offset electrode to one side of the plug and a threaded hole to the other. The FFID sampling probe is inserted in to the hole, placing the sampling point approximately 5.5 mm from the sparkplug electrode (Figure 2.3).
FFID sampling probe in-cylinder pressure transducer
0
in-cylinderA
4-~ pressure transducer 1*0 FFID sampling probeFigure 2.3: In-cylinder sensor configuration
Exhaust HC sampling was done via a port in the exhaust runner of cylinder 4, approximately 76 mm away from the exhaust valves. A specially designed exhaust
manifold with longer than standard runners was used to ensure the pressure and mass flux in runner 4 was not influenced by the other cylinders. An ETAS wide band oxygen sensor (UEGO) was also installed in the runner of cylinder 4 and was used to verify the FFID measurements at steady state.
2.5 Data Acquisition System
Data was collected using a National Instruments PCI-6623E data acquisition board connected to a Dell Dimension 2400 PC running LabView 7.0. All data was collected on a crank angle resolved basis as measured by the crankshaft mounted shaft
2.6 Engine Operating Conditions
In order to ensure that each start is performed on an ambient temperature engine free of residual fuel the following experimental procedure was followed.
" Motor engine to clean left-over fuel. The engine is motored at 1500 rpm, WOT until the in-cylinder and exhaust hydrocarbon concentration (IHCC, EHCC) are less than 500 ppm CI (corresponding to a fuel equivalence ratio (0D) of 0.004). " Set engine start position. The engine is set to mid-stroke compression of
cylinder 3. In this position cylinder 4 is last to fire.
* Perform engine start. Record MAP, in-cylinder pressure, IHCC, EHCC, RPM. As soon as the engine stabilizes and the RPM settles to a constant value the engine is shut off. In other cold-start experiments the engine is run up to full operating temperatures to ensure any fuel accumulations have sufficient time and temperature to evaporate. This step requires a great deal of time and is
unnecessary as any fuel puddles are purged during the motoring process. It should be noted that this step differs from standard cold-start experimental practice but is
a necessary modification given the time available for data collection.
* Set engine cool down position. This is the same as the start position. This is simply to ensure a constant cool down position from start to start and is probably an unnecessary step given the fact the engine is motored before the next start. " Cool to ambient. The engine is cooled via forced convection of the engine
coolant through a heat exchanger cooled with city water. The engine is considered fully cooled when the ECT is 25 +/-1 'C.
3:
Fast Flame Ionization Detector
3.1 Principle of Operation
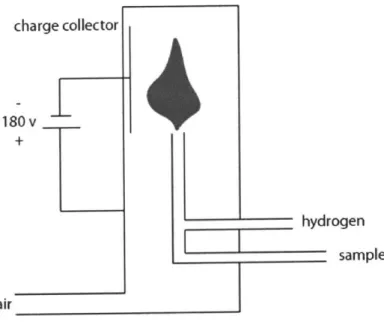
The principle of operation is simple; a sample of gas is passed through a hydrogen diffusion flame in the analysis head of the FFID. The ensuing combustion produces a number of ions, which can be measured by a charge collector in the FFID head. The number of ions produced is proportional to the number of carbon atoms present in the sample gas (approximately 2.5x10⁻⁶ ion/electron pairs per aliphatic carbon atom), therefore the fast FFID is, in essence, a carbon counting device.[6] Figure 3.1 is a schematic of the FFID analysis head.
charge collector
180 v
hydrogen
sample
air
Figure 3.1: Schematic of FFID.
3.2 FFID Calibration
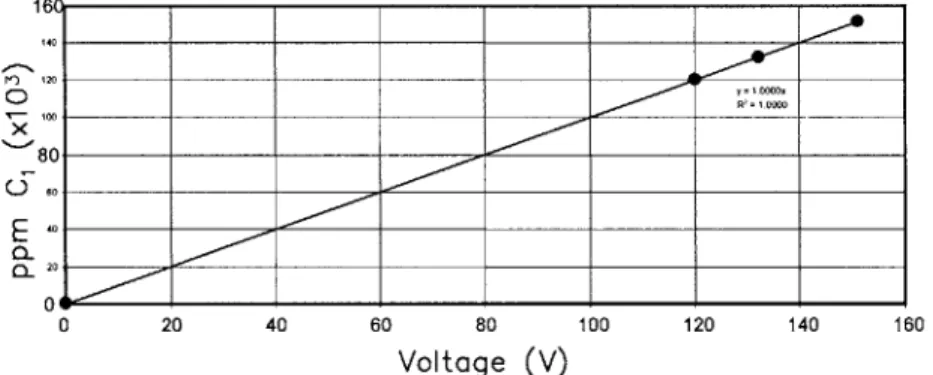
The output signal of the FFID system is a voltage proportional to the number of carbon atoms in the sample gas. In order to interpret the output signal properly the FFID must be calibrated with a gas of known hydrocarbon concentration prior to each test.
sample gas. For in-cylinder applications this is about 120,000 ppm CI for stoichiometric mixtures at engine idle (high residual gas fraction) to about 200,000 ppm CI for very rich first-cycle cold-start conditions (low residual fraction). The balance of the calibration mixture should be air.
PO) 0 X E a- CA-0 20 40 60 80 100 120 140 160 Voltage (V)
Figure 3.2: Typical FFID calibration curve.
Since hydrocarbon-air mixtures of these ratios are not available commercially, due to their high flammability, they must be mixed at the time of calibration; for this two Omega® metering valves were employed (FMA-2607A and FMA-2619A). The FFID was calibrated at a number of concentration points to ensure linearity of response. A typical calibration curve is found in Figure 3.2. Since hydrocarbons exist in a wide variety of forms (CH3, C7H18, etc.) and gasoline is composed of a blend of various
hydrocarbons it is standard practice to report hydrocarbon concentration in ppm CI. For the exhaust application the FFID was calibrated with 1500ppm propane in nitrogen. The FFID was calibrated so that lV = 1,000 ppm C3 (3,000 ppm C1).
3.3
FFID Sampling System
In order to be used effectively in the analysis of in-cylinder and exhaust
hydrocarbon concentrations in internal combustion engines the FFID must be configured to sample a constant mass flow regardless of sample pressures. The FFID accomplishes this with a constant pressure chamber (CP chamber) between the sampling inlet and the flame detector.[6] With a large enough CP chamber, held at a pressure significantly below ambient, the chamber acts as a capacitor which maintains near constant pressure
16C 140 120 Y I OOOOX R' z 1 0000 IDD 80 60 40 20
independent of sample conditions. In in-cylinder configurations, where the pressure fluctuations are quite large, a large ballast volume is needed.
The sampling chamber, otherwise known as the FID chamber, is held at a lower pressure than the CP chamber. Since the mass flow rate into the FFID chamber is directly proportional to the pressure difference between the two chambers (AP FID), the response of the FID is extremely sensitive to changes in this pressure differential.
3.4 Interpretation of FFID Signal
3.4.1 In-cylinder
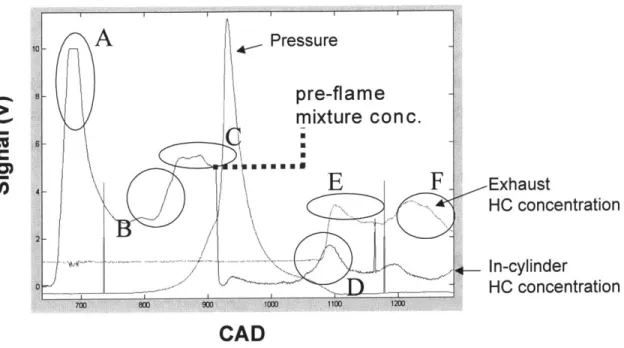
A typical cold-start in-cylinder FFID signal is found in Figure 3.3. Note, all values are in volts and can be converted to molar concentration by the aforementioned calibration. During the intake stroke the inhomogeneous fuel air mixture is inducted into the cylinder, past the FFID sampling probe. This causes a spike in the FFID signal as
seen at point A in the figure. This spike is more pronounced the first cycle than in later cycles of operation, due to the increased inhomogeneity of the first cycle, primarily because of the lack of high temperature backflow early in the intake stroke which aids in mixture preparation. During the latter half of the intake stroke, as the fuel rich mixture is pulled to the bottom of the cylinder, the FFID signal drops substantially. As the
compressions stroke begins, in B, the FFID signal rises. The signal plateaus late in the compression stroke, C, as the mixture become increasingly homogenous. As combustion occurs, the signal rapidly falls to zero as the hydrocarbon gases are consumed by the flame. The final feature of the in-cylinder FFID signal occurs during the exhaust stroke, in D. This small peak in HC concentration is caused by out-gassing from the crevices.
A
~Pressurepre-flame
mixture conc.
E
F
~"---. ..-..---- /7CAD
Figure 3.3: Typical FFID Signal.
The hydrocarbon concentration just before ignition can be considered to be the concentration of the combustible mixture and can be used to calculate the in-cylinder air fuel ratio. From the FFID signal the mole fraction of C1 Xc1,cyl in the cylinder at the time of combustion is known. From this, the mole fraction fuel xfl can be calculated by,
XClcyl
(W, /WCi)
where Wci = 12 + (H/C), using the H/C ratio for the fuel. Knowing,
+ +-' -1=:>3 =1-x -x
a + f Xr a f r
m~-=mi a +rin + +llr
where the ~ denotes molecular values, and from the definition of air/fuel ratio (AFR) we can determine a formula for calculating AFR from known quantities.
6f co ,_-Exhaust HC concentration In-cylinder HC concentration
10
0 1200 1100AFR- =jj-"-a-"-r7J
m, x,5 Wf Wf xf
.AFR= a 1 ry
W, x
In order to calculate the AFR the residual gas fraction must be known. A suitable estimation of X, is: (041OF
f1~
6 1~ 0.84(1 Ospark-401
xN 0.401 NF f1+0.546 [7] f( ) 1 e(-4.788-'153.8 4 )p
=1-4 Pint,abs Pexh,abs3.4.2 Exhaust
At exhaust valve open (EVO) an initial peak is observed, E, as the blowdown phase occurs. The head gasket, spark plug and valve seat crevice gaskets are exhausted causing a peak in the exhaust FFID signal. During the later stage of blowdown, HC concentrations decrease as burned gas is exhausted. The peak at the end of the exhaust stroke, point F, can be attributed to a variety of mechanisms, among them one particular mechanism stands out: the exhausting of raw HC which are scraped from the cylinder lining as cylinder-wall boundary layer is shed as the piston approached TDC. [8]
3.5 Validation of In-cylinder AFR Calculation
3.5.1 Quantifying the Uncertainty
In order to determine the precision and accuracy of the FFID calculated value for AFR the engine was operated at a variety of speed, load and fueling conditions, FFID
controller). Figure 3.4 compares the calculated value of AFR to the known value, which is considered to be the value maintained by the closed loop controller program.
1.150 1.100
single
case:
1.05 E +/ 15%. 1.03 1.000-
on
Ave:
0.970. +. . 0.850 87 0.850 0.900 0.950 1.000 1.050 1.100 1.150 UEGO LambdaFFID Calc'd Values
+
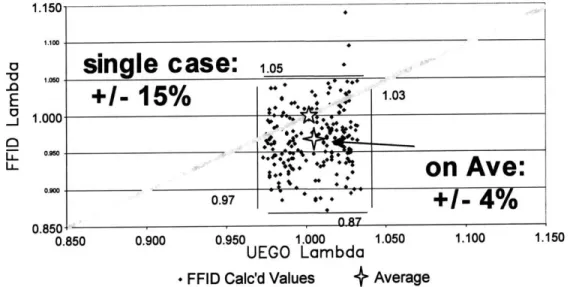
AverageFigure 3.4: Validation of FFID data. Comparison of FFID calculated phi to phi as measured by a UEGO. Phi = 1.0. Speed = 1400 rpm. MAP =.4 bar.
Upon comparing the calculated values to the accepted values it was apparent there was a reasonably large amount of uncertainly in the calculated value. Based on the
analysis of a number of different speed/load fueling cases it was determined that any single calculated value of AFR was accurate to +/- 15%. On average of many cases (50+)
the calculated value was determined to be accurate to +/- 4%.
3.5.2 Sources of Uncertainty
Aside from human or calibration error, which is assumed to be negligible, there are three possible sources of uncertainty in the FFID calculated value of AFR:
uncertainty in the residual gas fraction (x,) estimate, in-cylinder inhomogeneity and cycle-to-cycle fluctuation in (D.
2.50 .57 phi spread X -c .0-37 phi spread 1.50- A X 1.00 X=0 0.50 100 110 120 130 140 150 160 170 180 190 200 ppm C1
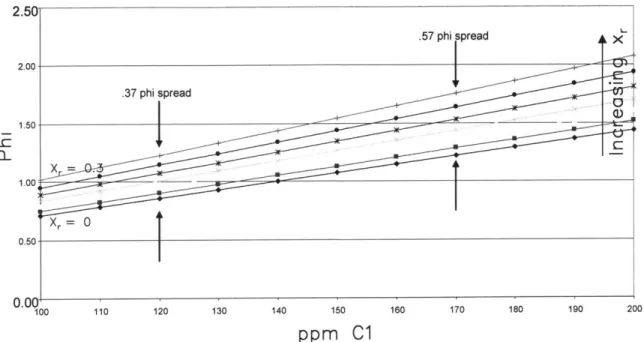
Figure 3.5: Sensitivity of Phi calculation to residual gas fraction estimate.
The sensitivity of the calculated value of AFR to uncertainty in the estimate of residual gas fraction is shown in Figure 3.5. As shown in Figure 3.6, the uncertainty in the majority of the data could account for by an uncertainty of only +/. 5% in the estimate
of xr. This level of uncertainty is not out of the question as the actual value Xr is highly
sensitive to parameters such as in-cylinder pressure and exhaust gas temperature which are not constant cycle-to-cycle when combustion variability is high. These parameters are not considered in the residual gas fraction estimate used.
1.150 ...
-0850 0900 0950 1.000 1050 1100 1150
UECO Lambda
Whereas all of the uncertainty in the calculated FFID value of AFR could be attributed to uncertainty in the residual gas fraction estimates, this is most like not the entire cause of variability. In-cylinder inhomogeneity and cycle-to-cycle fluctuation in (D are other likely sources of uncertainty. The average AFR of the entire cylinder and the average over many cycles may be stoichiometric, but at any given point in space and time the mixture may be rich or lean relative to the average. Studies have confirmed that the cylinder mixture remains inhomogeneous into the later crank-angle degrees of the compression stroke[9]. Since the FFID measures the HCC at a given point, any inhomogeneity will effect the measurement. The FFID calculated value of phi may be significantly rich or lean despite the average in-cylinder concentration being much closer to stoichiometric. This inhomogeneity is evident in the FFID signal in Figure 3.3.
Looking at section C, the voltage and thereby the HCC at the sampling probe varies considerably during the later stages of the compression stroke. Whereas the signal in Figure 3.3 levels off into a reasonably plateau prior to combustion, signifying adequate mixing and relative in-cylinder homogeneity, this is not always the case.
Whereas the evaluation of uncertainty in FFID calculated values for in-cylinder equivalence ratio were done for a fully warmed up engine at steady state the results can be applied to the cold-start experiments discussed in later sections. Any cause of
uncertainty in steady state operation will be present in cold-start operation, though the magnitudes of the effect of each mechanism of uncertainty may be amplified by even poorer mixture preparation conditions.
4:
Effect of Fuel Metering Strategy on Cold-start
Mixture Preparation
4.1 ECU Fueling Strategy
An appropriate starting point for determining the effects of the fuel metering strategy on metrics such as in-cylinder air fuel ratio and EOHC emissions is to first evaluate the stock ECU fuel metering strategy. Average start up fueling for the given start configuration was determined by averaging over ten trials the fuel pulse widths (FPWs) for each of the first five cycles. In each of these starts the engine was cranked from the aforementioned engine starting position. In the subsequent test data which were labeled as the "ECU start", the fueling was controlled by the custom fueling controller, using the averaged FPWs for each cycle obtained as described above as the fueling values. This was done to ensure the same controller configuration for the "ECU start" as in later starts of the modified fueling strategies.
Average ECU fueling for the first five cycles of engine operation and the resultant in-cylinder equivalence ratios are shown in Figure 4.1. Results of ten individual starts are plotted as points while the average of all ten starts is shown in the emboldened line. Looking first at the average, it appears that the stock start-up calibration results in a near
stoichiometric first cycle with each subsequent cycle getting richer and richer. By the fifth cycle the in-cylinder charge is so rich there is danger of misfire due to an over-rich condition.
Fuel Delivered 200 184 mg 95 1.80 78 60 1.60 -45
1.40-n+/
.1 Phi +/- .25 Phi 1.00 0.0-0 1 2 3 4 5 6CYCLE
Figure 4.1: Evaluation of average ECU fueling strategy. Small and large points represent individual test runs and average values, respectivy. ECT=25 deg C. Tamb =20 dec C. RelHumid = 10%. No
additional load.
The fact that cycles 2-5 are richer than stoichiometric is to be expected when the calibrator's motivation is considered. The calibrator is charged with the task of ensuring robust start-up regardless of fuel type, ambient temperature, humidity, and a host of other variables that may effect fuel vaporization. Therefore the calibrator would rather err on the side of caution producing mixtures that are rich, rather than lean.
Our experiments determined there was a danger of an over-rich condition using the stock ECU calibration. This would not be acceptable to the calibrator and therefore must be explained through other means. The simplest explanation is that the calibration is not correct; it is possible the ECU did not have the final production version of the
calibration. It is also possibility that differences between the laboratory set up and the stock configuration are significant enough to make the stock calibration invalid. One major difference is that the laboratory engine is under-loaded compared to the stock configuration. A stock engine at start-up has a number of accessory loads, such as the power steering pump and the alternator, as well as driveline inefficiencies that are present even in neutral, like those caused by the torque converter. Each of these additional loads would affect the rate at which the engine accelerates during start-up which would in turn
affect important parameters such as engine airflow. An engine that accelerates more quickly would result in lower MAP earlier in engine operation, therefore requiring less fuel for a stoichiometric mixture. Attempts were made to increase the load on the engine by installing an alternator with a custom load controller but without a good estimate of actual loads in the stock configuration absolute compatibility with the stock start-up calibration could not be guaranteed.
The spread in the individual data points tells an important story about the
variability of the cold-start process. For the stock scheme the variability of the first cycle is approximately +/- .1 phi. In each subsequent cycle variability increases; by the fifth cycle the data spread is approximately +/- .25 phi. Variations in engine run up could result in differences in MAP and RPM, +/- .01 bar and +/- 25 rpm respectively, in the
latter cycles. Although these changes are small and therefore would have a small effect trapped fresh air mass, compounded with changes in fuel vaporization efficiency due to differences in port air motion could result in substantial changes is in-cylinder AFR.
4.2 Baseline Fueling Case
Before variations in fueling strategy could be assessed a baseline fueling case must be developed for comparison. Since the stock engine calibration resulted in
relatively rich in-cylinder mixtures any substantial increase in fueling would most likely result in an over-rich condition, therefore the ECU calibration is not suitable as a
baseline. A more suitable baseline would result in in-cylinder phi values closer to stoichiometric, therefore any reasonable change in fueling would not result in an over-rich or over-lean situation. In addition, no fuel will be injected past cycle 5. This will allow investigation into the effects of fueling of cycles 1-5 on later cycles' charge mixture without needing to account for the effects of later cycle fueling.
The results for the baseline case are shown in Figure 4.2. As intended the average in-cylinder AFRs for the baseline case are much closer to stoichiometric. Test-to-test variability is still present and the trend of increasing variability with increasing cycle is apparent, but this time with less spread in the data.
Fuel Delivered 309 mg 1.25 9 53 11 22 10 100 0.95
No fuel injected cycles 6 onward 0.85
0.75.
0 2 4 6 8 10 12
CYCLE
Figure 4.2: In-cylinder mixture equivalence ratio for baseline fueling. Small and large points represent individual test runs and average values, respectivy. ECT=25 deg C. Tamb =22 dec C.
RelHumid = 36.5 %. Additional accessory loading applied.
In finding the baseline case it became apparent that cycle-to-cycle fueling
interaction is an observable phenomenon. This phenomenon will be discussed in depth in a later section but the following early observations can be made. Changing the fueling for cycle 1 had a pronounced effect on the in-cylinder concentrations of later cycles. The
same can be said for the remainder of the fueled cycles. Without drastic fueling changes to cycles 1-5 it was difficult to get cycles 6-10 closer to stoichiometric; this fact
suggested there were significant levels of stored fuel from the earlier fueled cycles. It is important to note that despite no fueling in cycles 6 onward, combustion occurs for many cycles, up to the 14th cycle. In fact, cycles 6 through 8 get richer. In
order to understand why this is the case one must consider the intake airflow. During the cold start period engine speed is increasing and MAP is decreasing, this results in less airflow into the cylinder in the later cycles of cold start. Less in-cylinder air for the same evaporated fuel mass would result in a richer mixture. Since equivalence ratio is function of both mass of fuel and mass of air in charge it is not the best metric to evaluate fuel vaporization during transients; a more suitable metric is in-cylinder charge fuel mass. Arriving at a numerical value for in-cylinder fuel mass is complicated by the fact that it is
transients. In our analysis trapped mass and residual gas fraction, both used in the
calculation of in-cylinder charge mass, are estimated based on a cycle simulation which is detailed in the appendix. Figure 4.3 shows in-cylinder charge fuel mass during the first ten cycles of engine operation. This description is much more intuitive than previous
analysis of the equivalence ratio. As cycle number increases, injected fuel mass decreases and stored fuel reserves are depleted less fuel mass enters the charge.
0) 50 Fuel Delivered 309 mg 4 40 98 53 230 ______22 -~ 10 L.. 20
No fuel injected cycles 6 onward
0
1 2 3 4 5 6 7 8 9 10
CYCLE
Figure 4.3: In-cylinder fuel mass for average baseline fueling. ECT=25 deg C. Tamb = 22 dec C. RelHumid = 36.5 %.
Figure 4.4 details the delivery efficiency of the first five cycles. The delivery efficiency is equal to charge fuel mass per injected fuel mass; note that the delivered fuel is comprised of contributions from both the injected fuel and the stored fuel in the manifold. The trend shows that the delivery efficiency increases with progressing engine cycle. This can be explained by the fact that in cycles 3-5 the injected fuel mass is significantly smaller than the stored fuel puddle already in the intake port. Even if only a small portion of this new puddle contributes to the charge mass it will be relatively large when compared with the injected mass for the cycle. Additionally, as engine speed picks up and temperature increases charge motion in the port and cylinder may also contribute to fuel vaporization. Delivery efficiencies of over 100% in cycle 4 and 5 are possible due
LUJ >1 200% 180% 160% 140% 120% 100% 80% 60% 40% 20% 0.0% 1 2 3 4 5
CYCLE
Figure 4.4: Delivery efficiency for average baseline fueling case. ECT=25 deg C. Tamb = 22 dec C. RelHumid = 36.5 %.
4.3
Effect
of
Changes
in
Cycle 2 Fuel Metering Strategy
In order to study the effect of changes in fuel schedule on in-cylinder mixture preparation cycle 2 fueling was varied and in-cylinder HCC was measured. The cases
investigated were +/- 50% and +/- 100% of baseline fueling (-100% fueling corresponds to no fuel injected in cycle 2). The results can be found in Figure 4.5 (in-cylinder
I
0*4 _
.6 +Nofu el in"ectod cycles 6 o nw d
1-201
-4,30 f --
.1 3 4 7 f 1
CYCLE
p Baen o 100%/ -50 % + 50% +10o%
Figure 4.5: Effect of changes of cycle 2 fueling on in-cylinder mixture equivalence ratio. All data shown are based on an average of five tests. ECT=25 deg C. Tamb= 22 dec C. RelHumid = 36.5 %.
Additional accessory loading applied.
Looking at both the in-cylinder equivalence ratio and in-cylinder fuel mass we see that changes to cycle 2 fueling has a pronounced effect on all cycles from 2 onward. In
effect, increasing or decreasing the fuel delivered to cycle two causes both curves to shift upward or downward respectively. Note that despite no fuel being injected into cycle two in the -100% case, fuel is present in cycle 2's charge, reaffirming previous work showing that cycle 2 mixture preparation is effected by cycle 1 fueling [10].
EYCLE
Figure 4.6: Effect of changes of cycle 2 fueling on in-cylinder charge fuel mass. Data shown is based on average phi and a charge mass based the individual test closes to the dataset average. ECT=25 deg
C. Tamb = 22 dec C. RelHumid = 36.5 %.
Figure 4.7 describes the mixture preparation sensitivity to changes in cycle two
fueling for a number of cycles. It is without surprise that cycle two in-cylinder fuel mass is most sensitive to cycle two fueling changes. Increasing cycles show decreasing sensitivity to cycle 2 fueling though even as far as cycle ten shows moderate sensitivity.
0)50 40 0 0 20 L. 10 0 ~ 0 0 -100% Baseline +100%
(no fuel) (double fuel)
% Cycle 2 Fueling
Cycle
m2 -3 04 6 "8 *10
Figure 4.7: Sensitivity of mixture preparation to changes in cycle 2 fueling. -100% and +100% cycle 2 fueling represents no fuel injected and double fuel injected, respectively. ECT=25 deg C. Tamb= 22
Figure 4.8 shows the sensitivity of cycle charge fuel mass relative to the baseline fueling case for cycles two, three and four. A closer look reveals that each cycle's
dependence on cycle two fueling is non-linear. In-cylinder fuel mass of the latter cycles is more sensitive to a cycle two fueling deficit that a cycle two fueling surplus. This can be explained by both the fact that larger stored fuel puddles do not vaporize as efficiently as smaller puddles due to the larger ratio of puddle volume to puddle surface area, and by the fact that larger injected masses also result in a greater proportion of the injected fuel contributing to EOHC emissions and to fuel loss to the lubricating oil rather than to the charge mass. This is discussed further in the next chapter.
60%-C 40% 20% E 0 -60% -100% Baseline +100%
(no fuel) (double fuel)
% Cycle 2 Fueling
Cycle
-2 0 34
Figure 4.8: Sensitivity of mixture preparation to changes in cycle 2 fueling. The dependant axis shows the increase or decrease of in-cylinder fuel mass relative to the baseline case. ECT=25 deg C.
5:
Hydrocarbon Emissions
5.1 Effect of Changes in Cycle Two Fuel Metering Strategy on
EOHC
Figure 5.1 shows the EOHC emissions for the baseline case as well as for changes in cycle 2 fuel metering strategy. In all cases, except the -50% case, the highest levels of EOHC are associated with cycle 2 with emissions decreasing as cycle increases.
o Misfire, off-scale _________ ____ CYCL o15.%00 - -7400. 3.0A. 0.00 1 2 3 4 5 8 7 8 9 1
CYCLE,
-i- aselIne - -100 O% 50/ +50 SO %10Figure 5.1: Effect of changes of cycle 2 fueling on EOHC. Data based on single case closest to dataset average. ECT=25 deg C. Tamb = 22 dec C. ReiHumid = 36.5 %.
Figure 5.2 details the sensitivity of cycle emissions to changes in cycle 2's fueling schedule. As expected cycle 2 EOHC is most sensitive to changes in cycle 2 fueling with sensitivity decreasing with increasing cycle. EOHC appears to be more sensitive to fueling surplus, than a fueling deficit, with the exception of cases which cause a cycle 2 misfire. It appears that total EOHC can be reduced by optimizing cycle 2 fueling such that the minimum amount of fuel for stable combustion is injected.
E U r/ 0 0J Misfire, off-scale 10 9-7 5misfire 4 3 2 U -100% -50% Baseline OUI1 +100%
(no fuel) (double fuel)
Cycle
n2 3 o4 6 a8 -10
Figure 5.2: Sensitivity EOHC to changes in cycle 2 fueling. -100% and +100% cycle 2 fueling represents no fuel injected and double fuel injected, respectively. ECT=25 deg C. Tamb = 22 dec C.
RelHumid = 36.5 %.
The following explanations are offered. Cycle 2 shows the highest levels of EOHC emissions due to both a large puddle of fuel remaining from cycle one's injection event and a large injected mass. Suspended liquid fuel from the injection as well as fuel
entering from the port pool wet the cylinder walls [11]. This fuel is not burned during the combustion event, it remains on the cylinder walls until it is either vaporized by the heat of combustion too late to burn or is scraped from the cylinder lining as cylinder-wall boundary layer is shed as the piston approached TDC. [8] Either way, the HCs enter the exhaust stream unburned. A smaller amount of injected fuel in cycle 2 decreases one of the cylinder wall wetting mechanisms, thereby lowering EOHC emissions. In later cycles both a smaller fuel puddle and smaller injected masses reduce both wetting mechanisms
again resulting in lower EOHC levels.
5.2 Hydrocarbon Accounting
Now that EOHC emissions have been calculated a hydrocarbon accounting can be performed to determine the end fate of the injected fuel. Figure 5.3 illustrates the fuel accounting for the first 10 cycles of a typical cold-start with baseline fueling. As prior
combustible mix or leave the engine in its raw form[1]. By the tenth cycle of engine operation nearly half of the total injected mass over the first five cycles is unaccounted for. The location of this unaccounted for fuel is unknown; some may be present as a fuel puddle in the port, some may have been lost to the sump. Finally some of this
unaccounted for fuel may be due to uncertainty in the EOHC calculation.
--
S
-- F- -F]I F~l 500.0 450.0 400.0 350.0 E 3000 u 250.0 U) 200.0 150.0 100.0 50.0 -0.0 aM - O charge - MEOHC O Unnaccounted HC Mass 9 10 TotalC. Tamb = 22 dec C. RelHumid =
HC accounting for variations in the baseline fueling schedule are shown in Figure
5.4. Increasing or decreasing fueling results in a proportional change in total charge mass, total unaccounted for fuel and total EOHC with the exception of the -100% case which due to a misfire results in higher total EOHC emissions.
1 2 3 4 5 6 7 8
CYCLE
HC accounting for a typical baseline case. ECT=25 deg 36.5 %.
Figure 5.3:
-- -
600 E 400 W 300 _ Mcharge CO, MEOHC 200 - 0 Unnaccounted HC Mass 100 -100% -50% Baseline 50% +100%
(no fuel) (double fuel)
Figure 5.4: HC accounting for variations of cycle 2 fueling. The y-axis is the total mass of HC over the 10 recorded cycles. Based on single case closest to dataset average. ECT=25 deg C. Tamb = 22
dec C. RelHumid = 36.5 %.
In order to narrow down the final destination of the unaccounted for fuel, a run-out HC accounting was performed. The conditions for the test are the same as in the baseline except data is taken for 25 cycles (data was extrapolated through cycle 60, the point at which the data suggests all fuel as been purged from the port and cylinder). The
following results are the result of one experiment and are offered only as an early analysis of the whereabouts of the unaccounted for HC mass. Figure 5.5 illustrates the
3500 00 Unaccounted HC CP 4 n Mi(n~misflre cycIe) n E' inj ~~ chg ~=M EOHC 40 0 35 250 0 ,Charge HC 0)30 20
EOHC EOHC = Charge HC once misfire
w 25 limit has been reached
20 1 - 150 15 ~100 : 0 10-0 5 * * ~Data extrapolated 0 ~C- 04Dr 1 2-l- O-a a 91 D Q - 9-r- 0 0 10 20 30 40 50 60
CYCLE
Figure 5.5: Run-out fuel accounting for 60 cycles of engine operation. Cycles 25-60 extrapolated from data. Based on a single baseline case. In the calculation of unaccounted for fuel the mass of charge
term is only counted until the misfire cycle. For non-firing cycles MEOHC = Mcharge. ECT=25 deg C.
Tamb= 22 dec C. RelHumid = 36.5 %.
In this experiment the engine began to misfire due to an over-lean condition from cycle 14 onward. Since this caused off scale EHCC measurements EHCC was assumed to be equal to IHCC. This is a reasonable assumption, since the charge mass does not
combust it is most likely exhausted. The engine, which at this point was motoring the test cylinder by virtue of cylinders 1-3 firing, slowly purged fuel from the engine until about cycle 60 in which the EOHC levels were approximately zero. At this point there is still
~ 10mg of unaccounted for fuel. This fuel was probably lost to the sump over the course of the early cycles.
6:
Summary and Conclusions
6.1 In-cylinder HC Measurement by Fast Flame Ionization
Detector
"
The HFR400 FFID is sensitive to:o Changes in the sampling chamber pressure, AP FFID.
o Changes in sample flow rate caused by clogging of the sample lines. Care must be taken to ensure the sample lines and the FFID tubes are clean. o Changes in calibration on a time scale comparable to a test-run.
Calibration must be performed before and after testing to ensure calibration has not changed significantly during test.
* Determination of air fuel ratio using the FFID is made difficult by the following: o Considerable in-cylinder mixture inhomogeneity, especially for cold start experiments. The HCC at the sample probe may not be representative of the average HCC in the cylinder, especially at low temperatures and engine speeds.
o In order to calculate AFR from in-cylinder HCC, residual gas fraction must be known or estimated. While estimates, such as the Waero
correlation, are available they are susceptible to uncertainty due to cycle-to-cycle combustion variation. Furthermore, these estimates are not valid during transients, such as cold-start.
6.2 Cold-start Mixture Preparation
"
Cycle-to-cycle fueling interaction has been observed. Changes in cycle twofueling has an effect on the fuel mass to charge of at least the first ten cycles of engine operation.
o This interaction is caused by the storage of injected fuel on the port walls. A portion of the fuel mass injected in cycle two remains in the intake port, contributing to the fuel charge mass of future cycles.
o Cycle charge fuel mass shows higher sensitivity to fueling deficit than fueling excess.
o Due to large cycle-to-cycle and test-to-test variation, resulting in a large standard deviation of the dataset, clear trends are only observable in large variations in fueling schedule (~50% increments). A much larger data set is required to determine sensitivity to smaller fueling variations.
" Using AFR to as a metric to study mixture preparation couples the effects of changes in intake airflow and changes in fuel vaporization.
* In calculating charge fuel mass from in-cylinder HCC data an accurate
measurement or a reasonable estimate of trapped cylinder mass and residual gas fraction is needed.
o Estimates need to take into account the transient nature of cold start: changing engine speed, MAP and temperatures.
o Future work should rely on an accurate method of measuring airflow into the cylinder, such as a hotwire anemometer in the intake port.
6.3 Hydrocarbon Emissions
" Changes in cycle two fueling has an effect on EOHC emissions of at least the first ten cycles of engine operation.
o Increased injected fuel mass in cycle two results in increased EOHC emissions in later cycles.
o Decreased injected mass results in lower EOHC emissions (until misfire occurs).
o Cycle EOHC emissions shows a greater sensitivity to cycle two fueling surplus than a cycle two fueling deficit.
* EOHC calculations also need an accurate measurement or estimate of trapped cylinder mass.
Appendix A: Fuel/Spark Controller Code
A.1
Overview
The custom controller consists of the stock fuel injectors controlled by an injector driver receiving control signals from the below PC based control program. The program uses crank angle and BDC compression signals from a modified shaft encoder mounted to the crankshaft of the engine to determine engine position. Data I/O is handled by an Adio 1600 controller card.
In the version of the code modified for these experiments the fueling for the first ten cycles is explicitly input by the user. Fuel pulse width for the first ten cycles is input
into the variable ilnjHalfDurVal. The value input here is actually half the actual fuel pulse with duration in microseconds (this is not true of other copies of single.c, the code which lamjmc.c is based on, currently in use in the lab. The remaining cycles are fueled to a given equivalence ratio via UEGO closed-loop control.
A.2
Source Code
/*LAM-JMC.c
//MODIFIED VERSION OF SINGLEC CODE
//ALLOWS FOR PW CONTROL OF FUEL, SPARK TIMING CONTROL //CREATED BY WAI. K. CHENG
//MODIFIED BY JIM CUSEO
Control of a single cylinder engine operation: 16 bit dos version Description:
Principle of operation:
It uses the Kontron adiol600 board.
The ca pulses are connected to the clk input of counterO, which is the
crank angle counter. The clk is reset by the BDC compression pulse which
is wired to the gate input (which acts as a trigger input) to counterO.
The engine is controlled by calling the subroutine cycle for each cycle. The
call is looped so that values for the events in each cycle can be changed
![Figure 1.1: EOHC and VOHC during typical cold-start [2].](https://thumb-eu.123doks.com/thumbv2/123doknet/14362325.502833/14.918.193.795.145.485/figure-eohc-vohc-typical-cold-start.webp)