Publisher’s version / Version de l'éditeur:
Cold Regions Science and Technology, 6, 1, pp. 21-27, 1982-08
READ THESE TERMS AND CONDITIONS CAREFULLY BEFORE USING THIS WEBSITE. https://nrc-publications.canada.ca/eng/copyright
Vous avez des questions? Nous pouvons vous aider. Pour communiquer directement avec un auteur, consultez la première page de la revue dans laquelle son article a été publié afin de trouver ses coordonnées. Si vous n’arrivez pas à les repérer, communiquez avec nous à PublicationsArchive-ArchivesPublications@nrc-cnrc.gc.ca.
Questions? Contact the NRC Publications Archive team at
PublicationsArchive-ArchivesPublications@nrc-cnrc.gc.ca. If you wish to email the authors directly, please see the first page of the publication for their contact information.
NRC Publications Archive
Archives des publications du CNRC
This publication could be one of several versions: author’s original, accepted manuscript or the publisher’s version. / La version de cette publication peut être l’une des suivantes : la version prépublication de l’auteur, la version acceptée du manuscrit ou la version de l’éditeur.
For the publisher’s version, please access the DOI link below./ Pour consulter la version de l’éditeur, utilisez le lien DOI ci-dessous.
https://doi.org/10.1016/0165-232X(82)90041-6
Access and use of this website and the material on it are subject to the Terms and Conditions set forth at
Comparative strengths of fresh water ice
Timco, G. W.; Frederking, R. M. W.
https://publications-cnrc.canada.ca/fra/droits
L’accès à ce site Web et l’utilisation de son contenu sont assujettis aux conditions présentées dans le site LISEZ CES CONDITIONS ATTENTIVEMENT AVANT D’UTILISER CE SITE WEB.
NRC Publications Record / Notice d'Archives des publications de CNRC:
https://nrc-publications.canada.ca/eng/view/object/?id=e2859d5b-995f-457a-af32-cb9bfe2b496a https://publications-cnrc.canada.ca/fra/voir/objet/?id=e2859d5b-995f-457a-af32-cb9bfe2b496aSsr
National Research
Conseil national
'
1
31
Council Canada
de recherches Canada
N21d
COMPARATIVE STRENGTHS OF FRESH WATER ICE by G.W. Timco and R.M.W. Frederking
ANALYZED
l 2 0 7 ~
Reprinted from
Journal of Cold Regions Science and Technology Vol. 6,1982
p. 21 - 2 7
DBR Paper
No.
1059Division of Building Research
Price $1.25 OTTAWA t t
BLDG.
RES.'
L I B R A R Y
02- 1!-
05
s~Btto~ueou€
I
r Rech. B5;i.n. b NRCC 20704Une s d r i e d ' e s s a i s a i5te e f f e c t u g e dans d e s c o n d i t i o n s i d e n t i q u e s pour comparer l e s v a l e u r s d e s d i v e r s e s c a r a c t g r i s t i q u e s mecaniques d e l a g l a c e d'eau douce. Les c o n d i t i o n s d ' e s s a i 6 t a i e n t les
m s m e s ,
notamment en c e q u i concerne l a c r o i s s a n c e de l a g l a c e , l e t y p e de g l a c e , l a dimension d e s c r i s t a u x , l e u r o r i e n t a t i o n , l a t a i l l e d e s C c h a n t i l l o n s , l a tempdrature, a i n s i que l a v i t e s s e d e s d e f o r m - t i o n s . Les r e s u l t a t s moyens de c e s e s s a i s o n t d t e les s u i v a n t s : pour l a r g s i s t a n c e3
l a f l e x i o n , avec une p o u t r e e n porte-3-faux =770
+
150
kPa; pour l a r e s i s t a n c e 3 l a f l e x i o n , avec une p o u t r es i m p l e ( t e n s i o n dans l a couche sup'erieure) =
2 200
+
320
kPa; pourl a r e s i s t a n c e 2 l a r u p t u r e = 83 f
7
W am+;
pour l a r g s i s t a n c e a u c i s a i l l e m e n t =500
+
200
kPa; pour l a r e s i s t a n c e e n compression(charge h o r i z o n t a l e ) =
4 400
+
700
W a e t pourl e
module dedGformation, avec une p o u t r e en porte-2-faux =
1.6
f0.4
GPa. Comme l a p l u p a r t d e s e s s a i s o n t Gt6 r d a l i s ' e s2
l ' a i d e d'une machine d ' e s s a i de compression p o r t a t i v e , l e s v a l e u r s d e s r 4 s i s t a n c e s peuvent s e r v i r comme base de comparaison i n - s i t u .Cold Regions Science and Technology,6 (1982) 21 -27
Elsevier Scientific Publishing Company, Amsterdam - Printed in The Netherlands
COMPARATIVE STRENGTHS OF FRESH WATER ICE G.W. Timco
Hydraulics Laboratory, Division of Mechanical Engineering, National Research Council of Canada, Ottawa, Ontario K I A OR6 (Canada)
and R.M.W. Frederking
Geotechnical Section, Division of Building Research, National Research Council of Canada, Ottawa, Ontario K 1A OR6 (Canada) (Received September 21, 1981; accepted in revised form January 29, 1982)
ABSTRACT
In order to gain a quantitative comparison among the various mechanical properties o f ice, a series o f tests was performed on fresh water ice in which several of the mechanical properties were tested under identical experimental conditions. In partic- ular, the tests were standardized with respect to ice growth conditions, ice type, grain size and orienta- tion, sample size, test temperature and strain rate. The average results of the test were: flexural strength
- cantilever beam = 770
+
150 kPa; flexural strength- simple beam (top tension) = 2200
+
320 kPa; flexural strength - simple beam (bottom tension) =1770
+
190 kPa; fracture toughness = 83+
7 kPa m ~ ~ z . , shear strength = 500+
220 kPa; compressive strength (horizontal loading) = 4400 i: 700 kPa andstrain modulus - cantilever beam = 1.6 i: 0.4 GPa.
Since most o f the tests were performed using a port- able compression test machine, the strength values can serve as baseline values for comparison with field results.
1. INTRODUCTION
In trying t o understand the mechanical behaviour of ice, the mechanical properties of ice have been studied by a number of investigators. These usually take the form of detailed studies of one particular
mechanical property; for example, the compressive strength as a function of one or two external variables. Such tests are useful since they elucidate the proper- ties of ice, and give insight into its behaviour. It is well known, however, that because ice is an aniso- tropic substance, which is usually studied in its homologous temperature range greater than 0.9, the mechanical properties are a strong function of temperature, grain size, type and orientation, sample size, loading rate and strain rate. As such, valid comparisons of test results for different mechanical properties are usually difficult and sometimes impos- sible to do. In the present experiments, a different approach was taken to that usually done.
A number of the mechanical properties of ice, including the flexural strength, shear strength, com- pressive strength, fracture toughness and strain modulus were measured on ice samples which were all standardized with respect to growth conditions, test temperature, grain size, type and orientation, sample size and strain rate. This allows a ready comparison of mechanical properties of ice.
In addition, as an integral part of these experi- ments, the tests were designed so that they could be performed readily in the field. Since the ice used in these experiments was uniform, fine-grained columnar ice, the tests provide good baseline strengths for comparison with later field tests.
2. EXPERIMENTAL
Two fresh water ice sheets were grown in a large refrigerated tank (21 m X 7 m X 1.2 m) located in the Hydraulics Laboratory of the National Research Council in Ottawa (Pratte and Timco, 1981). Growth of ice as a large ice sheet allows the production of a large number of samples formed under the same con- ditions. In growing the sheets, the water was air bubbled to a uniform temperature of O.loc, and then seeded using a fine water spray at - 1 8 " ~ ambient air temperature. The sheets were then grown at an average air temperature of -12°C. This seeding procedure produced extremely fine grained colum- nar ice (Type S2) as shown in Fig. 1. The grain size varied from approximately 1 mm at the top of the sheet to approximately 3 mm at the bottom. There was no difference in grain size between the two sheets. For all tests (except the in situ cantilever
beams), blocks of ice 45 cm X 45 cm X 6 m were cut from the sheet and trimmed to size (40 cm X 10 cm X
6 cm) with a band saw. This width of ice results in a large sample width to grain diameter ratio (approx- imately 50). In relative terms, therefore, these may be regarded as very large samples. The samples were allowed to equalibriate overnight at
-1o0c.
In testing these samples, a motorized 0.05 MN capacity compression tester (Soiltest CT405) with specially designed aluminum platens was employed. This machine is fairly light and portable and can be used in field testing (Frederking and Timco, 1981). The platens were designed to allow simple setup of each test with minimal alteration to the machine. The design of the platens is shown in Fig. 2. In opera- tion, the platens, which each have a 1.2-cm-deep circular recess in the back face, fit over the circular steel platens of the press. The lower platen is held in place by gravity, whereas the upper platen is held up
Fig. 1 . Photograph of a thin section of ice between crossed polaroids showing a vertical section and horizontal sections at the top and bottom of the ice sheet. The thickness of the sample is 6.4 cm.
by thumb screws which tighten into the steel platen. Using the long bottom platen and the V-grooved upper platen in combination with the 1.3 cm diam- eter rods, 3-point flexure, 4-point flexure and 3- and 4-point fracture toughness tests can be easily per- formed at desired bar spacings. Since the bars are self-aligning in the V-grooves, the upper bar(s) were simply held in place until they made contact with the ice. For testing in shear, the upper platen with the single 5-cm protrusion was used in combina-
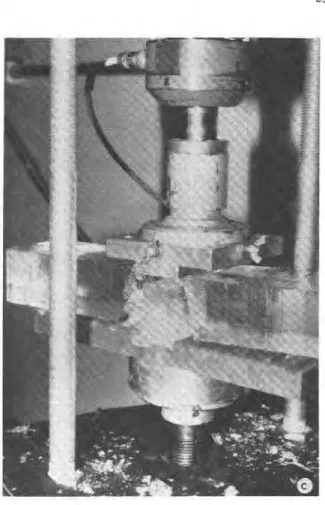
Fig. 2. Photographs showing (a) the special aluminum platens used in these experiments; (b) the platens in operation during a 4-point flexure test and (c) after a shear test.
tion with the long bottom platen. For compression testing, the special platens were removed and the original circular steel platens of the press were used. In addition, a number of the samples were trans- ported to another cold room at Division of Building Research, NRC, and tested on a larger (0.1 MN capacity) Instron test machine. This was done to compare the results of compression "field" tests with those made under well-defined laboratory conditions. The results presented are averages from both ice sheets unless otherwise noted.
3. FLEXURAL STRENGTH 3.1 Cantilever tests
The first series of tests was performed by cutting a number of cantilever beams (55 cm X 12 cm X 6.5
cm) using an electric chain saw. During these tests, the room was kept at -lo°C air temperature. A thermocouple which was frozen into the ice sheet indicated an average ice temperature of - 3 " ~ . In all, 13 beams were tested in this series. In all cases, the tests were of the push-down type (i.e. top in tension). The load was applied to the end of the beam using a load cell which was mounted on a rack and pinion drive and clamped onto the side of the service carriage which spans the ice tank. The load was re- corded on both an X-time and X- Y recorder. From the maximum load (PI) and the dimensions of the beam, the flexural strength was calculated from a = 6P'L/wh2, where L is the length of the beam, w is the width and h is the thickness. In addition, from the load-time curves, the loading stress rate was determined (Sinha, 1981). A DCDT displace- ment transducer was suspended from a rigid beam which spanned the tank (independent of the service carriage) to measure the tip deflection (6) during loading. The output of the displacement transducer was also recorded on a Y-time and X- Y recorder. From the load-deflection plots, the strain modulus
(9
was determined from E = 4 ~ ~ ~ l w h ~ 6 .In loading the beams, a wide range of loading rates was employed in order to look at the stress rate
LOADING STRESS RATE (MPa sec-'1
Fig. 4. Strain modulus vs. loading stress rate determined from the cantilever tests.
dependence. The results from these tests are shown in Figs. 3 and 4 as a function of stress rate. The results indicate that: (i) the average cantilever strength was 770
*
150 kPa, and the average modulus was 1.6 f 0.4 GPa; (ii) neither the strength nor the modulus was a function of the loading rate in the range 0.1 to 2 MPa s-'.
3.2 Simple beam
In testing the flexural strength of the ice using
X 1 7 7 0 + 1 9 0 k P a x
.
8 K F L E X U R E ( C A N T I L E V E R ) I- V, 4 0 0 7 7 0 2 7 5 0 k P e-
**I
6000 4 0 0 0 2 0 0 0-
ta PLOADING STRESS RATE ( M P a S ~ C - I ) 1 - I I 1 1 1 1 1 1 I 1 1 1 1 1 1
-
, - - / - - / - ( P O R T A B L E P R E S S )-
C O M P R E S S I O N/
- ( L A B O R A T O R Y P R E S S 1/**
LLi
F L E X U R E ( S I M P L E B E A M - T O P T E N S I O N I-
z z o o + a z o k P a-
-
+ F L E X U R E ( S I M P L E B E A M - B O T T O M T E N S I O N )the simple beam approach, both 3-point and 4-point loading configurations were used. In addition, since there was an increase in grain size with depth in the ice, the tests were divided into two series in which , either the top or bottom of the ice was put in tension. In all, 29 samples were tested from the two
1
ice sheets. In testing, the compression tester was used at a nominal cross-head rate of 4 X mm s-'. Loads were monitored using an Interface 1000 kg load cell and X-time plots were made. No deflection measurements were taken, and therefore modulus values were not determined. The total span between outer supports (L) was 3 0 cm for all tests, and the loading was at the one-third points in the 4-point tests. From the maximum load at failure (P'), the strength of the ice was calculated from o = 3P'Ll 2wh2 and o = P'L/wh2 for 3 and 4-point loading arrangements, respectively. On average, there was no significant difference in strength values between the two ice sheets. The test results are shown in Fig. 3. From these results: (i) the average flexural strength was 2200+
320 kPa and 1770 ? 190 kPa for the top and bottom in tension, respectively; (ii) the flexural strength values determined using the simple beam approach are significantly higher than that deter- mined using the cantilever beam method. Part of this difference undoubtedly is due to the temperature effect since a temperature gradient existed in the cantilever beams during the test; (iii) there was no difference in strength between 3- and 4-point loading arrangements; (iv) the strength is independent of loading rate between 0.05 and 0.15 MPa s-'; (v) there is a difference in results depending on whether the beams were tested with top or bottom in tension. To determine if this difference in the results in this latter case is statistically significant, the observed difference (D) can be compared t o the standard error of difference (G) (see for example, Moroney, 1968). If DIG>
2, the observed difference is statistically significant. In this case, for top in tension, n l = 14, o l = 2200, sl = 320 and for bottom in tension, n2 = 15, o2 = 1770, s2 = 190 andD = - 02 = 430. Also,
Thus, the observed difference is definitely significant.
Since all other external parameters were the same in both cases, this observed difference can be attributed to the difference in grain size in the region of tension (see Fig. 1).
4. FRACTURE TOUGHNESS
To gain some insight into the toughness of the ice (i.e. resistance to fracture), fracture toughness tests were performed using the same general arrangement as that for the simple beam tests. In this case, using the band saw, a notch of length a , approximately 1.2 cm, was made in the centre of the beams on the 45 cm X 10 cm face. This notch was subsequently sharpened using a surgeon's scalpel before inserting the beam into the press. The same test conditions (beam size, orientation, strain rate, temperature, etc.) were used as in the simple beam tests. The fracture toughness (Krc) was calculated from
K r c = [3P'La'/2/2wh2] f (alh) where
for 3-point loading and
where
f (alh) = 1.99 - 2.47 (alh)
+
12.97 ( ~ l h ) ~-
23.17 ( ~ / h ) ~+
24.80 ( ~ 1 h ) ~for 4-point loading (see Brown and Strawley, 1966). Similar to the simple beam tests, both top and bot- tom of the ice were tested in tension. Note that with a notch depth of 1.2 cm in 5-6 cm thick ice, the con- dition that a
>
2 . 5 ( ~ ~ ~ { o ) ~ is easily satisfied (Brown and Strawley, 1966). For sheet No. 1, only 3-point tests were performed, whereas both 3- and 4-point tests were performed on sheet No. 2. There was no difference in results between 3-point loading for No. 1 and No. 2 ice sheets. The results of the tests are summarized in Table 1. In general, the tests indi- cate: (i) the average toughness value was 85+
7 kPa m112 for top in tension and 81+
6 kPa m'I2 forTABLE 1
Results of fracture toughness tests
-
Test type Number of KIC
f4
samples (kPa m1I2) (MPa m'I2 s-')
3-pt. top tension 5 82 9 0.010-0.015 3-pt. bottom tension 5 81
*
6 0.010-0.016 4-pt. top tension 5 87 + 5 0.009-0.013 4-pt. bottom tension 5 81+
6 0.007-0.014 Overall top tension 10 85*
7 0.009-0.015 Overall bottom tension 10 81 + 6 0.007-0.016Average 20 83
+
7 0.007-0.016bottom in tension, and 8 3 ? 7 kPa m'I2 overall; (ii)
KIC
is independent ofkI
in the range 0.007-0.016 Mpa ml" s-'; (iii) there is no apparent differ- ence in
KIC
between 3- and 4-point loading configu-rations; (iv) in contrast to the flexural strength, there is no apparent difference between tests performed with top and bottom in tension. In this case however, since the tip of the crack was close to the central portion of the ice sample in both cases, the difference in grain size between these tests would not be nearly as great as those in the simple beam tests (see Fig. 1). As such, unless the fracture toughness was a very strong function of grain size, no difference between these cases would be expected; (v) using the average flexural strength of the ice from simple beam tests,
o = 2000 kPa, the critical surface flaw size (c) for failure, calculated from
KIC
= 1 . 1 2 o ( 7 r ~ ) " ~ (Brown and Strawley, 1966), is determined to be approxi- mately 0.4 mm for this ice.5. SHEAR STRENGTH
The shear strength of the ice was measured using the compression tester and shear platens as described in Section 2. For these tests, the sample size and loading rate were the same as for the simple beam tests, although in some later tests, samples were trimmed to 3.0 cm thickness to define better the shear zone. In testing, both double shear and single shear were attempted.
In both cases however, difficulties arose in the interpretation of the test results. In the double shear tests, the beam usually broke along one side first (i.e. the two sides did not shear simultaneously). In evaluating the results, the shear strength was taken as the average of the two strength values for each
sample. In the single shear tests, one end of the beam was suspended over the shearing edge, and the load was applied until ice failure. With this arrangement - -
however, the ice piece would lift from the lower platen and thereby alter the shearing arrangement. To overcome this, the end was clamped onto the lower platen using a large C-clamp. This also was unsatisfactory however, since it preloaded the ice beam before the test. Because of these difficulties, these tests can not be regarded as true shear tests. Nevertheless, they should give some indication of the shear strength of the ice. Results of these tests are presented in Fig. 3. The results indicate: (i) the average shear strength was 410 k 190 kPa and 660
*
210 kPa for single and double shear, respective- ly. A statistical analysis of the standard error of dif- ference indicates that this difference is only marginal- ly statistically significant. By averaging, the shear strength of the ice was 500 ? 220 kPa (neglecting stress rate effects); (ii) the strength is very dependent on the stress rate in the range 0.02-0.12 MPa s-' such that a, = 8000 6, where a, is in kF'a and 6, in MPa s-'.
6. COMPRESSIVE STRENGTH
Samples from both ice sheets were cut 17 cm X 1 0 cm X 5.5 cm and tested in compression for horizontal loading direction (i.e. load applied perpendicular to the long direction of the grains) at the same nominal cross-head rate and temperature (-10°C) as the other tests. In addition, ice samples were transported to a cold room at DBRINRC and tested over a range of nominal strain rates and a temperature of -10°C on a much stiffer machine (Instron model TTDM-L, 0.1 MN capacity). This was done to compare the results of compression tests done on a portable (field) compression tester (0.05 MN capacity) with those obtained under carefully controlled laboratory con- ditions. This comparison is important since it has been shown that the stiffness of the test machine can influence significantly the apparent strength results (Sinha and Frederking, 1979). For the tests using the portable compression tester, no special end surface preparation was performed beyond the band saw cut, although two pieces of thin cardboard were inserted at each end to help compensate for any surface irregularities. For the tests on the Instron machine, however, care was taken to mill carefully the end surfaces both flat and parallel to each other. The
results from both of these test series are presented in Fig. 3. The results indicate: (i) the average com- pressive strength of the ice as measured on the portable press was 4.4
+
0.7 MPa; (ii) the compressive strength of the ice as measured under carefully con- trolled laboratory conditions in terms of nominal strain rate (€) isand in terms of loading stress rate (ul) is
o = 10.8 (u1)0.29; 3 X
<
u1<
lo-' MPa s-' where the units of stress are MPa, strain rate are s-' and stress rate are MPa s-'; (iii) under the same exper- imental conditions as the tests performed on the portable press (-10"~,P =
2 X s-'), the strength of the ice as measured on the laboratory-prepared specimens was 7.5 MPa at a stress rate of 0.36 MPas-'. This is significantly higher than the strength of 4.4 MPa at an average loading stress rate of 0.13 MPa s-' as measured using the portable press. This differ- ence is due not only to test machine stiffness which should be eliminated by a comparison on a stress rate basis (Sinha and Frederking, 1979), but also to speci- men preparation. Further investigations are required to clarify the source (or sources) of these discrep- ancies.
7. ACKNOWLEDGEMENT
The authors would like to thank Joe Neil and Archie Dewar for technical assistance in this program. The helpful comments of Grant Wood in designing the platens are appreciated.
REFERENCES
Brown, W.F. and Strawley, J.E. (1966), Plane strain crack toughness of high strength metallic materials, American Society for Testing and Materials (ASTM Special Tech- nical Publication No. 410).
Frederking, R.M.W. and Timco, G.W. (1981), Mid-winter mechanical properties of ice in the Beaufort Sea, Proc. POAC '81, Vol. I, pp. 225-234, Quebec City, Canada. Moroney, M.J. (1968), Facts from Figures, Penguin Books,
Baltimore, Maryland, U.S.A.
Pratte, B.D. and Timco, G.W. (1981), A new model basin for the testing of ice-structure interactions, Proc. POAC '81, Vol. 11, pp. 857-866, Quebec City, Canada.
Sinha, N.K. (1981), Rate sensitivity of compressive strength of columnar-grained ice, Exp. Mech. 21(6): 209-218. Sinha, N.K. and Frederking, R.M.W. (1979), Effect of test
system stiffness on strength of ice, Proc. POAC '79, Vol. 1, pp. 708-717, Trondheim, Norway.
This publication is being distributed by the Division of Building R e s e a r c h of the National R e s e a r c h Council of Canada. I t should not be reproduced in whole o r in p a r t without p e r m i s s i o n of the origi.na1 publisher. The Di- vision would b e glad to b e of a s s i e t a n c e in obtaining such p e r m i s s i o n .
Publications of the Division m a y b e obtained by m a i l - ing the a p p r o p r i a t e r e m i t t a n c e (a Bank, E x p r e s s , o r P o s t Office Money O r d e r , o r a cheque, m a d e payable t o the R e c e i v e r G e n e r a l of Canada, c r e d i t NRC) t o the N a t i o n a l R e s e a r c h Council of Canada, Ottawa. KIA OR6. Stamps a r e not acceptable.
A l i s t of a l l publications of the Division is available and m a y b e obtained f r o m the Publications Section, Division of Building R e s e a r c h , National R e s e a r c h Council of Canada, Ottawa. KIA OR 6.