HAL Id: hal-01835883
https://hal.archives-ouvertes.fr/hal-01835883
Submitted on 11 Jul 2018
HAL is a multi-disciplinary open access
archive for the deposit and dissemination of
sci-entific research documents, whether they are
pub-lished or not. The documents may come from
teaching and research institutions in France or
abroad, or from public or private research centers.
L’archive ouverte pluridisciplinaire HAL, est
destinée au dépôt et à la diffusion de documents
scientifiques de niveau recherche, publiés ou non,
émanant des établissements d’enseignement et de
recherche français ou étrangers, des laboratoires
publics ou privés.
Simulation of LoRa in NS-3: Improving LoRa
Performance with CSMA
Andrzej Duda, Thanh-Hai To
To cite this version:
Andrzej Duda, Thanh-Hai To. Simulation of LoRa in NS-3: Improving LoRa Performance with
CSMA. IEEE ICC, May 2018, Kansas City, United States. �hal-01835883�
Simulation of LoRa in NS-3: Improving LoRa
Performance with CSMA
Thanh-Hai To and Andrzej Duda
Univ. Grenoble Alpes, CNRS, Grenoble INP, LIG, 38000 Grenoble, France
Abstract—In this paper, we consider two research issues. First, we present a NS-3 module that simulates the behavior of LoRa in an accurate way. To validate the module, we compare its results with measurements on a real-world testbed and with measured values reported by other work. We also show that the module correctly represents the capture effect that lowers the packet drop rate due to collisions. Second, we want to improve the performance of LoRa devices while not impacting energy consumption, the aspect that usually is not taken into account in the literature. We use the simulator to evaluate CSMA (Carrier Sense Multiple Access), a simple enhancement to LoRaWAN that lowers the collision ratio. The simulation results show that CSMA considerably lowers the collision ratio while only slightly increasing energy consumption. We also observe that CSMA presents lower energy consumption than LoRa for a large number of devices. Another advantage of CSMA consists of increased throughput and larger network capacity because the ETSI restrictions on the duty cycle do not longer apply.
Index Terms—LoRa, LoRaWAN, collision ratio, energy con-sumption, network simulation
I. INTRODUCTION
LoRa has become an interesting technology for lightweight smart sensing in the Internet of Things (IoT) [1]. It belongs to the new class of LPWAN (Low Power Wide Area) networks and defines a specific radio layer based on the Chirp Spread Spectrum (CSS) modulation and a simple channel access method called LoRaWAN [2]. The LoRa operation depends on a set of parameters: i) BW (Bandwidth), a range of spectrum for transmissions, ii) SF (Spreading Factor), the chirp rate that controls the bit rate and reliability (higher SF means lower bit rate and lower BER, Bit Error Rate), and CR (Coding Rate) that defines the ratio of the redundant information for Forward Error Correction (FEC). The LoRa CSS modulation results in low sensitivity enabling transmissions over long distances: a range of several kilometers outdoors and hundreds of meters indoors. Depending on the duty cycle of LoRa devices, their lifetimes may become very long, for instance 17 years for a node sending 100 B once a day [3].
LoRaWAN [2] defines an access method to the radio chan-nel similar to ALOHA: a device wakes up and sends a packet to the base station (Gateway in the LoRa terminology) right away. The difference with pure ALOHA is the variable packet length in LoRa. This choice of the access method highly impacts the capacity of LoRa and its scalability to a large number of devices. Several authors studied these aspects [4], [5], [6], [7], [8], [9], [10], [11], [12]. The main conclusions to draw from the analyses are the following:
• the range of the LoRa network is limited to several kilometers, for instance: i) less than 10% of loss rate over a distance of 2 km for SF 9-12 and ii) more than 60% of loss rate over 3.4 km for SF 12. The coverage probability drops exponentially as the number of contending devices grows.
• the number of devices in a cell can be relatively large, but they are limited to sending a few bytes of data per day.
• the ETSI regulations of the 868 MHz ISM band set limits on the maximum duty cycle to 0.1% or 1% in the 863 − 870 MHz ISM band (depending on the selected sub-band), which also limits the throughput of devices and the overall network capacity.
• the LoRaWAN operation similar to ALOHA results in a high level of packet losses due to collisions as the number of devices increases.
• the impact of collisions is significantly mitigated by the
capture effect in which some transmissions that benefit from a stronger signal are successful despite of collisions. Surprisingly, almost all the previous papers only consider performance aspects and do not take into account energy consumption of devices, a critical aspect in many applications. Our research goal is to find a means for improving the LoRa performance in terms of packet delivery rate, collision ratio, throughput, and energy consumption. To design enhanced access methods, we need a tool for quickly evaluating potential schemes for a large number of devices and explore a large design space. Contrary to many papers that used ad hoc LoRa simulators in their analyses, we have decided to build upon NS-3 [13], a well established tool in the networking community. We have developed a module that simulates the LoRa behavior with a sufficient level of details to obtain meaningful results. We validate the module by comparing its results with measurements on a testbed and by comparing them with the measured values from other work.
The objective of the energy efficient operation of LoRa devices along with the goal of improved performance makes the design of a new access method particularly difficult. Many known random access approaches such as CSMA/CA used in 802.11 networks require increased wake-on periods of operation, which leads to increased energy consumption. As the first step in improving LoRaWAN, we propose to consider a simple enhancement that does not impact energy consumption—the CSMA principle consisting of testing the channel if it is used by another transmission before attempting
to send a packet [14]. The principle, also referred to as “Listen Before Talk (LBT)”, appears in the ETSI regulations: without LBT, devices need to limit their duty cycles to 0.1% or 1% depending on the sub-band. Thus, if devices apply the CSMA principle, the limitation is released so devices can use higher duty cycles, which contributes to possibly increased throughput and larger network capacity. To further lower the collision ratio, we extend CSMA with CSMA-x in which a LoRa device tests the channel during interval x before transmitting a packet. If during the interval, there is no channel activity, the device can attempt a transmission. Listening to the channel during the interval increases the consumed energy, but it may avoid some collisions, thus reducing the overall energy consumption.
We use the NS-3 simulator of LoRa to evaluate CSMA and CSMA-x compared to pure LoRaWAN. The enhanced meth-ods result in a much better collision ratio while only slightly increasing energy consumption. For higher loads, CSMA-x even shows an improvement with respect to LoRaWAN. They enable higher transmission rates by getting rid of the 868 MHz ISM band restrictions.
The organization of the paper is as follows. We start with discussing the related work in Section II. Section III gives an overview of LoRa, LoRaWAN, and the LoRa network architecture. In Section IV, we describe the NS-3 simulation framework for LoRa. Section V defines the operation of CSMA and CSMA-x. In Section VI, we present the results of the evaluation. Finally, Section VII concludes the paper.
II. RELATEDWORK
Several authors studied the issue of limits to the capacity of LoRa and its scalability to a large number of devices. Georgiou and Raza [4] provided a stochastic geometry framework for modeling the performance of a single gateway LoRa network. They showed that the coverage probability drops exponentially as the number of contending devices grows. They concluded that LoRa networks will become interference-limited rather than noise-limited in dense deployment scenarios because of the LoRaWAN access method.
Augustin et al. [5] presented throughput measurements on a testbed showing: i) less than 10% of loss rate over a distance of 2 km for SF 9-12 and ii) more than 60% of loss rate over 3.4 km for SF 12. They also simulated the LoRa behavior for a larger number of devices and showed that it behaves closely to ALOHA with the maximum channel capacity of 18% and an increasing collision ratio: for a link load of 0.48, the ratio is around 60%.
Adelantado et al. [6] explored LoRa from the point of view of the capacity and the network size. They observed that for low duty cycles, throughput is limited by collisions, whereas for higher duty cycle values, the maximum duty cycle set by the ETSI regulations prevents devices from increasing their packet transmission rates and limits throughput. For instance, for 1000 devices, the maximum packet rate per node is 38 pkt/hour (packets of 50 B) with the probability of successful reception of only 13%.
Reynders et al. [7] compared the performance of LoRa and Ultra Narrowband (UNB, SIGFOX-like) networks with regard to the range and coexistence. They showed that UNB MAC is slightly better than LoRaWAN: the latter discards both colliding packets at reception, while the UNB network enables reception of the strongest packet thanks to the capture effect. The maximal throughput of the network occurs for 105 devices in the network, but results in a packet loss of 63%.
Haxhibeqiri et al. [8] investigated the scalability of LoRa in terms of the number of devices per gateway. They used a sim-ulation model based on the measurements of the interference behavior between two nodes to show that when the number of nodes with the duty cycle of 1% increases to 1000 per gateway, losses increase to 32%. However, this level of the loss rate should be considered as low compared to 90% in pure ALOHA for the same load and it results from taking into account the capture effect, which apparently plays an important role in the LoRa behavior. We compare their measured packet loss rate and collision ratio with the simulation results.
Mikhaylov et al. [9] showed that a LoRa cell can po-tentially serve a large number of devices, but devices are limited to sending only a few bytes of data per day. The majority of devices need to be located in the vicinity of the gateway: only less than 10% can reside at distances longer than 5 km. Another factor that limits scalability is the use of acknowledgements—as the gateway is subject to the same ETSI restrictions on the duty cycle, it cannot acknowledge each packet in a dense network.
Bor et al. [10] developed a LoRa simulation to study its scal-ability. They showed that a typical Smart City deployment can support 120 nodes per 3.8 ha, which is not sufficient for future IoT deployments. Other studies in the literature analyzed the performance of the LoRa modulation—Goursaud and Gorce [11] considered other technologies (SigFox, Weightless, and RPMA by Ingenu) in addition to LoRa to highlight their pros and cons.
Ochoa et al. [12] proposed various strategies to adapt LoRa radio parameters to different deployment scenarios. Their simulation results showed that in a star topology, we can achieve the optimal scaling-up/down strategy of LoRa radio parameters to obtain either a high data rate or a long range while respecting low energy consumption.
All the analyses show a large space for possible improve-ment of the LoRa performance. Nevertheless, the proposals for enhanced access methods need to take into account energy consumption along with performance, which is our goal in the next sections.
III. LORAOVERVIEW
This section gives a short introduction to the LoRa physical layer, the LoRaWAN channel access method, and the network architecture.
A. LoRa Physical Layer
The LoRa physical layer is based on the Chirp Spread Spectrum modulation that provides low sensitivity needed for
long communication ranges [15]. Communication between end devices and gateways can take place simultaneously on multiple frequency channels. Each end device can transmit its packet with a specific SF (Spreading Factor). For a given SF, there are 2SF chirps per symbol. Higher values of SF result in longer communication ranges. Typical values of bandwidth (BW) are 125, 250, and 500 kHz in the ISM 868 and 915 MHz bands [11]. Sensitivity ranges from -136 dBm for SF 12 and BW of 125 kHz to -111 dBm for SF 6 and BW of 500 kHz. Coding Rate (CR) can be 45, 46, 47, or 48. For instance, for BW of 125 kHz and CR of 45, the bit rate is 5468 b/s with SF 6 and 293 b/s with SF 12.
B. LoRaWAN
LoRaWAN defines three types of devices, namely Class A, B, and C. Class A devices use pure ALOHA protocol for the uplink. After sending a packet, a device listens to a response from the gateway during two downlink receive windows. Class A results in the lowest energy consumption, so we only consider this class in the paper. Class B devices aim at applications requiring more downlink traffic. The devices open extra receive windows at scheduled times by receiving a time-synchronized beacon from the gateway. Class C devices are always on and listen to the channel all the time, so their energy consumption is the highest. Only Class A must be implemented in all end devices.
Although the parameters of the LoRa physical layer and the operation of LoRaWAN mostly impact the performance of LoRa networks, the ETSI restrictions on the sub-band duty cycle appear as the key factor for limiting the network size [6]. When a device transmits a packet in a given sub-band, it records the instant of the transmission and the time on the air [2]. It cannot use the same sub-band during interval ToffSubBand:
ToffSubBand=
T imeOnAir DutyCycleSubBand
− T imeOnAir (1) C. LoRa Network Architecture
A typical LoRa network can be viewed as a “star-of-stars” architecture with three entities: end devices, gateways, and a network server. Gateways relay packets between end devices and the network server. End devices send packets to gateways over a single wireless hop and gateways connect to the network server over a high throughput backhaul network.
IV. LORASIMULATIONMODULE INNS-3
We have developed a LoRa module for NS-3 based on some open source code shared by the Semtech company and other contributions.
A. LoRa Physical Layer
Knight implemented an open source physical layer of LoRa for end devices [16]. As this source code is written in C and Python and provided with documentation, it is a very good reference for implementing the physical layer of LoRa module on NS-3. Blum et al. [17] also implemented the physical layer of LoRa by making use of software-defined radio hardware to
receive and decode LoRa. It supports the data format used by the SX1272 LoRa chip.
We have developed the LoRa physical layer of our module based on these reference implementations.
B. LoRaWAN
There are three open source implementations of LoRaWAN by Semtech Corporation: i) an implementation of a LoRaWAN Class A and C end devices with SX1272/76 radio drivers [18], (ii) the library corresponding to the driver/hardware abstraction layer for building a gateway using a concentrator board based on the Semtech SX1301 multi-channel modem and SX1257/SX1255 RF transceivers [19], and iii) a LoRa packet forwarder running on the LoRa gateway for relaying packets to the network server over UDP/IP and from the network server to end devices over the LoRa link [20].
The implementations have provided us an in-depth under-standing of how to develop the NS-3 module for LoRaWAN class A end devices and gateways.
C. Existing NS-3 Components
The NS-3 framework already supports three components related to our goal: i) a pure ALOHA access method, ii) an implementation of the spectrum intended as an example for building custom models with the spectrum module, and iii) the energy framework for evaluating energy consumption of each node and the whole network.
We have first implemented the LoRa physical layer based on the existing open source implementations. Then, our module inherits the classes of the pure ALOHA access method to implement LoRaWAN class A devices. The NS-3 ALOHA access method is based on the MAC studied in the context of underwater sensor networks [21]. We have also reused the spectrum and energy modules of NS-3 with a number of modifications. We have used the ECC-33 propagation model developed by Electronic Communication Committee (ECC) [22] designed for cellular and microwave communications in the frequency range from 700 MHz to 3.5 GHz. We have integrated this path loss model already implemented in NS-3 in the LoRa module. The source code is available at https://github.com/drakkar-lig/lora-ns3-module.
D. Energy Framework in NS-3
We use the energy framework implemented in NS-3 by Wu et al. [23] to estimate energy consumption at a battery powered node or in the whole network. The framework reflects the following assumption on energy consumption.
All operations of devices are represented as states with their associated current draw values that determine power consumption. In case of the radio, we assume three states defined as transmit, receive, and sleep. The total energy consumption E is composed of the energy consumed in each state denoted as Etx, Erx, and Es, respectively:
E = Etx+ Erx+ Es, (2)
Fig. 1: The LoRa testbed with 4 Semtech SX1272LM1BAP end devices and a Kerlink IoT gateway.
Fig. 2: The real environment for deployment the testbed. The distance from end devices to the gateway is increased gradually.
where Ttx, Trx, Ts, and Ptx, Prx, Ps are time spent and
power consumption in the states for transmission, reception, and sleep, respectively. The energy consumption model reflects the operation of duty cycle MAC layers in a realistic way [24], [25].
The energy source is the power supply or batteries of network nodes. Connecting an energy source to a device energy model on an end device indicates that the end device draws power from the source. In NS-3, the energy sources supply power to devices on each node at a constant voltage of 3.3 V.
E. Validation of the LoRa Module
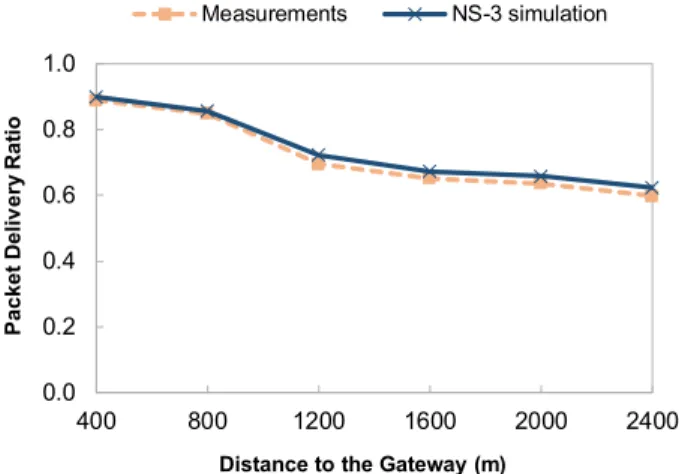
We have first validated the LoRa module on a testbed composed of four Semtech SX1272LM1BAP end devices and a Kerlink IoT Station used as a gateway (see Figure 1). We have run several experiments in a real world environment (see Figure 2) to measure the packet delivery rate and the collision ratio in function of the distance between end devices and the gateway using SF from 7 to 12. Figures 3 and 4 show the comparison between the measured values and the results of a NS-3 simulation in the same topology. The presence of objects in the environment (e.g., buildings) is the main reason for a small difference between the measured and simulated values.
0.0 0.2 0.4 0.6 0.8 1.0 400 800 1200 1600 2000 2400 P a c k e t De li v e ry Ra ti o
Distance to the Gateway (m)
Measurements NS-3 simulation
Fig. 3: Comparison between measured and simulated values: packet delivery ratio in function of the distance between end devices and the gateway.
0.0 0.2 0.4 0.6 0.8 1.0 0 0.2 0.4 0.6 0.8 1 C o ll is io n R a ti o Channel Load (%) Measurements NS-3 simulation
Fig. 4: Comparison between measured and simulated values: collision ratio in function of the channel load.
0.0 0.1 0.2 0.3 0.4 0.5 0.6 0.7 0.8 0.9 1.0 0 100 200 300 400 500 600 700 800 900 1000 P a c k e t l o ss /c o ll is io n r a ti o Number of Nodes
Simulation, packet loss Simulation, collision ratio Measured packet loss [8] Measured collision ratio [8]
Fig. 5: Comparison between simulated values and measure-ments by Haxhibeqiri et al. [8] showing the impact of the capture effect.
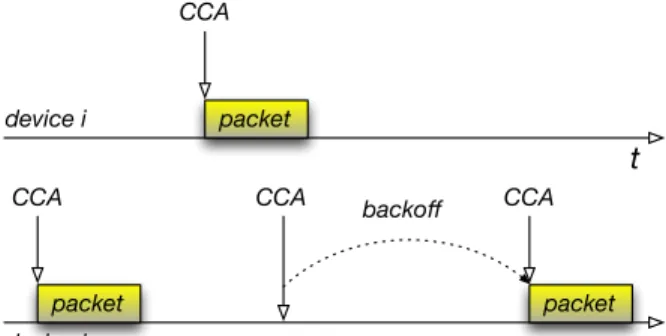
t CCA CCA CCA backoff packet packet packet device i device j CCA
Fig. 6: Principle of CSMA: device j sends a packet after a CCA and backs off when channel is busy.
We have also compared the results of the LoRa module with the measurements reported by Haxhibeqiri et al. [8] for the same simulation parameters. The goal is to validate the capture model in the module because their measurements showed an important impact of the capture effect that lowers the packet drop rate due to collisions. We have used a threshold-based model available on NS-3 for the packet capture effect [26]. We have considered a scenario with the number of devices up to 1000. Figure 5 shows the packet loss rate and the collision ratio predicted by the simulation compared to the results by Haxhibeqiri et al. [8].
V. IMPROVINGLORA WITHCSMA
In this section, we present the principle of CSMA for LoRaWAN.
We assume N contending devices. When end device i ∈ N has a packet to send, it randomly chooses communication channel ci. It performs CCA (Clear Channel Assessment) to
test if there is an ongoing transmission on the channel. Only when the channel is clear, the device starts its transmission, otherwise, it backs off— it goes to sleep for a random interval of time and attempts a transmission later on. The random interval is equal to k slots of 1 s, where k ∈ [0, 2n− 1] for
the nth transmission attempt (the maximum value of n is set
to 3). Figure 6 illustrates the principle.
Another variant of CSMA that we call CSMA-x is to listen to the channel for a small interval of time called CCG (Clear Channel Gap) before attempting a transmission. For instance, CSMA-10 corresponds to CSMA with an interval of 10 ms before a transmission. When the device detects a transmission during this interval, it backs off as in the basic CSMA. Figure 7 illustrates the principle.
To investigate the energy consumption at each node and in the whole network, we use Lithium-ion batteries as the type of energy sources and assign a device energy model to each end device. There are interactions between the energy source and the device energy model: the model consumes the energy from the source and the source notifies the model when its energy is completely drained.
The parameters of energy consumption in each state come from the datasheet of LoRa SX1272 [27] and the Low Energy
CCA
packet CCA
CCG
Fig. 7: Principle of CSMA-x: device j sends a packet after a CCA and a CCG interval.
TABLE I: Power consumption in LoRa
Ptx 419.6 mW
Prx 44.06 mW
Ps 4.32 µW
Consumption Design for SX1272/3/6/7/8 LoRa Modem [28] (see Table I).
VI. SIMULATIONRESULTS
In this section, we describe the scenario used in simulations and their results.
A. Simulation Scenario and Settings
TABLE II: Simulation parameters
Voltage 3.3 V Frequency Band 868 MHz Code Rate 4/5 Bandwidth 125 kHz Duty Cycle 1% Output Power 20 dBm Payload Length 10 bytes Preamble Length 12 symbols Number of channels 3 Spreading Factor SF7-SF12
We consider a scenario with one gateway and a number of end devices up to 10000 nodes. The simulation time is limited to 20000 seconds. The positions of end devices are randomly distributed around the gateway in the area of 10000 m x 10000 m. End devices send unconfirmed data frames. We simulate LoRaWAN, CSMA, and CSMA-10 (CSMA-x with the interval of 10 ms). Table I presents other parameters.
B. Results
We have evaluated CSMA and CSMA-10 and compared their performance with LoRaWAN using NS-3 with respect to packet delivery ratio, collision ratio, and energy consumption. We have simulated a network with an increasing number of nodes from 1 up to 10000. If a packet is being received by the receiver and it is receiving the preamble of another packet, we consider this situation as the capture effect: if the value of Signal-to-Interference Ratio (SIR) of the new packet is above a specific threshold, then the current packet is dropped and the receiver locks on the new incoming packet.
Figure 8 presents the packet delivery rate for LoRaWAN, CSMA, and CSMA-10 (the ratio of the number of received
0.0 0.2 0.4 0.6 0.8 1.0 P a c k e t De li v e ry Ra tio Number of Nodes
LoRaWAN CSMA CSMA-10
Fig. 8: Packet delivery ratio in the whole network under LoRaWAN, CSMA, and CSMA-10.
0.0 0.2 0.4 0.6 0.8 1.0 Co ll is io n Rat io Number of Nodes
LoRaWAN CSMA CSMA-10
Fig. 9: Collision ratio in the whole network under LoRaWAN, CSMA, and CSMA-10.
packets by the gateway to the number of all packets transmitted by end devices). We can observe a much better rate for CSMA compared to LoRa. The figure also shows better scalability of CSMA—it obtains the packet delivery rate greater than 90% for more than 4000 devices. The rate for CSMA-10 is even higher than that of CSMA when the number of devices rises up to 1500 devices and more.
Figure 9 presents the collision ratio for LoRaWAN and CSMA: the number of dropped packets because of collisions to the number of all transmitted packets. We can notice that the ratio rapidly increases for LoRaWAN with the number of contending devices. The increase of CSMA is much more moderate because devices send much less packets involved in collisions.
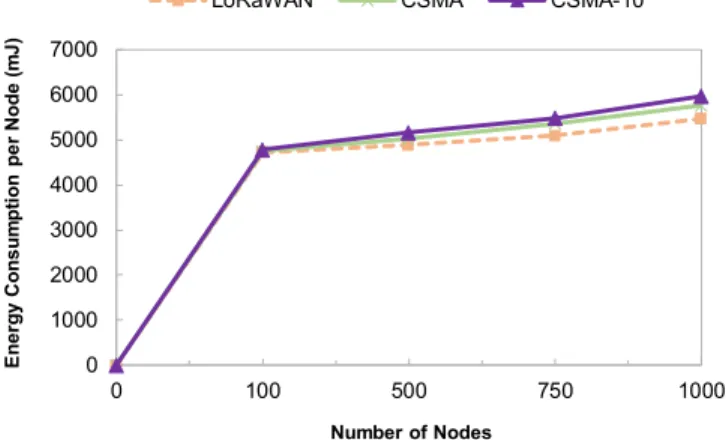
Figures 10, 11, and 12 present the energy consumption of LoRaWAN, CSMA, and CSMA-10 in a network with the number of devices in ranges 0 – 1000, 1500 – 4000, and 5000 – 10000, respectively. In range of 0 – 1000 devices, the total consumed energy for CSMA is higher than that of LoRaWAN because of the interval before transmission during which a device is awake (see Figure 10). For the range of
0 1000 2000 3000 4000 5000 6000 7000 0 100 500 750 1000 E n e rg y Co n s u m p tio n p e r No d e ( m J ) Number of Nodes
LoRaWAN CSMA CSMA-10
Fig. 10: Energy consumption per node under LoRaWAN, CSMA, and CSMA-10 for 0 – 1000 nodes.
0 1000 2000 3000 4000 5000 6000 7000 8000 9000 1500 2000 2500 3000 4000 E n e rg y Co n s u m p tio n p e r No d e ( m J ) Number of Nodes
LoRaWAN CSMA CSMA-10
LoRaWAN CSMA CSMA-10
Fig. 11: Energy consumption per node under LoRaWAN, CSMA, and CSMA-10 for 1500 – 4000 nodes.
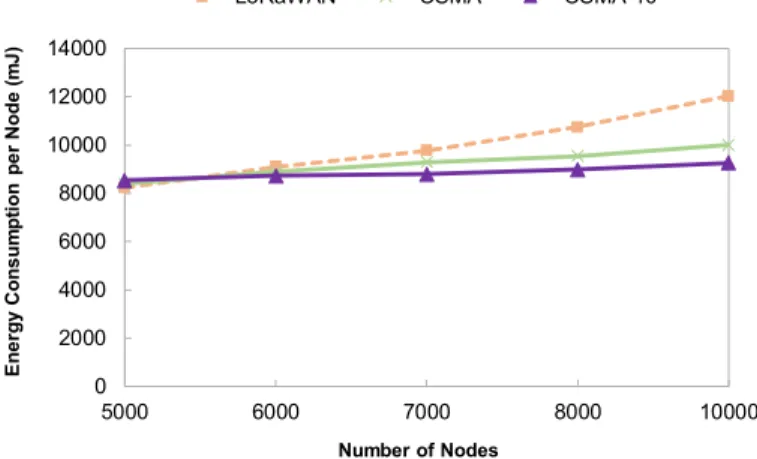
1500 – 4000, the difference is lower (see Figure 11) and the trend is inversed for the range of 5000 – 10000: the energy consumption of CSMA is lower than that of LoRaWAN (see Figure 12). For the large number of contending devices, there are more ongoing transmissions so the first CCA detects a transmission and the device backs off. LoRaWAN devices spend too much time in collisions.
VII. CONCLUSION
This paper considers two research issues. First, we have presented a NS-3 module that simulates the behavior of LoRa in an accurate way. To validate the module, we have compared its results with measurements on both a real-world testbed and the measured values reported in other work [8]. The comparisons show very good accuracy of the simulation results.
Second, we wanted to improve the performance of LoRa devices while not impacting energy consumption, the aspect that usually is not taken into account in the literature. We have used the NS-3 simulator to evaluate CSMA and CSMA-10, the proposed enhanced access methods that lower the collision
0 2000 4000 6000 8000 10000 12000 14000 5000 6000 7000 8000 10000 E n e rg y Co n s u m p tio n p e r No d e ( m J ) Number of Nodes
LoRaWAN CSMA CSMA-10
Fig. 12: Energy consumption per node under LoRaWAN, CSMA, and CSMA-10 for 5000 – 10000 nodes.
ratio. The simulation results show that CSMA considerably lowers the collision ratio while only slightly increasing energy consumption. We also observe that CSMA-10 presents lower energy consumption than LoRaWAN for a large number of devices. Another advantage of CSMA consists of increased throughput and larger network capacity because the ETSI restrictions on the duty cycle do not longer apply.
VIII. ACKNOWLEDGMENTS
This work has been partially supported by the French Ministry of Research projects DataTweet under contract ANR-13-INFR-0008-01, the PERSYVAL-Lab under contract ANR-11-LABX-0025-01, and the Use IoT project funded by Fonds Européens de Développement Régional (FEDER) No. N00011459 of the Auvergne-Rhône-Alpes region.
REFERENCES
[1] LoRaTM Alliance, “A Technical Overview of LoRa and
LoRaWAN.” [Online]. Available: {https://www.lora-alliance.org/-portals/0/documents/whitepapers/LoRaWAN101.pdf}
[2] N. Sornin, M. Luis, T. Eirich, T. Kramp, and O.Hersent, “LoRaWAN Specification v1.0.2,” 2016. [Online]. Available: https://www.lora-alliance.org/portals/0/specs/
[3] E. Morin, M. Maman, R. Guizzetti, and A. Duda, “Comparison of the Device Lifetime in Wireless Networks for the Internet of Things,” IEEE Access, vol. 5, pp. 7097–7114, 2017.
[4] O. Georgiou and U. Raza, “Low Power Wide Area Network Analysis: Can LoRa Scale?” IEEE Wireless Commun. Letters, vol. 6, no. 2, pp. 162–165, 2017.
[5] A. Augustin, J. Yi, T. H. Clausen, and W. M. Townsley, “A Study of LoRa: Long Range & Low Power Networks for the Internet of Things,” Sensors, vol. 16, no. 9, p. 1466, 2016.
[6] F. Adelantado, X. Vilajosana, P. Tuset-Peiró, B. Martínez, J. Melià-Seguí, and T. Watteyne, “Understanding the Limits of LoRaWAN,” IEEE Communications Magazine, vol. 55, no. 9, pp. 34–40, 2017.
[7] B. Reynders, W. Meert, and S. Pollin, “Range and Coexistence Analysis of Long Range Unlicensed Communication,” in 23rd International Conference on Telecommunications, ICT 2016, Thessaloniki, Greece, May 16-18, 2016, 2016, pp. 1–6.
[8] J. Haxhibeqiri, F. V. D. Abeele, I. Moerman, and J. Hoebeke, “LoRa Scalability: A Simulation Model Based on Interference Measurements,” Sensors, vol. 17, no. 6, p. 1193, 2017.
[9] K. Mikhaylov, J. Petäjäjärvi, and T. Hänninen, “Analysis of capacity and scalability of the lora low power wide area network technology,” in European Wireless 2016; 22th European Wireless Conference, May 2016, pp. 1–6.
[10] M. Bor, J. Vidler, and U. Roedig, “Lora for the internet of things,” in Proceedings of the 2016 International Conference on Embedded Wireless Systems and Networks, ser. EWSN ’16. USA: Junction Publishing, 2016, pp. 361–366. [Online]. Available: http://dl.acm.org/citation.cfm?id=2893711.2893802
[11] C. Goursaud and J. M. Gorce, “Dedicated Networks for IoT: PHY/MAC State of the Art and Challenges,” EAI Endorsed Transactions on Internet of Things, vol. 15, no. 1, 10 2015.
[12] M. N. Ochoa, A. Guizar, M. Maman, and A. Duda, “Evaluating LoRa Energy Efficiency for Adaptive Networks: From Star to Mesh Topologies,” in 13th IEEE International Conference on Wireless and Mobile Computing, Networking and Communications, WiMob 2017, Rome, Italy, October 9-11, 2017, 2017, pp. 1–8.
[13] NS-3 Consortium, “NS-3 is a discrete-event network simulator,” 2017. [Online]. Available: {https://www.nsnam.org}
[14] L. Kleinrock and F. Tobagi, “Packet Switching in Radio Channels: Part I–Carrier Sense Multiple-Access Modes and Their Throughput-Delay Characteristics,” IEEE Transactions on Communications, vol. 23, no. 12, 1975.
[15] A. Berni and W. Gregg, “On the Utility of Chirp Modulation for Digital Signaling,” IEEE Trans. Commun., vol. 21, 1971.
[16] M. Knight, “An Open-Source Implementation of the LoRa CSS PHY,” 2016. [Online]. Available: {https://github.com/BastilleResearch/gr-lora} [17] J. Blum, “LoRa Modem with LimeSDRL,” 2016. [Online]. Available:
{https://github.com/myriadrf/LoRa-SDR}
[18] Semtech Corporation, “LoRaMac Node,” 2017. [Online]. Available: {https://github.com/Lora-net/LoRaMac-node}
[19] ——, “LoRa Gateway.” [Online]. Available: {http://www.semtech.com/ apps/product.php?pn=SX1272}
[20] ——, “Packet Forwarder,” 2017. [Online]. Available: {https://github. com/Lora-net/packet\_forwarder}
[21] N. Parrish, L. T. Tracy, S. Roy, P. Arabshahi, and W. L. J. Fox, “System design considerations for undersea networks: Link and multiple access protocols,” IEEE Journal on Selected Areas in Communications, vol. 26, no. 9, pp. 1720–1730, 2008. [Online]. Available: https://doi.org/10.1109/JSAC.2008.081211
[22] Electronic Communication Committee (ECC) within the European Con-ference of Postal and Telecommunications Administration (CEPT), “The analysis of the coexistence of FWA cells in the 3.4 - 3.8 GHz band,” tech. rep., ECC Report 33, 2003.
[23] H. Wu, S. Nabar, and R. Poovendran, “An Energy Framework for the Network Simulator 3 (NS-3),” in 4th International ICST Conference on Simulation Tools and Techniques, SIMUTools ’11, Barcelona, Spain, March 22 - 24, 2011, 2011, pp. 222–230.
[24] B. Martinez, M. Montón, I. Vilajosana, and J. D. Prades, “The Power of Models: Modeling Power Consumption for IoT Devices,” IEEE Sensors Journal, vol. 15, no. 10, pp. 5777–5789, 2015.
[25] L.-O. Varga, G. Romaniello, M. Vuˇcini´c, M. Favre, A. Banciu, R. Guizzetti, C. Planat, P. Urard, M. Heusse, F. Rousseau, O. Alphand, E. Dublé, and A. Duda, “GreenNet: an Energy Harvesting IP-enabled Wireless Sensor Network,” IEEE Internet of Things Journal, vol. 2, no. 5, pp. 412–426, 2015.
[26] C. Lau and C. Leung, “Capture Models for Model Packet Radio Networks,” IEEE Trans. Commun., vol. 40, pp. 917–925, 1992. [27] Semtech Corporation, “Semtech SX1272.” [Online]. Available: {http:
//www.semtech.com/apps/product.php?pn=SX1272}
[28] ——, “Low Energy Consumption Design for SX1272/3/6/7/8 LoRa Modem,” 2013. [Online]. Available: {https://www.semtech.com/uploads/ documents/LoraLowEnergyDesign_STD.pdf}