HAL Id: hal-01375645
https://hal.archives-ouvertes.fr/hal-01375645
Submitted on 3 Oct 2016
HAL is a multi-disciplinary open access
archive for the deposit and dissemination of
sci-entific research documents, whether they are
pub-lished or not. The documents may come from
teaching and research institutions in France or
abroad, or from public or private research centers.
L’archive ouverte pluridisciplinaire HAL, est
destinée au dépôt et à la diffusion de documents
scientifiques de niveau recherche, publiés ou non,
émanant des établissements d’enseignement et de
recherche français ou étrangers, des laboratoires
publics ou privés.
In Silico Experimental Evolution suggests a complex
intertwining of selection, robustness and drift in the
evolution of genetic networks complexity
Yoram Vadée-Le-Brun, Jonathan Rouzaud-Cornabas, Guillaume Beslon
To cite this version:
Yoram Vadée-Le-Brun, Jonathan Rouzaud-Cornabas, Guillaume Beslon. In Silico Experimental
Evo-lution suggests a complex intertwining of selection, robustness and drift in the evoEvo-lution of genetic
networks complexity. Artificial Life, Jul 2016, Cancun, Mexico. �hal-01375645�
In Silico Experimental Evolution suggests a complex intertwining of selection,
robustness and drift in the evolution of genetic networks complexity
Yoram Vad´ee-Le-Brun and Jonathan Rouzaud-Cornabas and Guillaume Beslon
Universit´ee de Lyon, CNRS, INRIA Beagle team, INSA-Lyon, LIRIS, UMR5205, F-69621, France
Abstract
Using the RAevol model we investigate whether the molecu-lar complexity of evolving organisms is linked to the “com-plexity” of their environment. Here, the complexity is consid-ered as the number of different states environments can have. Results strikingly show that the number of genes acquired by an organism during its evolution does not increase when the number of states of the environment increases but that the connectivity of their genetic regulation network actually does. On the opposite, we show that the mutation rate has an important influence on the gene content. We interpret these results as a complex intertwining of direct selective pressures (the more genes, the better the organisms can be) and robust-ness and drift thresholds that limit the maximum number of genes at different values depending on the mutation rates.
Introduction
Since the huge diversity in terms of genome size or num-ber of genes, even between prokaryotes, has been discovered two questions keep interesting the scientific community. On one hand, the origin of this diversity and on the other hand, whether genome size and number of genes scales with the apparent complexity of the organism.
This second question raised an interesting development. First, the tentative of linking genome size and apparent com-plexity for organisms was a total failure. This failure is known as the C-value paradox (Eddy, 2012). Then, the dis-covery of genes and non-coding DNA seemed to solve this paradox. It was proposed that it is the number of genes that scales with the apparent complexity of an organism. However, this tentative also failed leading to the “N-value paradox” (Claverie, 2001). Finally, the most recent notion of ”gene regulatory network” introduced an important com-plexification of the genotype-to-phenotype mapping, appar-ently resolving the N-value paradox. Indeed, the phenotypic complexity of an individual can be explained by the number of different states its gene regulatory network can have, as shown in (Lohaus et al., 2007). Moreover, further studies of prokaryotes regulation networks have shown that the num-ber of transcription factors scale quadratically with the total number of genes (Molina and van Nimwegen, 2009).
Strikingly, the question of the origins of the diversity of genome size and number of genes undergoes less develop-ment as it is generally assumed that the different complex-ity of the environment faced by an organism could account for the complexity of the genotype and of the regulation net-work. Indeed it is quite intuitive that the more environmental conditions an organism is likely to face, the more enzymes it needs and the more transcription factors it needs to regulate its metabolic activity (Maslov et al., 2009). This intuition is supported by experimental data where the classification of bacteria according to their lifestyle shows a correlation be-tween the variability of their environment and their number of genes (Parter et al., 2007).
However, a correlation is not a causal effect. In partic-ular, there are many other differences between these bacte-ria as their population size, mutation rate... In order to un-derstand the causality link between the environmental com-plexity and the genotypic comcom-plexity, one should search for organisms of similar biology, mutation rate and population size that have evolved in environments of various complex-ity, an almost impossible quest. An alternative is to use in
silicoexperimental evolution (ISEE) to address the question.
Indeed, ISEE allows to simulate long term evolution in per-fectly controlled environments with an artificial chemistry that, though abstract, is shared by all the lineages. In other words, using ISEE one can compare the fate of organisms that differ by only one single parameter, being the muta-tion rate, the populamuta-tion size or the complexity of the en-vironment they have to cope with to survive. For instance, (Bentkowski et al., 2015) developed a model of evolution to address this question. They simulated environments with different variability and observed that in more variable ronments organisms have more genes than in simpler envi-ronment. However, this model does not take into account for regulation (although a quadratic regulatory cost is assumed), leading to the direct necessity to have more genes if the en-vironment varies more or more frequently.
In this paper, we propose to address the question of the link between environmental complexity and number of genes (and more generally other indicator of complexity)
using the RAevol model (Beslon et al., 2010a,b). Indeed, this model is able to simulate rich environmental dynam-ics and uses individuals with explicit genome coding for a metabolism and for a gene regulatory network that can adapt in real time this metabolism to different environmen-tal conditions. In a preliminary study, RAevol has already been used to study the link between the mutation rate and the complexity of genomes and regulation networks: By evolving similar organisms with different mutation rates but a constant stable environment, we have been able to show that, at least in constant conditions, the mutation rate drives the complexity of the genome and the complexity of the reg-ulation network (Beslon et al., 2010b). In particular, we have shown that, even in a constant environment, lower mutation rates lead to a larger number of genes and to a quadratic in-crease of the number of transcription factors, strikingly re-producing many observations by acting on only one single parameter (Knibbe et al., 2011). Yet, this preliminary study did not allow to conclude on the link between environmental complexity and genotypic complexity as it was conducted in a constant environment.
In the experiments presented here we evolved organ-isms in different environmental conditions to be able to test whether an increase of environmental complexity effectively leads to an increase of genomic/transcriptomic complexity. As we already have shown that the mutation rate is likely to be an important factor, we explored simultaneously three different environmental complexity and four different muta-tion rates. For each combinamuta-tion of these two parameters, we evolved organisms for 300,000 generations and measured the size of their genotype and the complexity of their reg-ulation networks.
This paper is organized as follows: In the next section, we briefly present the RAevol platform. We then present our ex-perimental design followed by the results of the simulations and the discussion. Finally, we conclude and describe our future research directions.
The Aevol - RAevol platform
Aevol is an in silico experimental evolution platform (Hindr´e et al., 2012; Batut et al., 2013). It was designed to study how the evolutionary conditions shape the molec-ular structure of an evolving organism (e.g., DNA length, genes number, operonic structures...) due to direct and indi-rect selective pressures. In Aevol, a population of individ-uals evolves through a classical mutation-selection process. The specificity of Aevol lies in the genotype-to-phenotype mapping that finely models what is observed in bacteria. A circular double-stranded DNA sequence is transcribed into a set of mRNAs. These mRNAs are then parsed in search for Coding DNA Sequences (CDSs – the “genes”) that are trans-lated into proteins through an artificial genetic code. Finally, the proteins are combined to compute the individual’s phe-notype. We refer the reader to previously published work for
a complete description of the model and the results obtained so far (Knibbe et al., 2007, 2008; Parsons et al., 2010; Batut et al., 2013; Misevic et al., 2015).
RAevol is an extension of Aevol (Beslon et al., 2010a,b). It uses the same genome model and the same genetic code. However, in RAevol, proteins are able to act as transcription factors (TFs) beside their metabolic activity. When acting as a TF, a protein may up- or down-regulate the transcrip-tion of other genes, ultimately controlling the concentratranscrip-tion of the proteins encoded by these genes. In other words, in RAevol, each individual owns a genetic regulation network that may dynamically modify its phenotype depending on the environmental conditions. Importantly, in RAevol, the phenotype of an organism is no longer a static function (as it is in Aevol). Rather, it becomes a dynamic function that can be evaluated (by comparing it to a target function) at dif-ferent time steps during what can now be considered as the “life” of the individual. Technically, RAevol extends Aevol by adding a “transcriptional regulatory code”. In RAevol, the target phenotype may change during the life of the in-dividual, either deterministically or randomly (Figure 1). Moreover, specific proteins with no metabolic activity can be added into the individual in order to allow it to sense this variation in real time. The individual must (and can) dy-namically adapt to the current target by switching between different stable states of its regulation network. The final fitness of an individual is the mean value of its fitness mea-sured at each evaluation time step.
Experimental design
For this study, our starting point was the work done in our previous experiment with constant environments (Beslon et al., 2010b). In this previous work, population of 1000 or-ganisms were evolved for 15,000 generations in a constant environment under 6 different mutation rates ranging from
2.10−4to 5.10−6mut/bp/generation. We used a similar
ex-perimental design but adapted it to test evolution in variable environments. In particular we significantly increased the length of the evolution experiment. Since evolution is likely to be much more slower in variable environments than in constant ones, we let each simulation evolve for 300,000
generations. We tested 4 mutation rates (5.10−4, 1.10−4,
5.10−5and 5.10−6mut/bp/generation).
Another difference between both experiments is that we now use a fitness proportionate selection scheme instead of the exponential-rank-based selection process used in (Beslon et al., 2010b). The fitness proportionate selection scheme is more realistic from a biological point of view since it allows evolution to switch from directional selec-tion to purifying selecselec-tion. Finally, the maximum value for
the protein pleiotropy (wmax) has been increased from 0.03
to 0.05 to limit the number of genes and allow for faster computations (both changes reduces the maximum number of genes an organism can – or needs to – acquire during its
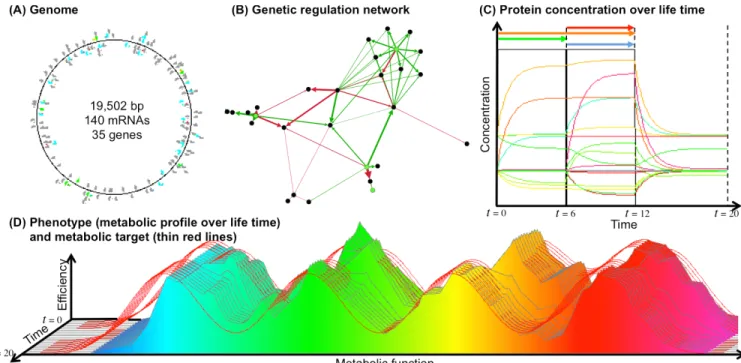
Figure 1: Example of an individual after 300,000 generations in the environment 16 (16 different conditions and 4 signals). (A) Genome, mRNAs and genes (colors code for the basal transcription rate. The small color dots are the genes). (B) Regulation network (arrows indicate links between genes and mRNAs; Red arrows are inhibiting links, green arrows are activating links. Black dots are the genes, green dots are the signaling proteins. (C) Protein concentrations during the life of the individual (colors indicate the function of the protein). The four signaling proteins are displayed above the graph. (D) Dynamic phenotype of the individual (same color code as panel C; thin red lines indicate the target at each time step). This individual evolved in the environment 16 (i.e. the four Gaussians can switch independently between their resting and their active states). Here the green Gaussians is active from t = 0 to t = 6; The orange Gaussian is active from t = 0 to t = 12 and the blue and red Gaussians are active from t = 7 to t = 12. From t = 13 to t = 20 all Gaussians are inactive. At each environmental change the regulation network (B) modifies the transcription levels, hence the protein concentrations (C), resulting in a phenotypic adaptation (D).
evolution).
Finally, in order to be able to compare the evolutionary outcome in different environments complexity, we carefully designed our dynamic environments. In a previous study with RAevol (Vad´ee-Le-Brun et al., 2015) we used an envi-ronment represented by 4 Gaussians which maximum values were changed randomly during the evolutionary process. We kept the same idea of having 4 Gaussians each one associ-ated to a signaling protein informing the individuals for its variation. However, the environmental conditions were cre-ated by moving the mean of the Gaussians along the x axis: The Gaussians all have the same height (0.3) and standard deviation (0.05). At their “resting state”, they are regularly spread along the x axis (m = 0.2, 0.4, 0.6 and 0.8). The constant environment is thus the same as in (Vad´ee-Le-Brun et al., 2015). But Gaussians are able to switch to an “active state” by increasing their mean value (m) of a small amount (0.05) and simultaneously sending a signaling protein to the individuals (Figure 1) such that it can trigger a change of the state of its regulation network. The lateral variation has been chosen instead of the vertical variation used so far because
it keeps the total area of each phenotypic target constant. In-deed, Aevol/RAevol are prone to a “filling artifact”: Since the maximum area of a gene is bounded, the larger the area of the phenotypic target, the higher the numbers of genes in-dividuals are likely to acquire. By using a lateral variation scheme, we kept the area of the target constant whatever the number of Gaussian that are in their “resting” or in their “ac-tive” state. Using this variation scheme and considering that the number of environmental conditions is a proxy for the environmental complexity, we are able to build a large vari-ety of environment which complexity varies between 1 to 16 states depending on which Gaussians are allowed to be in an active state and on possible coordination in the resting-active switch of the Gaussians. Here we tested three different com-plexity levels: 1 (actually a constant environment), 2 (only the Gaussian 3 is allowed to be in its active state) and 16 (all 4 Gaussians switch independently between their resting and active states). For all environments but the constant one, the switch between different targets happens with 10% chance at each time step. As individuals live for 20 time steps, on average each individual faces 2 switches of phenotypic
tar-● ● ● ● ● ● ● ● ● ● ● ● ● ● ● ● 0.01 0.02 0.05 0.10 5e−04 1e−04 5e−05 5e−06 Mutation Rate Distance to target ●1 2 16
Figure 2: Mean distance to target of the best individuals from the 4 seeds between 299,000 and 300,000 generations. Both axes are in log scale. The horizontal red dashed line is the distance to target of an individual having no gene.
get during its lifetime (note that the environmental variation is synchronized for all the individuals of the population) but this number can widely vary. We label each environment by its number of phenotypic targets.
Finally, all simulations were repeated four times with dif-ferent random drawing for each couple of environmental complexity and mutation rate leading to a total of 4×3×4 = 48 simulations. Note that four repetitions is not high enough to obtain statistically founded comparison between the dif-ferent situations but, given the structure of RAevol, we were not able to increase the number of repetitions as the amount of computational power requested to conduct the experi-ments started to become prohibitive1.
Results
Among the 48 simulations, 46 resulted in well-adapted indi-viduals that were able to properly fit the phenotypic target. The two simulations that “failed” are simulations with the highest mutation rate in the most complex environment. In this case, as Figure 2 shows it, the individuals were not able to reduce significantly the distance to the target. There ge-netic structure thus drifted eventually leading to too small genomes that can collapse to 0 genes.
Figure 3 shows the number of genes for each mutation rate and for each environmental complexity. It shows the same trend we observed previously (Beslon et al., 2010b): The number of genes increases as the mutation rate
de-1
48 simulations, 300,000 generations and 1000 individuals liv-ing for 20 time steps indeed leads to a total of 288 billions of time steps at each of which we need to compute the network dynamic and the resulting phenotype of an individual.
● ● ● ● ● ● ● ● ● ● ● ● ● ● ● ● 10 20 50 5e−04 1e−04 5e−05 5e−06 Mutation Rate CDS n umber ●12 16
Figure 3: Distribution of the number of genes of each simu-lation versus its mutation rate in log log scale. For each dot, the corresponding value is the mean value of genes number of the best individual between 299,000 and 300,000 gener-ations. For each environment a log log linear regression is plotted.
creases. However, the number of genes is lower than what was observed in (Beslon et al., 2010b), in particular under low mutation rates. This is likely to be due to the selection
scheme we use and to the larger value of wmax.
Interest-ingly, the evolution in complex environments (environment “16”, black squares) results in a similar linear trend (in log-log) but with a very different coefficient since the highest mutation rates lead to very low number of genes in this en-vironment. This confirms the previous observation that in complex environments organisms are not able to evolve ef-ficiently under high mutational pressure.
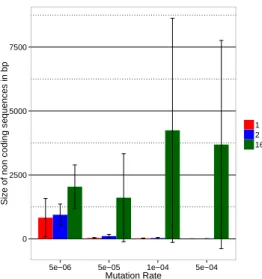
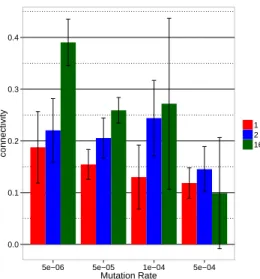
For a better readability, we plot all the following results in bar plots figure grouped by mutation rates. Figures 4 and 5 summarize the effect of the different parameter tested on the genomic structure. Figures 6 and 7 summarize their effect on the structure of the regulation network. Two opposite trends are visible in these figures. First, and quite surprisingly, the number of genes decreases when the variability of the en-vironment increases and this effect is much stronger for the most complex environment. Furthermore this effect tends to be enhanced for high mutation rates. Second, when look-ing at the size of the non-codlook-ing sequences (Figure 5), the mean connectivity of the network (Figure 6) and the mean link value (Figure 7) we see an opposite trend: complex en-vironments lead to longer non-coding sequences (when in simpler environments we only observe large non-coding
connectiv-0 10 20 30 40
5e−06 5e−05 1e−04 5e−04
Mutation Rate
CDS n
umber 12
16
Figure 4: Mean number of genes of best individuals from the 4 seeds between 299,000 and 300,000 generations for all mutation rates and environments. The error bars represent the standard deviation between seeds.
ity2and stronger links in the regulation network (except for
the highest mutation rate). Finally, a more complex trend is observed when looking at the size of the transcribed se-quences (Figure 8): As already shown in (Parsons et al., 2010), in “simple” environments, the higher the mutation rate, the longer the RNAs. However, for the complex en-vironments this trend is inverted and the RNAs tend to be smaller as the mutation rate increases.
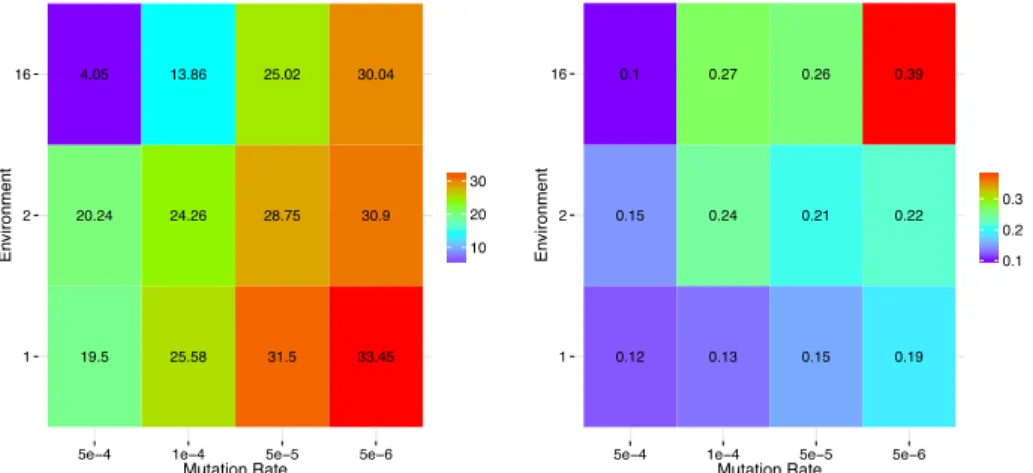
Figure 9 summarizes the two main trends observed in our experiments. It clearly shows a general tendency to com-plexity increases as the mutation rate decreases. Yet, the en-vironmental complexity acts in two opposite ways: It tends to decrease the number of genes (Figure 9, left panel) but to
increasethe network connectivity (Figure 9, right panel).
Discussion
So as a summary of these results: the variability of the envi-ronment tends to reduce the number of genes but increases the non-coding part of the genome. This effect increases with the mutation rate. On the contrary, it tends to increase the connectivity of the gene regulatory network and the in-tensity of the links and to decrease the size of mRNAs (when the gene regulatory network is efficient enough). Globally, individuals in a more variable environment evolve gene reg-ulatory networks that are smaller but more connected and with stronger links.
Such complex effects are likely to originate from the in-tertwining of multiple forces acting on genomic and
tran-2
Note that, in RAevol, the probability for a coding sequence to be a transcription factor is quite high. Thus a 0.1 connectivity should be considered as a neutral regulation.
0 2500 5000 7500
5e−06 5e−05 1e−04 5e−04
Mutation Rate
Siz
e of non coding sequences in bp
1 2 16
Figure 5: Mean size of non coding sequences in bp of best individuals from the 4 seeds between 299,000 and 300,000 generations for all mutation rates and environments. The error bars represent the standard deviation between seeds.
scriptomic complexity. Indeed, one can identify four main forces that either limit or increase the molecular complexity of the organisms:
Selective forces It is the most intuitive effect: The more complex the environment, the more genes are needed to fit the different environmental states and the more regula-tion is needed to switch between environmental states. Robustness thresholds Under high mutation rates, long
DNA molecules are impossible to transmit to the next generation hence limiting the maximum complexity of the genome. This effect is due to the classical error threshold that limit the length of the coding sequences (Eigen, 1971) and to a more recently identified threshold imposed on the total chromosome length by the rate of chromosomal re-arrangements (Knibbe et al., 2007; Fischer et al., 2014). Indirect selection for evolvability When evolving in
con-tinuously varying environments, selection can indirectly favor individuals that increase their rate of variation be-cause they are able to continuously produce mutants that may follow the environmental variations (Earl and Deem, 2004).
Drift barrier The level of selection may impose a barrier to the evolution of the genomic content: If the contribution of all new genes to the fitness is quasi-neutral given the level of selection, then the selective forces vanish, thus imposing a limit to the acquisition of new genes.
We suggest that the observed effects are a complex com-bination of these four forces. Indeed, as we already have
0.0 0.1 0.2 0.3 0.4
5e−06 5e−05 1e−04 5e−04
Mutation Rate
connectivity
1 2 16
Figure 6: Mean connectivity of the gene regulatory net-work of best individuals from the 4 seeds between 299,000 and 300,000 generations for all mutation rates and environ-ments. The error bars represent the standard deviation be-tween seeds.
shown it with RAevol in (Beslon et al., 2010b), the ro-bustness threshold imposes a severe limit to the size of the genomes and to the number of genes. This explains the gen-eral trend on the number of genes observed in Figures 3, 4 and 9. Indeed, being driven by the spontaneous mutation rate, as stated by Fischer et al. (2014), this effect is likely to be independent from the selection process, hence from the complexity of the environment. Now, as also state by Fischer et al. (2014), when the genome size is far from the threshold, selective forces can fully play their role. This is indeed the case when the mutation rate is low. Interestingly, in this situation, the regulation network appears to be more connected (Figures 6, 7 and 9) suggesting that under low enough mutation rates selective forces drive the complexity of the regulation network. However this complexity is only visible in terms of component connectivity but not in terms of component number (contrary to the number of genes, the connectivity can be increased without increasing the length of the genome). The combination of these two effects can also explain the trend observed on the length of the RNAs. Indeed, as the mutation rate increases the length of the RNAs increases. As the gene size is constant, the RNA size is an indicator of operon structures that allow for a more com-pact genome at the cost of less regulation possibility. Inter-estingly, in the more variable environment, the increase of mutation rate has no impact on the RNA size, suggesting a selection for a more active regulation.
The last two surprising results are the large increase of the size of the non-coding sequences under complex envi-ronments and of course the lower number of genes observed
0.0 0.1 0.2 0.3
5e−06 5e−05 1e−04 5e−04
Mutation Rate a v er age v alue of link 12 16
Figure 7: Mean intensity of links in the gene regulatory net-work of best individuals from the 4 seeds between 299,000 and 300,000 generations for all mutation rates and environ-ments. The error bars represent the standard deviation be-tween seeds.
in more complex environments. Although more speculative, we could propose two hypothesis to explain these results.
First, when the complexity of the environment and the mutation rate simultaneously increase, the selective force and the robustness threshold become more and more antag-onistic. Ultimately, as stated above, the robustness threshold imposes a severe limit to the complexity of the genotype, forbidding a regulation network to evolve. In highly variable environments the genomes ultimately collapse leading to a quick drop of the number of genes (Figure 4). In such a situ-ation, the sole option for the evolution is to increase the level of variability. Since the mutation rates are fixed in our sim-ulation, this can only be done by increasing the size of the non-coding sequences, hence increasing the dynamic of the gene repertoire. In conclusion, when the robustness thresh-old contradicts the selective forces, the response of evolution is an indirect selection for evolvability.
Second, we observe that the number of genes accumulated in environment 16 is always lower than what is observed in environment 2 but that the difference tends to decrease as the mutation rate decreases. We propose that, under low mutation rates, the complexity limit is no more imposed by robustness constraints but rather by the drift barrier: As the metabolic effect of a gene tends to decrease with the number of genes (as each gene will fill smaller and smaller gap be-tween the phenotype and the phenotypic target) there must be a upper limit to the number of genes the selection can act on (indeed, Figure 2 shows that the mean distance to target saturates when the mutation rate is decreased). But the drift barrier is likely to be more stringent in more
vari-0 100 200 300 400
5e−06 5e−05 1e−04 5e−04
Mutation Rate RNA siz e 1 2 16
Figure 8: Mean size of mRNAs in bp of best individuals from the 4 seeds between 299,000 and 300,000 generations for all mutation rates and environments. The error bars rep-resent the standard deviation between seeds.
able environments since the selection pressure on individual genes also depends on the fraction of time they are useful. In other words, the more variable the environment, the lower the selection pressure on the genes corresponding to the vari-able part of the phenotypic target the lower the number of genes the organisms can accumulate. To test this hypothesis we run simulations in environment 2 with a higher
selec-tion pressure for the two highest mutaselec-tion rates (5.10−5and
5.10−6). In these simulations, we used a selection
coeffi-cient of 2,000 instead of 750 with again 4 repetitions each. We indeed observed an increase of the genes number.
More-over, the gain was lower for the 5.10−5mutation rate (from
26 to 29 genes) than for the 5.10−6mutation rate (from 31 to
43 genes), supporting the hypothesis that for a 5.10−5
muta-tion rate the number of genes is limited by both the robust-ness threshold and the drift barrier but that, for a mutation rate of 5.10−6only the drift barrier is active.
Conclusion and perspectives
In this paper, we experimentally addressed the question of the impact of environmental variability on evolution (i.e., whether more variable environments imply more complex genomes and genes regulatory networks). To evaluate this question, we used an in-silico experimental evolution plat-form, RAevol, to test three environments of increasing vari-ability in four different mutation rates.
Our simulations confirm that the size of the gene reper-toire is bounded by the mutation rate and that this also lim-its the complexity of the gene regulatory network. They also show that environmental variability indeed increases the connectivity and the intensity of links of the gene
reg-ulatory network but decreases its size. Moreover, environ-mental variability increases the genome size by increasing the non-coding part of the genome of individuals who fail to regulate their phenotype according to environmental vari-ations. Finally, we discussed our results and proposed that the molecular complexity of an organism is a complex com-bination of direct selective pressure, indirect selective pres-sure for evolvability and robustness and drift thresholds.
The most striking results obtained here is that the gene content of our organisms does not follow the environment complexity. However this result is not so surprising if one realizes that complexity here is defined as ”variability”. In-deed, as G.E. Hutchinson (1957) stated, environments are complex objects composed of multiple factors (tempera-tures, light intensity, etc.). What we here defined as a more complex environment is not necessarily what evolution “per-ceives” as the highest complexity! Indeed, environmental features that don’t lead to selectable traits (because of drift or robustness constraints) are simply ignored by evolution. Since drift and robustness levels are dependent on the evo-lutionary conditions (population size, mutation rates...) one can then argue that the complexity of an environment de-pends on the organism that evolves in it! Clearly, in our simulations, the dynamic complexity of environment 16 is more complex than the one of environment 2 and, of course, 1. But on a more global point of view, the constant envi-ronment may be considered as more complex because the target function is more strongly selected. The genetic ele-ments managing the dynamic part of the phenotype are in-deed more numerous in environment 16 but the gene content is larger in constant environments.
The main limit of these results is the low number of pa-rameter tested and, the very low number of repetitions for each combination of parameters. We now need to validate statistically our results and hypothesis by running more rep-etitions and more scenarios: environments of intermediate complexity (4 and 8), lower mutation rates and higher se-lection strength. That objective has recently been taken a step further with the release of Aevol 5.0 that includes an optimized parallel version of the simulator.
Availability
Aevol is available under GPL license at the project website: http://www.aevol.fr. RAevol is currently in beta-version and is available upon request from the authors.
Acknowledgements
This research has been supported by EU-FET grant EvoEvo (ICT-610427).
References
Batut, B., Parsons, D. P., Fischer, S., Beslon, G., and Knibbe, C. (2013). In silico experimental evolution: a tool to test evolu-tionary scenarios. BMC Bioinformatics, 14 (S15):S11.
19.5 20.24 4.05 25.58 24.26 13.86 31.5 28.75 25.02 33.45 30.9 30.04 1 2 16
5e−4 1e−4 5e−5 5e−6
Mutation Rate En vironment 10 20 30 CDS number 0.12 0.15 0.1 0.13 0.24 0.27 0.15 0.21 0.26 0.19 0.22 0.39 1 2 16
5e−4 1e−4 5e−5 5e−6
Mutation Rate En vironment 0.1 0.2 0.3 connectivity
Figure 9: Left: Mean genes number for each environment and each mutation rate. Right: Mean connectivity for each environ-ment and each mutation rate. Both heatmaps show a general Left-to-Right increase of genomic and transcriptomic complexity. However, the gene number increases when the environmental complexity is decreased while the connectivity increases when the environmental complexity increases (at least for low mutation rates).
Bentkowski, P., Van Oosterhout, C., and Mock, T. (2015). A model of genome size evolution for prokaryotes in stable and fluctuating environments. Genome Biology and Evolution, 7(8):2344–2351.
Beslon, G., Parsons, D. P., Pe˜na, J.-M., Rigotti, C., and Sanchez-Dehesa, Y. (2010a). From digital genetics to knowledge dis-covery: Perspectives in genetic network understanding. In-telligent Data Analysis Journal, 14(2):173–191.
Beslon, G., Parsons, D. P., Sanchez-Dehesa, Y., Pe˜na, J.-M., and Knibbe, C. (2010b). Scaling laws in bacterial genomes: A side-effect of selection of mutational robustness. BioSystems, 102(1):32–40.
Claverie, J.-M. (2001). What if there are only 30,000 human genes? Science, 291(5507):1255–1257.
Earl, D. J. and Deem, M. W. (2004). Evolvability is a selectable trait. PNAS, 101(32):11531–11536.
Eddy, S. R. (2012). The c-value paradox, junk dna and encode. Current Biology, 22(21):R898 – R899.
Eigen, M. (1971). Self-organization of matter and the evolu-tion of biological macromolecules. Naturwissenschaften, 58(10):465–523.
Fischer, S., Bernard, S., Beslon, G., and Knibbe, C. (2014). A model for genome size evolution. Bulletin of Mathematical Biology, 76:2249–2291.
Hindr´e, T., Knibbe, C., Beslon, G., and Schneider, D. (2012). New insights into bacterial adaptation through in vivo and in sil-ico experimental evolution. Nature Reviews Microbiology, 10:352–365.
Hutchinson, G. E. (1957). Cold spring harbor symposium on quan-titative biology. Concluding remarks, 22:415–427.
Knibbe, C., Coulon, A., Mazet, O., Fayard, J.-M., and Beslon, G. (2007). A long-term evolutionary pressure on the amount of noncoding DNA. Molecular Biology and Evolution, 24(10):2344–2353.
Knibbe, C., Fayard, J.-M., and Beslon, G. (2008). The topology of the protein network influences the dynamics of gene order: From systems biology to a systemic understanding of evolu-tion. Artificial Life, 14(1):149–156.
Knibbe, C., Parsons, D. P., and Beslon, G. (2011). Parsimonious modeling of scaling laws in genomes and transcriptomes. In European Conference on Artificial Life (ECAL), pages 414– 415.
Lohaus, R., Geard, N. L., Wiles, J., and Azevedo, R. B. R. (2007). A generative bias towards average complexity in artificial cell lineages. Proceedings of the Royal Society of London B, 274(1619):1741–1751.
Maslov, S., Krishna, S., Pang, T. Y., and Sneppen, K. (2009). Tool-box model of evolution of prokaryotic metabolic networks and their regulation. PNAS, 106(24):9743–9748.
Misevic, D., Fr´enoy, A., Lindner, A. B., and Taddei, F. (2015). Shape matters: Lifecycle of cooperative patches promotes co-operation in bulky populations. Evolution, 69(3):788–802. Molina, N. and van Nimwegen, E. (2009). Scaling laws in
functional genome content across prokaryotic clades and lifestyles. Trends in Genetics, 25(6):243–247.
Parsons, D. P., Knibbe, C., and Beslon, G. (2010). Importance of the rearrangement rates on the organization of transcription. In Proceedings of Artificial Life XII, pages 479–486. Parter, M., Kashtan, N., and Alon, U. (2007). Environmental
vari-ability and modularity of bacterial metabolic networks. BMC Evolutionary Biology, 7(1):1–8.
Vad´ee-Le-Brun, Y., Rouzaud-Cornabas, J., and Beslon, G. (2015). Epigenetic inheritance speeds up evolution of artificial organ-isms. In European Conference on Artificial Life, pages 439– 446.