Modelling and analysis of protein aggregation - Competing pathways in prion (PrP) polymerisation
Texte intégral
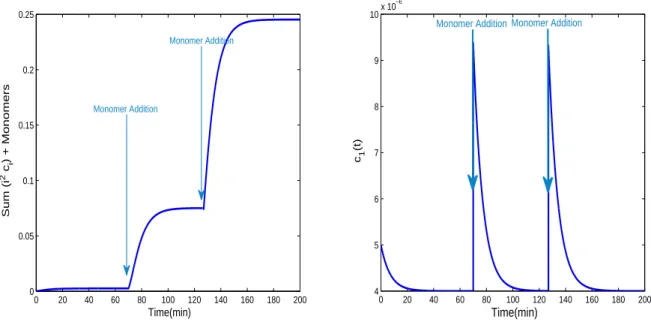
Figure


Documents relatifs
It is striking to see that even though most of the subgroups were not working, thereby undermining the subdivision or roles pushed by the model, most chicken producers are
These include the ‘true’ virulence genes (encoding viru- lence factors) as well as virulence-associated genes (regulat- ing the synthesis or activity of virulence factors)
To assess whether short-term compassion training would lead to increased positive and decreased negative affect during vicarious experiences, we performed a 2 × 2 × 2 repeated-
In the rest of the brain of infected mice, no increase in AChE mRNA levels was observed compared to controls (Figure 6b, right panel), and AChE protein and activity levels were
tein originally identified for its central role in prion diseases (also called transmissible spongiform encephalopathies), has recently been implicated in the pathogenesis of
Therefore, by investigating the language-independent and language-dependent characteristics of landmarks, the landmark detection algorithm can be easily adapted to speech analysis
The aim of this work is to localize and charectrize en- dometrial implants in MR data. Since the small implant is not visible in the MR data and both itself and its neigh-
Papaya ringspot virus resistance of transgenic Rainbow and SunUp is affected by gene dosage, plant development, and coat protein homology.. Paula Tennant 1 ,∗
