The MIT Faculty has made this article openly available.
Please share
how this access benefits you. Your story matters.
Citation
Sastry, Nishanth, Sollins, Karen, and Crowcroft, Jon (2009).
Delivery properties of human social networks. IEEE INFOCOM 2009
proceedings (Piscataway, N.J.: IEEE): 2586-2590. © 2009 IEEE
As Published
http://dx.doi.org/10.1109/INFCOM.2009.5062192
Publisher
Institute of Electrical and Electronics Engineers
Version
Final published version
Citable link
http://hdl.handle.net/1721.1/58850
Terms of Use
Article is made available in accordance with the publisher's
policy and may be subject to US copyright law. Please refer to the
publisher's site for terms of use.
Delivery Properties of Human Social Networks
Nishanth Sastry
University of CambridgeKaren Sollins
MITJon Crowcroft
University of CambridgeAbstract—The recently proposed Pocket Switched Network paradigm takes advantage of human social contacts to oppor-tunistically create data paths over time. Our goal is to examine the effect of the human contact process on data delivery. We find that the contact occurrence distribution is highly uneven: contacts between a few node-pairs occur too frequently, leading to inadequate mixing in the network, while the majority of contacts are rare, and essential for connectivity. This distribution of contacts leads to a significant variation in performance over short time windows. We discover that the formation of a large clique core during the window is correlated with the fraction of data delivered, as well as the speed of delivery. We then show that the clustering co-efficient of the contact graph over a time window is a good predictor of performance during the window. Taken together, our findings suggest new directions for designing forwarding algorithms in ad-hoc or delay-tolerant networking schemes using humans as data mules.
I. INTRODUCTION
The Pocket Switched Network (PSN) paradigm was recently proposed [10] as a means of ferrying data using human social contacts. At its core is the idea that as the storage capacities of mobile devices increase, and support for bluetooth and other short-range data transfer protocols becomes more prevalent, we could use these devices to construct data paths in a store-carry-forward fashion: Various intermediate nodes store the data on behalf of the sender and carry it to another contact opportunity where they forward the data to the destination or another node that can take the data closer to the destination.
A typical contact opportunity where data hops from one node to another happens when two mobile devices are in range of each other, usually when the humans carrying the devices meet in a social situation. Thus, the path from source to destination is constructed over time and consists of a chain of intermediate nodes that altruistically carry the sender’s data at various times before the destination gets it.
Designing for, and exploiting human mobility in this manner becomes important in situations where networking infrastruc-ture has been damaged (e.g. after a disaster), or does not exist (e.g. in remote areas and in some developing countries). By the same token, some applications, such as email, database synchronization and certain types of event notifications, are in-herently asynchronous and can tolerate relatively long delays. Mobility can be exploited to provide multiuser diversity gains for such applications [8]. New applications, such as exchang-ing music and media files over an ad-hoc collocated peer-to-peer network, are being proposed [14] to take advantage of short-range connectivity between mobile devices.
At an abstract level, the PSN of N nodes can be thought of as a temporally evolving undirected contact graph withN vertices. At any given instant, very few edges exist. Paths are created over time, with each contact corresponding to a new (momentary) edge in the graph. Edges appear and disappear according to some underlying stochastic process that corresponds to the social contacts. The sequences of edges (contacts) that occur constitutes a trace of the PSN.
Any route selection strategy constructs a path by sampling the edges that appear. Its performance depends upon the match between the route selection strategy and the rules governing the occurrences of contacts. If the route selection strategy is to flood data at every contact opportunity, we will always discover the quickest possible path. However, the costs of flooding are unacceptably high. In this work, we attempt to investigate the properties of this contact generation process.
We find that contact occurrences exhibit a unique power-law distribution: An edge randomly chosen from the N (N − 1)/2 possible edges in the PSN’s graph is much more likely to be a rare contact in the trace than a frequently occurring contact; a rare contact could occur fewer than ten times in the trace, whereas a frequent contact could occur hundreds of times. The PSN’s connectivity depends crucially on the rare contacts. On the other hand, frequent contacts often occur without there being new data to exchange, even when data is being flooded. This inadequate mixing of contacts greatly increases the number of contacts required to deliver data.
Although it would appear from this macroscopic picture that PSNs are largely inefficient, we find that over time windows of small duration, there is a significant variation in performance. We discover that in time windows in which a large fraction of data gets delivered, rather than all nodes being able to uniformly reach each other with the same efficiency, there is usually a huge clique of nodes that have 100% reachability between themselves. Furthermore, data is delivered faster when both the sender and destination are clique members. We show how to identify such time windows by computing a clustering co-efficient on the contact graph.
The rest of the paper is structured as follows: Section II develops the simulation methodology used. The effect of the contact occurrence distribution and the order of contact occurrences on data deliveries is presented in Section III. In Section IV, we show how to identify and exploit periods of good connectivity. Section V discusses related work in the area and section VI concludes.
II. SETUP ANDMETHODOLOGY
We imagine the participants of a PSN would be a finite group of people who are at least loosely bound together by some context – for instance, first responders at a disaster situ-ation, who need to send emails to each other. Multiple PSNs could co-exist for different contexts, and a single individual could conceivably participate in several different PSNs1.
Our model that PSN participants form a cohesive group places the requirement that an ideal PSN should be able to create paths between arbitrary source-destination pairs. This is reflected in our simulation setup, where the destinations for each source node are chosen randomly. Also, our traces are picked to be close to the limits of Dunbar’s number (=147.8, 95% confidence limits: 100.2–231.1), the average size for cohesive groups of humans [5].
Traces: The first trace consists of bluetooth contacts recorded from 1 Nov. 2004 to 1 Jan. 2005 between par-ticipants of the MIT Reality Mining project [6]. Because we wish to measure contact opportunities for data transfer, we conservatively discarded contacts lasting less than five minutes. This trace has contacts between N = 91 subjects. The second trace comes from a four week subset of the UCSD Wireless Topology Discovery [15] project which recorded Wi-Fi Access Points seen by subjects’ PDAs. We treat PDAs simultaneously in range of the same Wi-Fi access point as a contact opportunity. This data has N = 202 subjects.
The subjects in the MIT trace consist of a mixture of students and faculty at the MIT Media Lab, and incoming freshmen at the MIT Sloan Business School. The UCSD trace is comprised of a select group of freshmen, all from UCSD’s Sixth College. As such, we can expect subjects in both traces to have reasons for some amount of interaction, leading to a loosely cohesive group structure. Prior work on community mining using the same traces supports this [18].
Simulation setup and workload: At the beginning of simulation, data is created, marked for a randomly chosen destination, and associated with the source node. An oracle with complete knowledge of the future can choose to transfer data at appropriate contact opportunities and thereby form the quickest path to the destination. To simulate this, we exhaustively enumerate all possible paths by flooding data at each contact opportunity, and choose the quickest.
Performance measure: Consider the time-ordered se-quence (with ties broken arbitrarily) of contacts that occur globally in the network. Since there are N (N − 1) quickest paths between different sender-destination pairs, a maximum2
ofN (N −1) contacts in the the global sequence of contacts act as path completion points. Of these,N d become “interesting” when there ared destinations per sender. Since the destinations are chosen randomly, we might expect that on average, if k 1Note that this is in contrast to a single unboundedly large network of
socially unrelated individuals as in the famous “small-world” experiment [16] that examined reachability in a network essentially comprising all Americans and discovered an average 5.2 (≈ 6) degrees of separation.
2The actual number could be lesser because a contact with a particularly
rare node could complete multiple paths that end in that node.
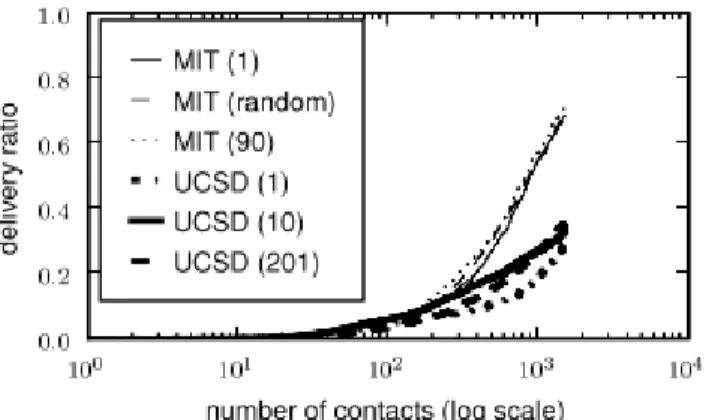
Fig. 1. Fraction of data delivered as a function of the number of contacts, for the MIT and UCSD traces (number of destinations per sender shown in brackets). The curves for each network are clustered together, showing that the delivery ratio evolves independently of the load.
path completion points have occured, the fraction of these that are interesting is independent of d: When d is greater, more data gets delivered afterk path completion points, but there is also more data to deliver.
The above discussion motivates our method of measuring the efficiency of the PSN: At any point in the simulation, the delivery ratio, measured as the fraction of data that has been delivered, or equivalently, the number of “interesting” path completion points we have seen, is taken as a figure of merit. The more efficient the PSN is, the faster this ratio evolves to 1, as the number of contacts and time increase.
Unless otherwise specified, our experiments examine deliv-ery ratio evolution statistically averaged over 10 independent runs, with each run starting at a random point in the trace, and lasting for 6000 contacts. We confirm our intuition in Fig 1, which shows that the delivery ratio evolves similarly, whether d is 1 or a maximum of N − 1 destinations per sender.
III. DELIVERYPROPERTIES OF THEPSN
A PSN contact trace is determined by the distribution of contact occurrences and the time order in which these contacts occur. In this section, we examine how these properties affect delivery ratio evolution. Our approach is to create a synthetic trace from the original trace by disrupting the property we wish to study. Comparing delivery ratio evolution in the original and synthetic traces informs us about the effects of the property.
Our main findings are that in both the traces we examine, time correlations between contacts that occur too frequently leads to wasted contacts, and that the progress of the delivery ratio as well as the connectivity of the PSN itself are precar-iously dependent on rare contacts.
A. Frequent contacts are inadequately mixed
To investigate the effect of the time order in which contacts occur, we replay the trace, randomly shuffling the time order in which links occur. Observe that the delivery ratio increases much faster (Fig 2, the curve marked “shuffled” evolves faster
2587
Fig. 2. Delivery ratio evolution for synthetically derived variants of MIT (left), UCSD (right) traces. ’trace’ is the original. ’Shuffled’, the same trace with time order of contacts randomly shuffled. ’Effective’ replays ’trace’, counting only contacts where data was exchanged. ’link distr’ is an artificial trace with the same size and contact occurrence distribution as the original.
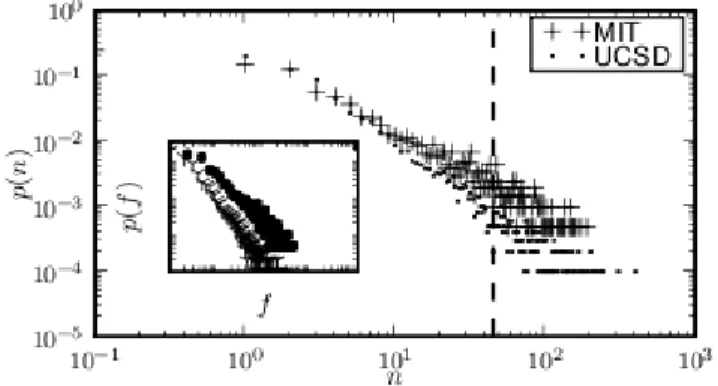
Fig. 3. Contact occurrence distributions (log-log): A random edge appears
n times with probability p(n). To the left of the dashed line at n = 45, the
distributions for both traces coincidentally happen to be similar. The inset shows the difference when normalised by the number of edges. Inset: A random edge constitutes a fractionf of the trace with probability p(f).
than “trace”). The random shuffle has the effect of removing any time correlations of contacts in the original trace. Thus the improved delivery ratio evolution implies that time correlations of the contacts in the original data slowed down the mixing of data among the nodes, causing them to be delivered later.
Manual examination reveals several time correlated contacts where two nodes see each other multiple times without seeing other nodes. At their first contact, one or both nodes could have data that the other does not, which is then shared by flooding. After this initial flooding, both nodes contain the same data – subsequent contacts are “non-effective”, and only increase the number of contacts happening in the network without increasing the delivery ratio.
To quantify the impact, in the curve marked “effective” on Fig 2, we plot delivery ratio evolution in the original trace, counting only the contacts in which data could be exchanged. This coincides well with the time-shuffled trace, showing that non-effective contacts are largely responsible for the slower delivery ratio evolution in the original trace.
Next, we construct a synthetic trace that has the same number of nodes as the original trace, as well as the same contact occurrence distribution. By this, we mean that the probability of contact between any pair of nodes is the same as in the original trace. The delivery ratio evolution of this trace, depicted as “link distr” in Fig 2, is seen to evolve in a similar fashion as the time-shuffled MIT trace. This indicates
(a) Robustness to cutoff: MIT (below), UCSD (above). Max cutoff specifies a maximum cutoff for the frequency of contacts, thus removing the most frequently occurring ones. Min cutoff specifies a minimum frequency of contacts – removing the rarest contacts causes the number of nodes that are connected to drop precipitously.
(b) Evolution of delivery ratio with contacts that occur more than cutoff times removed. MIT (left), UCSD (right). The network still remains connected, and manages to deliver data with slightly fewer contacts.
Fig. 4. Relative importance of rare and frequent contacts
that once time correlations are removed, the delivery properties are determined mainly by the contact occurrence distribution. B. Connectivity depends on rare contacts
The fact that three different traces (shuffled, effective, and link distr), which are based on the same contact occurrence distribution, essentially evolve in the same manner leads us to examine this distribution further. Fig 3 shows the distribution: A random contact in the trace is much more likely to be a rare one than a frequently occurring contact; a rare contact could occur fewer than ten times in the trace, whereas a frequent contact could occur hundreds of times.
Fig 4(a) shows that the rare contacts are extremely important for the nodes to stay connected. When contacts that occur fewer than a minimum cutoff number of times are removed, the number of nodes remaining in the trace falls sharply. This implies that there are a number of nodes which are connected to the rest of the nodes by only a few rare contacts.
On the other hand, removing the most frequently occurring edges (by specifying a maximum cutoff frequency for contact occurrences) does not affect connectivity greatly. For instance, the MIT trace remains connected as long as contacts that occur 10 or more times in the trace are retained. This suggests that nodes which contact each other very frequently are also connected by other paths, comprising only rare edges.
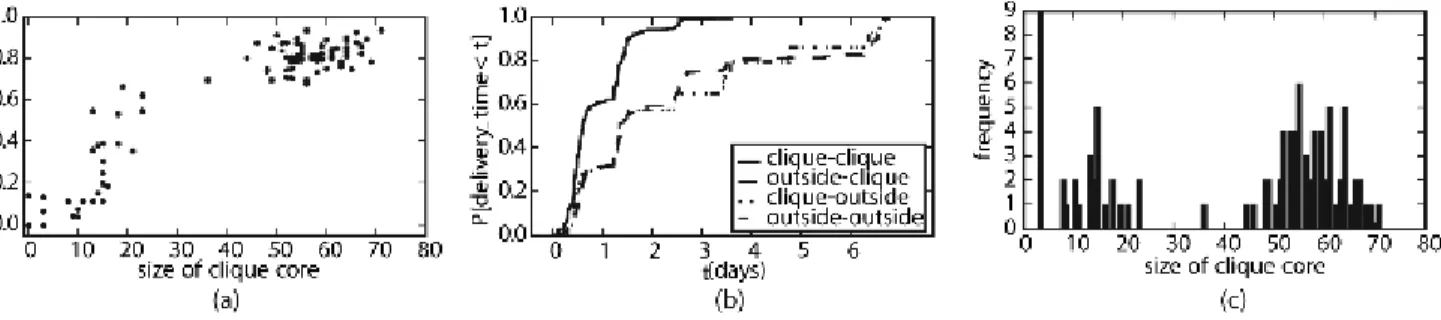
Fig. 5. Reachability graph cliques: (a) Delivery ratio in the contact graph correlates with size of max clique in the reachability graph over the time window. (b) CDFs of delivery times for all data delivered in a one week time window when the clique size was 65. The four categories shown are different combinations of sender-receiver pairs when the source (or destination) is inside (or outside) the clique. clique-clique transfers are faster than other combinations. (c) The size of the maximum clique observed in the reachability graph during one-week time windows seems to be bimodally distributed.
Interestingly, Fig 4(b) shows that with the most frequent edges removed, achieving a given delivery ratio can take slightly fewer contacts. This appears paradoxical but can be explained as follows: In terms of time, data delayed waiting for the occurrence of a rare contact still takes the same amount of time to reach their destination, and data previously sent on paths containing more frequent edges alone is delayed, because it now has to be re-routed over rare contacts. However, the reliance on rare contacts allows “batch-processing”: Each node involved in the rare contact has more data to exchange when the contact happens, thus decreasing the overall count of contacts taken to achieve a given delivery ratio.
IV. EXPLOITING PERIODS OF GOOD CONNECTIVITY
The previous section showed that at a macroscopic level, a PSN is a challenged network, with connectivity crucially dependent on rare contacts, and frequent contacts non-effective for data transfer. In this section, we zoom in on small time windows and find that within windows of the same duration, there is a huge variation in performance, with some achieving a very high delivery ratio and others not. We observe the occurrence of large cliques in successful time windows and suggest a way to exploit this. Due to lack of space, we only present results from the MIT trace in this section.
A. Large cliques correlate with good connectivity
Over fixed time windows, the temporal contact graph of the PSN can be viewed as constructing a static reachability graph where a directed edge is drawn from nodes to t if the sender s can transfer data to destination t during that window. The reachability graph is constructed by flooding data during the window between every possible source-destination pair. We examine this graph for clues about successful time windows which achieve high delivery ratios.
Fig 5 (a) shows that a high delivery ratio is strongly correlated with large cliques in the reachability graph. While we expect delivery ratio to be high when the reachability graph has a large clique (implying that there is complete connectivity between large fraction of nodes), it is unexpected that the converse is true, viz. whenever the delivery ratio is high, there is a large clique in the reachability graph.
Fig 5 (b) looks at the quality of the paths between nodes in the clique, outside the clique, as well as the paths that go from source nodes in the clique to destinations outside it, and vice-versa. Plotting the cumulative distribution functions of the delivery times of the quickest paths for each category shows that data is transferred faster when both the sender and receiver are members of the large clique.
Thus, during time intervals when there is a giant clique in the reachability graph, the PSN is very successful for a large subset of nodes. However, the membership of the clique, as well as its size (see Fig 5 (c)) exhibit a large variation. B. Clustering co-efficient correlates with high delivery ratio
The clique occurs in the reachability graph, and cannot be easily detected without flooding all paths and performing extensive computation. We now show that the cliquishness of the contact graph can serve as an approximation.
Suppose a vertexv has neighbours N (v), with |N (v)| = kv. At most kv(kv − 1)/2 edges can exist between them (this
occurs when v is part of a kv-clique). The clustering
co-efficient [17] of the vertex,Cv, is defined as the fraction of
these edges that actually exist. The clustering co-efficient of the graph is defined as the average clustering co-efficient of all the vertices in the graph. In friendship networks,Cv measures
the extent to which friends ofv are friends of each other, and hence, approximates the cliquishness of the graph.
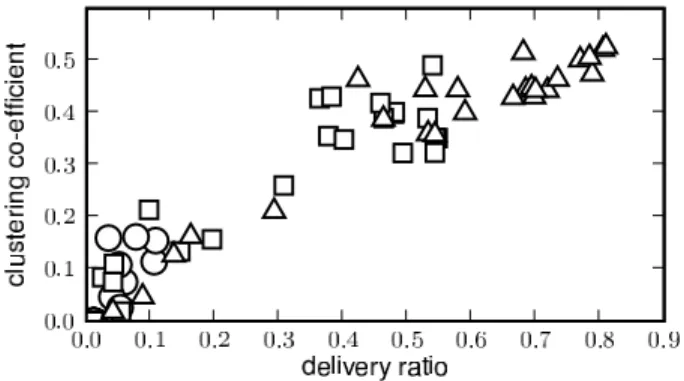
Fig 6 shows that the average clustering co-efficient of the contact graph correlates well with the delivery ratio achieved during time windows of various sizes in the MIT data trace C. Implications
Taken together, this set of findings implies that algorithms to predict the presence of large clique situations can be useful. One strategy is to employ humans in the loop. Cliques that represent a large meeting occurring in the near future can easily be predicted by the clique’s members. Such information could potentially also be deduced from calendars on the nodes’ mobile devices.
An alternate strategy is to force “artificial” contacts to im-prove delivery ratio. Notice that two cliques in the reachability graph can be merged by arranging for relatively few contacts
2589
Fig. 6. Scatter plot showing the correlation between delivery ratio during random time windows of different sizes and cluster co-efficient of the contact graph for that time window. squares, circles and triangles represent windows of one-hour, one-day and 3 days, respectively.
between members of the cliques during the time window being considered. Also, if there are subsets of nodes that form small cliques in consecutive time windows of size t, then by arranging for one representative from each clique to meet at the end of the first window, we can merge all the small cliques into a bigger one over a time window of size2t. Such rendezvous can also be accomplished using stationary nodes such as throwboxes [19] placed at strategic locations common to members of both the small cliques. We suggest that heuristics that focus on joining smaller cliques or single nodes to a giant clique would be one way to improve the delivery capabilities of PSNs.
V. RELATEDWORK
Conceptually, PSNs are Delay-Tolerant Networks [7], and generic results from that framework apply. For instance, a forwarding algorithm that has more knowledge about contacts is likely to be more successful [11], and the best performance is achieved by an oracle with knowledge of future contacts.
Nevertheless, the fact that our underlying network is made up of human contacts and is less predictable has a large impact: For instance, reasonably predictable traffic patterns of buses allow a distributed computation of route metrics for packets in vehicular DTNs [1], [11]. Similarly, fixed bus routes allow the use of throwboxes [19] to reliably transfer data between nodes that visit the same location, but at different times.
The variability of PSNs has naturally led to a statistical approach: The inter-contact time distribution of human social contacts has been used to model transmission delay between a randomly chosen source-destination pair [3], [12]. In this work, we take a more macroscopic view and look at the ability of the PSN to simultaneously deliver data between multiple source-destination pairs. This leads us to look at the distribution of the number of contacts between randomly chosen source-destination pairs, and find that this distribution is not only crucial for global data delivery performance, but also for the connectivity of the PSN itself.
Others have proposed routing using various ad-hoc metrics, such as betweenness centrality [4], history of previous meet-ings [13], and inferred community structure [9]. Computing
such metrics can be costly and the computation can be inaccurate due to the high variability inherent in PSNs. Our results point to simpler techniques that could exploit time windows of good connectivity.
We mention in passing that our finding of large cliques in the reachability graphs is loosely analogous to the giant strongly connected component in the WWW graph that ac-counts for most of its short paths [2]
VI. CONCLUSION
We looked at delivery properties of a pocket switched network. The PSN is determined by its contact occurrence distribution and their order of occurrence. The contact occur-rence distribution exhibits an interesting power law of many contacts occurring rarely, and a few occurring very frequently. At a macroscopic level, this presents a bleak picture for the delivery of packets in a PSN: The connectivity of the PSN is crucially dependent on rare contacts occurring, and inadequate mixing due to repeated occurrences of frequent contacts delays deliveries. However, we also find that there is huge variation at smaller time windows, and we exploit these to find indicators for time intervals that have successful deliveries.
REFERENCES
[1] BALASUBRAMANIAN, A., LEVINE, B. N.,ANDVENKATARAMANI, A. DTN Routing as a Resource Allocation Problem. In SIGCOMM (2007). [2] BRODER, A.,ET AL. Graph structure in the web. Computer Networks
33, 1-6 (2000), 309–320.
[3] CHAINTREAU, A.,ET AL. Impact of human mobility on opportunistic forwarding algorithms. IEEE Trans. Mobile Computing 6, 6 (June 2007), 606–620.
[4] DALY, E.,ANDHAAHR, M. Social network analysis for routing in disconnected delay-tolerant manets. In MobiHoc (2007).
[5] DUNBAR, R. I. M. Co-evolution of neocortex size, group size and language in humans. Behavioral and Brain Sciences 16 (1993). [6] EAGLE, N.,ANDPENTLAND, A. CRAWDAD data set mit/reality (v.
2005-07-01).
[7] FALL, K. A delay-tolerant network architecture for challenged internets. In ”SIGCOMM” (2003).
[8] GROSSGLAUSER, M.,AND TSE, D. N. C. Mobility increases the capacity of ad hoc wireless networks. IEEE/ACM Trans. Netw. 10, 4 (2002), 477–486.
[9] HUI, P., CROWCROFT, J.,ANDYONEKI, E. Bubble rap: Social-based forwarding in delay tolerant networks. In MobiHoc (2008).
[10] HUI, P., ET AL. Pocket switched networks and the consequences of human mobility in conference environments. In Proc. of ACM
SIGCOMM first workshop on delay tolerant networking and related topics (2005).
[11] JAIN, S., FALL, K.,ANDPATRA, R. Routing in a delay tolerant network.
”SIGCOMM Comput. Commun. Rev.” 34, 4 (2004), 145–158.
[12] KARAGIANNIS, T., LEBOUDEC, J.-Y.,ANDVOJNOVIC, M. Power law and exponential decay of inter contact times between mobile devices. In MOBICOM (2007).
[13] LINDGREN, A., DORIA, A.,ANDSCHELEN, O. Probabilistic routing in intermittently connected networks. In Proc. SAPIR Workshop (2004). [14] MCNAMARA, L., MASCOLO, C.,ANDCAPRA, L. Media Sharing based
on Colocation Prediction in Urban Transport. In MOBICOM (2008). [15] MCNETT, M. Wireless topology discovery. http://sysnet.ucsd.edu/wtd/. [16] TRAVERS, J.,ANDMILGRAM, S. An experimental study of the small
world problem. Sociometry 32, 4 (1969), 425–443.
[17] WATTS, D. J.,ANDSTROGATZ, S. H. Collective dynamics of ’small-world’ networks. Nature 393, 6684 (June 1998), 440–442.
[18] YONEKI, E., HUI, P.,ANDCROWCROFT, J. Visualizing community detection in opportunistic networks. In Proc. of the second ACM
workshop on Challenged networks (CHANTS) (2007).
[19] ZHAO, W.,ET AL. Capacity Enhancement using Throwboxes in DTNs. In Proc. IEEE Intl Conf on Mobile Ad hoc and Sensor Systems (2006).