RESEARCH OUTPUTS / RÉSULTATS DE RECHERCHE
Author(s) - Auteur(s) :
Publication date - Date de publication :
Permanent link - Permalien :
Rights / License - Licence de droit d’auteur :
Bibliothèque Universitaire Moretus Plantin
Dépôt Institutionnel - Portail de la Recherche
researchportal.unamur.be
University of Namur
M1 and M2 macrophages derived from THP-1 cells differentially modulate the response
of cancer cells to etoposide
Genin, Marie; Clement, Francois; Fattaccioli, Antoine; Raes, Martine; Michiels, Carine
Published in: BMC Cancer DOI: 10.1186/s12885-015-1546-9 Publication date: 2015 Document Version
Early version, also known as pre-print Link to publication
Citation for pulished version (HARVARD):
Genin, M, Clement, F, Fattaccioli, A, Raes, M & Michiels, C 2015, 'M1 and M2 macrophages derived from THP-1 cells differentially modulate the response of cancer cells to etoposide', BMC Cancer, vol. 15, no. 1, 577.
https://doi.org/10.1186/s12885-015-1546-9
General rights
Copyright and moral rights for the publications made accessible in the public portal are retained by the authors and/or other copyright owners and it is a condition of accessing publications that users recognise and abide by the legal requirements associated with these rights. • Users may download and print one copy of any publication from the public portal for the purpose of private study or research. • You may not further distribute the material or use it for any profit-making activity or commercial gain
• You may freely distribute the URL identifying the publication in the public portal ?
Take down policy
If you believe that this document breaches copyright please contact us providing details, and we will remove access to the work immediately and investigate your claim.
R E S E A R C H A R T I C L E
Open Access
M1 and M2 macrophages derived from
THP-1 cells differentially modulate the
response of cancer cells to etoposide
Marie Genin
1, Francois Clement
1, Antoine Fattaccioli
1, Martine Raes
1and Carine Michiels
2*Abstract
Background: Tumor associated macrophages (TAMs) are present in high density in solid tumors. TAMs share many characteristics with alternatively activated macrophages, also called M2. They have been shown to favor tumor development and a role in chemoresistance has also been suggested. Here, we investigated the effects of M2 in comparison to M1 macrophages on cancer cell sensitivity to etoposide.
Methods: We set up a model of macrophage polarization, starting from THP-1 monocytes differentiated into macrophages using PMA (Phorbol 12-myristate 13-acetate). Once differentiated (M0 macrophages), they were incubated with IL-4 and IL-13 in order to obtain M2 polarized macrophages or with IFN-gamma and LPS for classical macrophage activation (M1). To mimic the communication between cancer cells and TAMs, M0, M1 or M2 macrophages and HepG2 or A549 cancer cells were co-cultured during respectively 16 (HepG2) or 24 (A549) hours, before etoposide exposure for 24 (HepG2) or 16 (A549) hours. After the incubation, the impact of etoposide on macrophage polarization was studied and cancer cell apoptosis was assessed by western-blot for cleaved caspase-3 and cleaved PARP-1 protein, caspase activity assay and FACS analysis of Annexin V and PI staining.
Results: mRNA and protein expression of M1 and M2 markers confirmed the polarization of THP-1-derived macrophages, which provide a new, easy and well-characterized model of polarized human macrophages. Etoposide-induced cancer cell apoptosis was markedly reduced in the presence of THP-1 M2 macrophages, while apoptosis was increased in cells co-cultured with M1 macrophages. On the other hand, etoposide did not influence M1 or M2 polarization.
Conclusions: These results evidence for the first time a clear protective effect of M2 on the contrary to M1 macrophages on etoposide-induced cancer cell apoptosis.
Keywords: THP-1, Macrophage polarization, Cancer cells, Co-culture, Apoptosis Background
Macrophages constitute a heterogeneous population of myeloid cells of the innate immune system involved in several processes in physiological as well as in pathological conditions. They are particularly active in inflammation and infection. Under such conditions, blood monocytes are recruited into the tissue where they differentiate into macrophages [1]. Macrophages display a high plasticity, which allows them to adapt their phenotype in response
to different environmental stimuli [2]. Two major polarization states have been described for macrophages, the classically activated type 1 (M1) and the alternatively activated type 2 (M2). In 2002, Mantovani et al. [3] de-scribed these two macrophage phenotypes as extremes of a continuum of functional states. Classical activation of macrophages occurs following injury or infection. Macro-phages are classically activated in vitro using bacterial cell wall components (such as LPS) and IFN-γ or TNF-α. M1 macrophages are characterized by the production of pro-inflammatory cytokines like TNF-α, IL-1β, IL-6 and IL-12. They also produce high levels of reactive oxygen and nitrogen species [4]. However, the expression of iNOS, * Correspondence:[email protected]
2
Laboratory of Biochemistry and Cellular Biology, NARILIS, University of Namur, 61 rue de Bruxelles, 5000 Namur, Belgium
Full list of author information is available at the end of the article
© 2015 Genin et al.Open Access This article is distributed under the terms of the Creative Commons Attribution 4.0 International License (http://creativecommons.org/licenses/by/4.0/), which permits unrestricted use, distribution, and reproduction in any medium, provided you give appropriate credit to the original author(s) and the source, provide a link to the Creative Commons license, and indicate if changes were made. The Creative Commons Public Domain Dedication waiver (http://creativecommons.org/publicdomain/zero/1.0/) applies to the data made available in this article, unless otherwise stated.
the enzyme responsible for NO production by M1 macrophages, is specific to murine macrophages and is absent in human macrophages [5]. M2 macrophage polarization can be induced by different stimuli: IL-4 and/ or IL-13, immune complexes and toll-like receptor, IL-1 receptor ligands or IL-10 [6]. Alternatively activated mac-rophages polarized by IL-4 and IL-13 are characterized by a limited production of pro-inflammatory cytokines, but they secrete anti-inflammatory cytokines like IL-10, CCL18 and CCL22. They are also characterized by the ex-pression of several receptors like the mannose receptor CD206 (or MRC1), the scavenging receptor CD163, dectin-1 and DC-SIGN (Dendritic cell-specific intercellu-lar adhesion molecule-3-grabbing non-integrin) [7, 8].
Solid tumors comprise not only malignant cells but also stromal host cells such as adipocytes, fibroblasts and hematopoietic cells, which are recruited from the blood vessels. Among these tumor infiltrated immune cells, macrophages are the most abundant, called tumor associated macrophages (TAMs) [9]. Many studies have shown that in malignant tumors, macrophages predom-inantly exhibit a M2-like phenotype [3]. M2 macro-phages, on the contrary to M1 cells that are pro-inflammatory and cytotoxic, are immunosuppressive and favor angiogenesis and tissue repair [10]. Many studies have shown that tumor associated M2 macro-phages improve tumor cell growth and survival and stimulate angiogenesis and metastases. In 2011, Shree et al. showed that cathepsin-expressing macrophages protect breast cancer cells from cell death induced by several chemotherapeutic drugs like taxol or etoposide [11]. Very recently, Mantovani and Allavena published a review summarizing the actual knowledge on the ef-fect of anticancer therapies on TAMs [12]. However, a better understanding of this chemoprotective effect is still needed in order to design more efficient thera-peutic strategies.
In order to study how macrophages could modulate tumor cells and in particular the tumor cell response to chemotherapeutic agents, we first set up a new and con-venient model of human macrophage polarization. Mac-rophages were differentiated starting from the human monocytic cell line THP-1. Once differentiated in the pres-ence of PMA, they can be polarized into M1 or M2 macro-phages that express markers similarly to polarized macrophages obtained from freshly isolated monocytes. When HepG2 hepatoma cells or A549 lung adenoma cells were co-cultured with THP-1 M1 or M2 macrophages, they responded differentially to etoposide. In the presence of THP-1 M1 macrophages, the apoptosis of cancer cells in-duced by etoposide increased. On the opposite, M2 THP-1 macrophages were protective. This is the first demonstra-tion that THP-1 polarized macrophages display funcdemonstra-tions similar to the ones described for polarized TAMs.
Methods
Cell culture
Human monocytic THP-1 cells were maintained in culture in Roswell Park Memorial Institute medium (RPMI 1640, Invitrogen) culture medium containing 10 % of heat inacti-vated fetal bovine serum (Invitrogen) and supplemented with 10 mM Hepes (Gibco, #15630-056), 1 mM pyruvate (Gibco, #11360-039), 2.5 g/l D-glucose (Merck) and 50 pM ß-mercaptoethanol (Gibco; 31350–010). THP-1 monocytes are differentiated into macrophages by 24 h incubation with 150 nM phorbol 12-myristate 13-acetate (PMA, Sigma, P8139) followed by 24 h incubation in RPMI medium. Macrophages were polarized in M1 macrophages by incu-bation with 20 ng/ml of IFN-γ (R&D system, #285-IF) and 10 pg/ml of LPS (Sigma, #8630). Macrophage M2 polarization was obtained by incubation with 20 ng/ml of interleukin 4 (R&D Systems, #204-IL) and 20 ng/ml of interleukin 13 (R&D Systems, #213-ILB). HepG2 and A549 cells were respectively cultivated in Dulbecco’s modified Eagle's minimal essential medium (DMEM medium 1 g glucose/l) (Gibco) and Minimum Essential Medium Eagle medium (MEM) (Gibco), both containing 10 % fetal bovine serum. In the co-culture experiments, THP-1 monocytes were differentiated in 6 Transwell inserts (membrane pore size of 0.4μm, Corning, #3450). Macrophages and HepG2 cells were co-cultured in CO2independent medium
supple-mented with 0.5 mM L-glutamine (Sigma, # G3126) and 3.75 g/l of D-glucose (Sigma, #50-99-7) for 16 h before be-ing incubated with or without 50 μM etoposide (Sigma, #E1383) for 24 h. Macrophages and A549 cells were co-cultured in CO2independent medium supplemented with
0.5 mM L-glutamine and 2.5 g/l of D-glucose for 24 h be-fore being incubated with or without 50μM etoposide for 16 h. In the monoculture experiments, 0.8 x 10⁶ THP-1 monocytes were differentiated and polarized in 6 well plates. Next, they were incubated in CO2 independent
medium supplemented with 0.5 mM L-glutamine (Sigma, # G3126) and 3.75 g/l of D-glucose (Sigma, #50-99-7) for 16 h before being incubated with or without 50μM etopo-side (Sigma, #E1383) for 24 h.
Immunofluorescence labeling and confocal microscopy
THP-1 monocytes were seeded at 100 000 cells/well in 24-well plates containing a coverslip and were differentiated as described here above. Undifferentiated monocytes were at-tached on coverslips by drying a PBS drop containing 100 000 cells. For labeling, cells were fixed for 10 min with paraformaldehyde 4 % in cold PBS, washed three times with 2 % PBS–BSA (bovine serum albumin) and incubated overnight at 4 °C with the primary antibody 1:100 diluted in 2 % PBS-BSA: anti-CD68 (KP1) from Abcam (ab955), anti-CD71 (H300) from Santa Cruz (sc-9099), anti-CD36 (H300) from Santa Cruz (sc-9154), anti-CD14 (1H5D8) from Abcam (ab181470). Cells were washed three times
with 2 % PBS–BSA and then incubated for 1h with the sec-ondary antibody. Alexa Fluor-488-conjugated anti-rabbit IgG antibody (Molecular Probes, #A11034) was used at 1/1000 dilution. Cells were then washed three times with PBS, the coverslips were mounted in Mowiol (Sigma) and observed with a confocal microscope (SP5, Leica).
Cell viability (MTT assay)
THP-1 monocytes were seeded at 180 000 cells/well in 24 well plates and differentiated in macrophages as described. After incubation with IFN-γ ± LPS, cells were incubated 2 h with 500 μl of MTT reagent (2.5 mg/ml of PBS, Sigma #M2128) in the CO2 incubator. The media were then
re-moved and 1 ml of lysis buffer (SDS 30 %/N,N-dimethyl-formamide 2:1 pH 4.7) was added per well. Plates were in-cubated at 37 °C and gently shaked at 70 rpm for 1 h. The absorbance was then measured at 570 nm.
RT-qPCR
After the incubation, total RNA was extracted using the RNeasy mini kit and DNase protocol (Qiagen, #74104). mRNA contained in 2 μg total RNA was reverse tran-scribed using Transcriptor first strand cDNA synthesis kit (Roche, #4379012001). Amplification reaction assays contained SYBRGreen PCR Master Mix (Applied Biosys-tem, #4309155) and primers (IDT, 300 nM). RPS9 (40S ribosomal protein S9) was used as the reference gene for normalization and mRNA abundance was quantified using the threshold cycle method.
ELISA
Cytokine secretion in the culture medium was assayed using an ELISA kit according to the procedure recom-mended by the supplier (CXCL10 (R&D System, #DIP100), IL-6 (R&D System, D6050), IL-10 (R&D System, D1000B), CCL18 (Abnova, #KA1757)).
Results are expressed in pg of cytokine normalized per μg of proteins assayed by the Pierce method after cell lysis using 60 μl of mammalian protein extraction re-agent (78501 from Thermo Scientific).
Analysis of CD206 plasma membrane expression by flow cytometry
THP-1 monocytes were seeded in T25 flask at 2.5 × 10⁶ cells/T25 and differentiated with PMA. After incubation with or without IL-4 and IL-13, cells were washed with cold PBS and detached with EDTA 5 mM. Cold PBS containing 5 % human heat inactivated serum (his) and 0.1 % NaN3was added in the flasks and the cell
suspen-sion put in FACS tubes. Cells were counted and 0.5 × 10⁶ cells were resuspended in a total of 1 ml of PBS 5 % his 0.1 % NaN3. Cell suspension was centrifuged 5 min at
200 g and 4 °C and the pellet resuspended with 1 ml of PBS 5 % his 0.1 % NaN3. This washing step was performed
twice. The pellet was next resuspended with human truS-tain FcX (BioLegend, #422301) diluted 20 x in PBS. A total volume of 50μl was used for resuspension. The suspension was then incubated at room temperature for 10 min. Cells were centrifuged 5 min at 200 g and 4 °C. The pellet was resuspended with 50μl of primary anti-CD206 antibody di-luted 5 times in PBS 5 % his 0.1 % NaN3and incubated
30 min at 4 °C. Cells were also incubated with the control isotype corresponding to each primary antibody. Primary antibodies are PE (Phycoerythrin) mouse anti-human CD206 (BD Pharmingen, #555954) and PE mouse IgG1κ isotype control (BD Pharmingen #555749). After incuba-tion, PBS 5 % his 0.1 % NaN3was added and the
suspen-sion centrifuged 5 min at 200 g and 4 °C. Three washes with PBS 5 % his 0.1 % NaN3were next performed. The
pellet was resuspended with 2 % paraformaldehyde (in cold PBS) and incubated 20 min at 4 °C. Suspension was centri-fuged 5 min at 200 g 4 °C and the pellet resuspended with glycine 0.1 M (in cold PBS) and incubated 10 min at 4 °C. A last centrifugation of 5 min at 200 g and 4 °C was per-formed before cell resuspension in 1 ml of PBS 5 % his 0.1 % NaN3. Cells were analyzed by flow cytometry with a
FACScalibur (BD Biosciences).
Western blotting
Cells were seeded in 6 well plates (Costar; 250000 HepG2 cells/well and 125000 A549 cells/well) 1 day before incuba-tion with macrophages. After the incubaincuba-tion, proteins were extracted and PARP-1 and caspase-3 protein abundance was assessed by western blotting as described previously [13]. Primary antibodies are rabbit anti-caspase-3 antibody (Cell Signaling, #9662) and mouse anti-PARP1 antibody (BD Pharmingen, #551025). Primary antibodies mouse anti-β-actin (Sigma, #A5441) or mouse anti-α-tubulin (Sigma, # T5168) were used for normalization. IRDye 800CW-conjugated goat anti-rabbit antibody (H + L; Licor, #926-32211), IRDye 800CW-conjugated goat anti-mouse antibody (H + L; Licor, #926-32210) and IRDye 680LT-conjugated goat anti-mouse antibody (H + L; Licor, # 926– 68020) were used as secondary antibodies. Quantitative analysis of fluorescence intensity was measured using the Odyssey Classic Infrared Imaging System (Licor).
Caspase activity assay
The fluorogenic substrate Ac-DEVD-AFC was used to measure caspase-3 and caspase-7 activity according to Lozanoet al. [14]. Cell extracts were prepared as described by Wellingtonet al. [15]. HepG2 or A549 cells were seeded in 6 well plates (Costar; 250000 HepG2 cells/well- 125000 A549 cells/well) 1 day before incubation with macrophages. After the incubation, proteins were extracted and caspase activity was measured in the different samples as described previously [13].
Flow cytometry analysis of Annexin V/Propidium iodide staining
HepG2 or A549 cells were seeded in 6 well plates (Costar; 250000 HepG2 cells/well- 125000 A549 cells/well) 1 day before incubation with macrophages. After the incubation, tumor cells were harvested with trypsin/EDTA and stained using FITC Annexin V apoptosis Detection Kit I (BD Phar-mingen #556547). Results were analyzed by flow cytometry (FACSCalibur, BD).
Statistical analysis
Statistical analyses were performed using the Sigma Stat software. For some analyses, values did not follow a Gaussian distribution. In order to deal with this absence of normality, statistical analyses were performed on log-transformed data. In order to facilitate interpretation, untransformed data are shown.
Results and discussion
Monocyte differentiation into macrophages
Human THP-1 monocytes were differentiated into macrophages by an incubation in the presence of phor-bol 12-myristate 13-acetate (PMA). Different PMA concentrations and incubation times were tested (data not shown). A 24 h incubation in the presence of 150 nM PMA followed by 24 h in control medium was finally selected as differentiation protocol. Cells be-came adherent and the expression of recognized macrophage markers, CD68 (cluster of differentiation 68) [16], CD71 [17] and CD36 [18], analyzed by im-munofluorescence staining to confirm the monocyte-to-macrophage differentiation, also clearly increased. The expression of CD14, which decreases with macro-phage differentiation [19], was also studied and con-firmed the differentiation (Fig. 1).
Fig. 2 Effects of IFN-γ and/or LPS on THP-1 macrophage viability after 16 or 24 h of incubation. THP-1 macrophages were incubated in RPMI medium with IFN-γ (20, 50 or 100 ng/ml) alone or in combination with LPS at different concentrations. After 16 and 24 h of incubation, cell viability was measured by a MTT assay. Results are expressed as means ± 1 S.D. (n = 3). Statistical analysis was carried out with a two-way ANOVA test followed by a Holm-Sidak post-test. * or ***: significantly different from the corresponding control (Ctrl) respectively with p < 0.05 or 0.001 Fig. 1 THP-1 monocyte differentiation in macrophages. THP-1 cells
were incubated 24 h in the presence of 150 nM PMA and then in RPMI medium during 24 h. Cells were then fixed and immunolabeled for CD14, CD68, CD71 or CD36 using specific antibodies (green). Nuclei were detected with To-pro3 (blue)
THP-1 polarization into pro-inflammatory M1 macrophages
The classical protocol for M1 polarization is to incu-bate macrophages in the presence of IFN-γ alone or in combination with LPS [6], in general for 24 h. While IFN-γ is used at 20 ng/ml in most studies the LPS con-centration varied from 10 ng to 1 μg/ml according to the reports [20, 21].
Based on the literature, we tested different concentra-tions of LPS, varying from 1 to 100 ng/ml, combined with 20 ng/ml of IFN-γ and we incubated THP-1
macrophages during 16 or 24 h. We observed a high cytotoxicity, which increased with the LPS concentra-tion: cell viability, measured by a MTT assay, decreased from 100 % in control cells to 65 % after 24 h incubation with 10 ng/ml of LPS + 20 ng/ml of IFN-γ. No toxicity was observed with IFN-γ alone (Fig. 2). The cytotoxicity induced by LPS on macrophages has been already de-scribed [22, 23]. To reduce the LPS induced cytotoxicity, Hirose and colleagues worked with lower LPS concen-trations and incubated macrophages for M1 polarization with 10 pg/ml of LPS + 20 ng/ml INF-γ for 18 h [22].
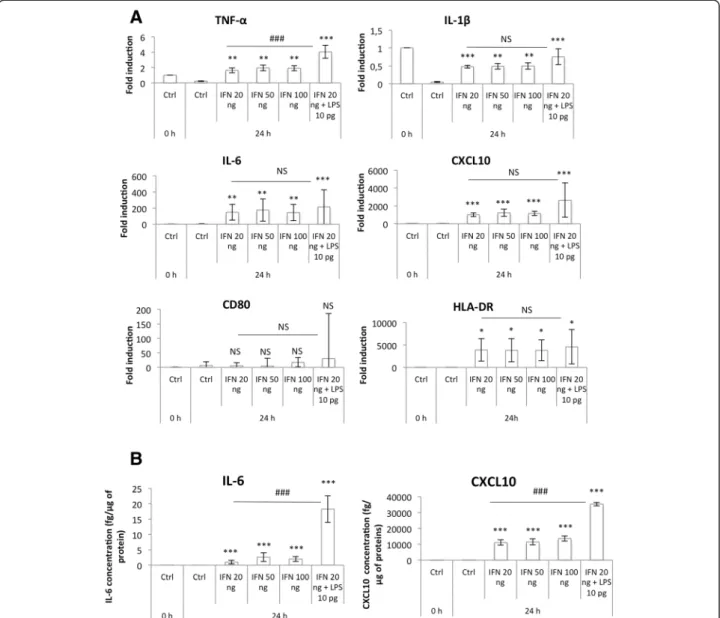
Fig. 3 M1 macrophage marker expression. THP-1 macrophages were incubated with IFN-γ (20, 50, 100 ng) and/or LPS 10 pg/ml during 24 h. (a) mRNA expression of M1 macrophage markers was studied by RT-qPCR and normalized by RPS9 expression. Results are expressed as means ± 1 S.D. (n = 3). (b) IL-6 and CXCL10 secretion in culture medium was measured by ELISA. Results are expressed as means ± 1 S.D. (n = 3). Statistical analysis was carried out with a one-way ANOVA test followed by a Holm-Sidak post-test. NS: not significantly different. *, ** or ***: significantly different from the corresponding control (Ctrl) respectively with p < 0.05, 0.01 or 0.001; ###: significantly different with p < 0.001. Statistical analyses were performed on non-transformed data for TNF-α (a), IL-1ß (a), IL-6 (b) and CXCL10 (b) and on log-transformed data for IL-6 (a), CXCL10 (a), CD80 (a) and HLD-DR (a)
We thus incubated M0 THP-1 macrophages during 16 or 24 h with 10 pg/ml LPS + 20 ng/ml IFN-γ. In these conditions, the cell viability was not affected after 16 h incubation and only slightly (93 % cell viability) after 24 h incubation (Fig. 2).
Macrophage M1 polarization was then assessed by measuring the expression of several classical M1 markers: TNF-α, IL-1β, IL-6 and CXCL10, which are pro-inflammatory cytokines, and CD80 and HLA-DR, two membrane receptors, both at the mRNA level
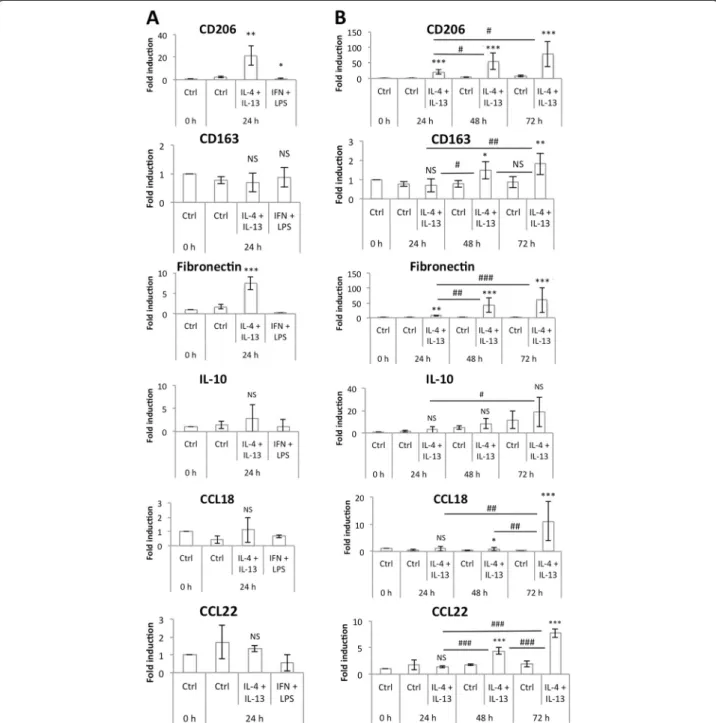
Fig. 4 M2 macrophage marker mRNA expression. (a) THP-1 macrophages were incubated during 24 h either with IL-4 and IL-13 (20 ng/ml each) or with IFN-γ 20 ng/ml and LPS 10 pg/ml and mRNA expression of M2 macrophage markers was studied by RT-qPCR and normalized by RPS9 expression. Results are expressed as means ± 1 S.D. (n = 3). (b) THP-1 macrophages were incubated with IL-4 and IL-13 (20 ng/ml each) during 24, 48 or 72 h and mRNA expression of M2 macrophage markers was studied by RT-qPCR and normalized by RPS9 expression. Results are expressed as means ± 1 S.D. (n = 3). Statistical analysis was carried out with a one-way ANOVA for figure A and a two-way ANOVA for figure B, followed by a Holm-Sidak post-test. NS: not significantly different. *, ** or ***: significantly different from the corresponding control (Ctrl) respectively with p < 0.05, 0.01 or 0.001; ###: significantly different with p < 0.001. Statistical analyses were performed on log-transformed data for CD206 (b), fibronectin (b) and CCL18 (b)
using RT-qPCR (Fig. 3a) and at the protein level by ELISA (for IL-6 and CXCL10) (Fig. 3b). An increased pro-inflammatory marker expression profile was obtained by incubation with IFN-γ combined with 10 pg/ml of LPS in comparison to IFN-γ alone. TNF-α and IL-1β were expressed in control M0 macrophages, but their expression decreased after 24 h in control medium. This could be due to PMA used for monocyte-to-macrophage differentiation, which has been described to up-regulate their expression [24]. On the other hand, their expression was highly in-creased in macrophages incubated in the presence of LPS and IFN-γ.
We also checked the expression at the mRNA level of several M2 markers (CD206, CD163, fibronectin, IL-10, CCL18 and CCL22) in M1 macrophages, but in our con-ditions, we observed no significant expression of these genes (Fig. 4a). This was not the case when higher LPS concentrations were used for macrophage polarization. In-deed, after 24 h of incubation with 10 ng/ml of LPS + 20 ng/ml IFN-γ, the mRNA abundance of CCL18 increased (data not shown). CCL18 has been frequently described as a M2 macrophage marker, induced by 4, 13 and IL-10 [6, 25]. In 2013, Chanputet al. [26] published a model of THP-1 macrophage polarization in M1 and M2 macro-phages. To polarize macrophages in M1 cells, they incu-bated cells with 20 ng/ml IFN-γ plus 1 μg/ml LPS. In these conditions, they measured higher levels of expres-sion for several M2 macrophage markers (IL-10, CCL17,
CCL18) in M1 macrophages than in M2 (polarized after 24 h incubation with 20 ng/ml IL-4). This result con-firms our hypothesis that the incubation of THP-1 macrophages with high LPS concentrations might in-duce an unspecific expression of M2 macrophage markers in pro-inflammatory macrophages.
In conclusion, incubation of THP-1 macrophages with IFN-γ 20 ng/ml and LPS 10 pg/ml during 24 h induces their polarization into M1 macrophages.
THP-1 polarization into anti-inflammatory M2 macrophages
Macrophage polarization into alternatively activated mac-rophages, also called M2 cells, is induced in vivo and in vitro by IL-4 and IL-13 stimulation [6]. In most of the studies in which murine or human primary macro-phages were polarized into M2 macromacro-phages, incuba-tions of 16 or 24 h with 20 ng/ml of IL-4 alone or combined with 20 ng/ml of IL-13 have been generally used [20, 22, 23].
We incubated M0 THP-1 macrophages with 4 and IL-13 at a concentration of 20 ng/ml during 24, 48 or 72 h. The M2 phenotype was characterized by studying the mRNA and protein abundance of several M2 markers: CD206, CD163, fibronectin, IL-10, CCL18 and CCL22. After 24 h incubation, the expression of CD206, fibronectin and IL-10 was slightly increased whereas CD163, CCL18 and CCL22 expression was unchanged. If the incubation
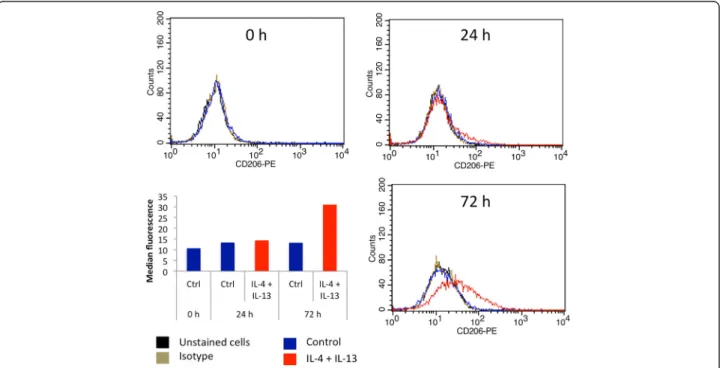
Fig. 5 Cell surface CD206 expression by M2 macrophages. THP-1 macrophages were incubated during 24 or 72 h with control medium with or without IL-4 and IL-13. CD206 protein expression on macrophages was analyzed by flow cytometry with a specific antibody coupled to PE. Two controls were performed: some cells were unstained and others stained with a control isotype. The graph presents the histogram median of one of each sample
time with IL-4 and IL-13 was increased to 48 and even fur-ther to 72 h, the mRNA abundance of all M2 markers was much higher (Fig. 4b). The expression pattern of CD206, IL-10 and CCL18 was confirmed at the protein level by FACS analysis for CD206 (Fig. 5) and by ELISA for IL-10 and CCL18 (Fig. 6). No expression of any M1 macrophage marker was evidenced in M2 polarized macrophage after 72 h incubation with IL-4 and IL-13 (data not shown).
When compared to results obtained with primary macrophages differentiated from blood-isolated mono-cytes, the polarization of macrophages derived from THP-1 seems to require a longer incubation time (data not shown, [20]). Indeed, Martinez and colleagues measured a high CCL18 mRNA expression in primary macrophages incubated 16 h with 20 ng/ml of IL-4 (M1:M2 ratio of−19) while 72 h of incubation with IL-4 and IL-13 were required to induce CCL18 expression and to detect a secretion of CCL18 in the culture media of THP-1-derived M2 macrophages.
Effect of M1 and M2 macrophages on cancer cell apoptosis
In order to study the effects of M1 (pro-inflammatory and anti-tumoral) and M2 (anti-inflammatory and pro-tumoral) THP-1 macrophages on cancer cell response to a chemotherapeutic agent, each cell population was co-cultured with HepG2 (human hepatoma) cells in indirect contact using Transwell inserts. Monocytes were seeded on inserts made of a membrane with 0.4 μm pores, which allowed the exchange of soluble factors but not the trans-migration of cells. THP-1 monocyte differenti-ation was launched at different days for M2, M1 and M0 macrophages in order to obtain differentiated and polar-ized macrophages on the same day. 250,000 HepG2 cells were seeded in 6 well plates 24 h before the end of macrophage polarization. This cell density was chosen in order to have a 1:1 ratio between tumor cells and mac-rophages co-cultured in serum free medium. Serum free medium was used because serum protects HepG2 cells against apoptosis induced by etoposide (data not shown). After 16 h of co-culture, the two cell populations were incubated in the presence of 50μM of etoposide added directly into the wells. Cells were further incubated with etoposide for 24 h.
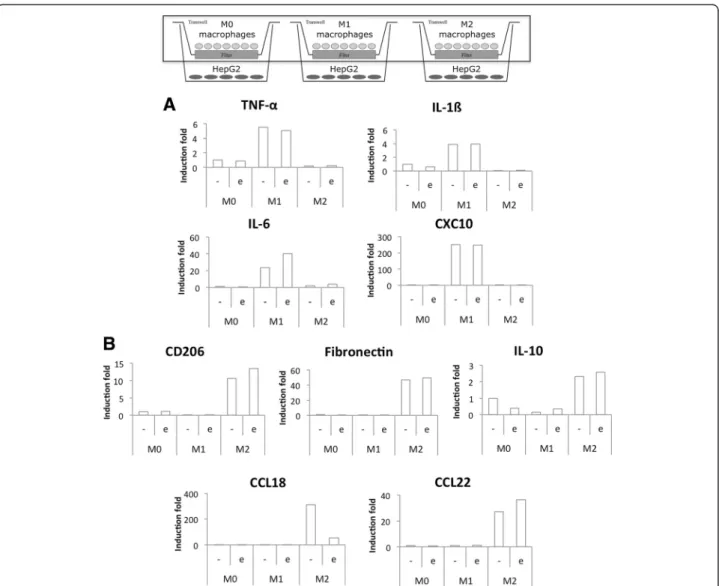
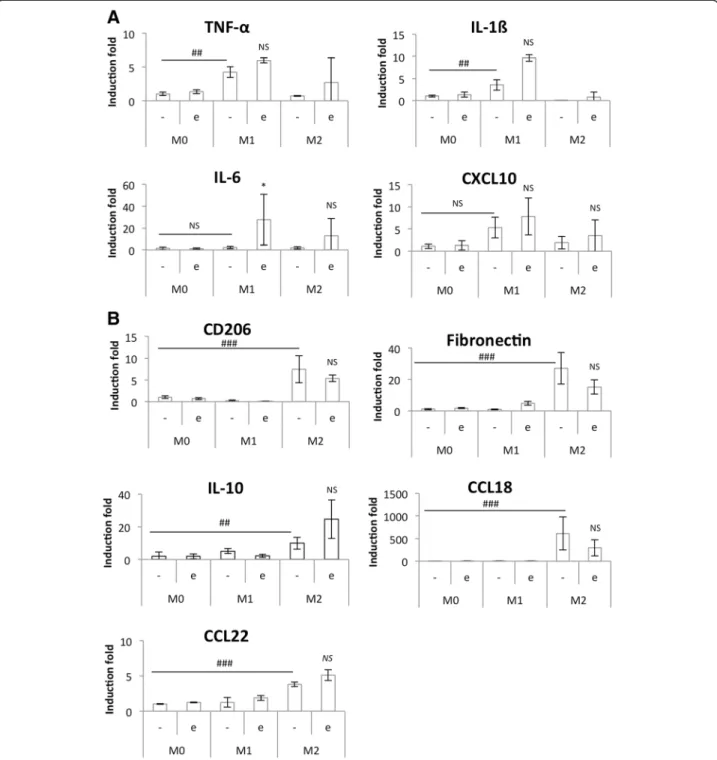
At the end of the incubation, RNA was extracted from macrophages and RT-qPCR was used to measure M1 and M2 macrophage marker expression (Fig. 7). Incuba-tion in CO2 independent medium with or without
eto-poside had no effect on macrophage polarity. Indeed, IL-6 was the only M1 marker clearly affected by the pres-ence of etoposide. Regarding M2 macrophage markers, only CCL18 expression was strongly reduced in cells in-cubated with etoposide. The same experiment was per-formed on monocultures of macrophages incubated in the same conditions and the M1 and M2 marker expression was similar to the one measured in co-cultures (Fig. 8). In-cubation of pro-inflammatory M1 macrophages in the presence of etoposide not significantly increased IL-6 and IL-1ß mRNA expression. This increase is probably due to p38 MAPK activation by etoposide [5]. Once activated, p38 MAPK induces TNF-α, IL-ß and IL-6 expression. Moreover, IL-6 and CXCL10 levels were higher in M1 macrophages in co-culture with HepG2 cells than in monoculture.
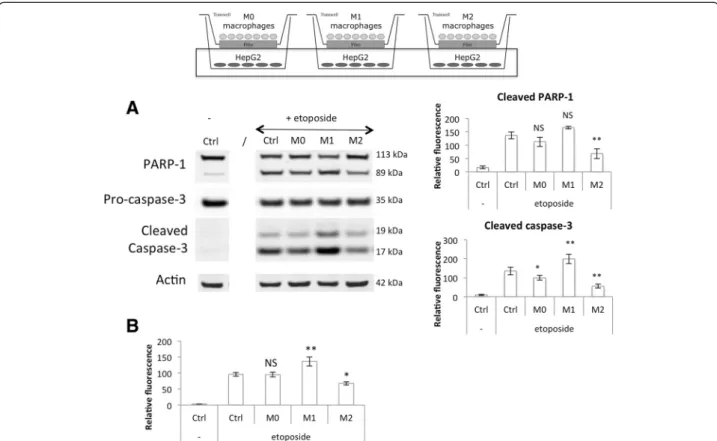
At the same time, protein extraction was performed on the HepG2 cells in order to measure apoptosis and how it could be affected by the co-cultured macro-phages via secreted factors. Western blotting analyses were performed in order to measure cleaved caspase-3 and cleaved PARP-1 protein abundance (Fig. 9a) and caspase-3/7 activity was quantified using a fluorogenic substrate (Fig. 9b). An increased abundance of cleaved caspase-3 was observed in HepG2 cells incubated in the presence of M1 macrophages in comparison to
Fig. 6 M2 macrophage secretion of IL-10 and CCL18. The IL-10 and CCL18 secretion in culture medium by macrophages was measured by ELISA. Results are expressed as means ± 1 S.D. (n = 3). Statistical analysis was carried out with a two-way ANOVA test, followed by a Holm-Sidak post-test. NS: not significantly different. ** or ***: significantly different from the corresponding control (Ctrl) respectively with p < 0.01 or 0.001; # or ###: significantly different respectively with p < 0.05 or 0.001. Statistical analyses were performed on log-transformed data for CCL18
control cancer cells incubated without macrophages. The slight increase in PARP-1 protein abundance was how-ever not significant. M1 macrophages also increased the caspase activity in etoposide-exposed HepG2 cells. It has to be noted that a slight increase in HepG2 cell apop-tosis was observed when cells were incubated with M1 macrophages in the absence of etoposide (data not shown). When HepG2 cells were incubated with M2 macrophages, cancer cell apoptosis was highly reduced in comparison to the one measured in control cells. In-deed, cleaved caspase-3 and cleaved PARP-1 proteins are much less abundant in cells incubated in the pres-ence of M2 macrophages. Western blot results were confirmed by a caspase activity assay.
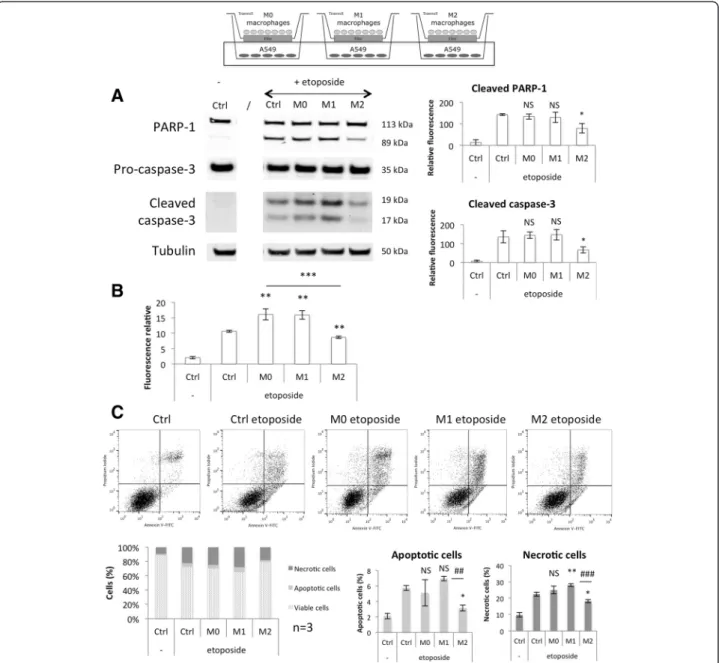
These results were reproduced in a second cancer cell line, A549 cells, co-cultured with macrophages during 24 h before addition of the etoposide and
incubation during 16 h (Fig. 10). The incubation kin-etic was changed because A549 cells are more sensitive to etoposide-induced apoptosis than HepG2 cells. M0 macrophages had no effect on the etoposide-induced HepG2 cell apoptosis (Fig. 9) and no effect on the etoposide-induced A549 cell apoptosis as measured by caspase-3 and PARP-1 cleavage (Fig. 10a) and propi-dium iodine-annexin V-labeling (Fig. 10c). However, an increase was observed for caspase-3/7 activity ana-lysis in A549 cells (Fig. 10b), which is indeed no really consistent with the two other observations. This may be due to the activity of other caspases than caspase-3 like caspase-7.
In co-culture with A549 cells, the cytotoxic effect of M1 macrophages was smaller than what was observed in co-culture with HepG2 cells. However, M1 macro-phages significantly increased the caspase activity as
Fig. 7 Study of M1 (a) and M2 (b) polarization marker mRNA expression in co-cultured macrophages. Macrophages were co-cultured in indirect contact with HepG2 cells during 16 h before incubation with or without 50μM etoposide (+/− e) during 24 h. After the incubation, macrophage RNA was extracted, retro-transcribed and the mRNA expression of M1 and M2 macrophage markers was studied by RT-qPCR (n = 1)
well as the percentage of propidium iodide positive A549 cells (necrotic cells) in comparison to control cells incubated with etoposide without macrophages
(Fig. 10c). M1 macrophages increased the etoposide-induced HepG2 cell apoptosis (Fig. 9) as well as the etoposide-induced A549 cell apoptosis as measured by
Fig. 8 Study of M1 (a) and M2 (b) polarization markers mRNA expression in etoposide-incubated macrophages. THP-1 macrophages were differentiated (M0) and polarized in M1 and M2 macrophages by respectively 24 h with IFN-γ (20 ng/ml) + LPS (10 pg/ml) (M1) and 72 h with IL-4 and IL-13 (20 ng/ml each- M2)). Once polarized, they were incubated in CO2-independent medium (+3,75 g D-glucose/l) during 16 h
before incubation with or without 50μM etoposide (+/− e) during 24 h. After the incubation, mRNA expression of M1 and M2 macrophage markers was studied by RT-qPCR and normalized by RPS9 expression. Results are expressed as means ± 1 S.D. (n = 3). Statistical analysis was carried out with the two-way ANOVA test followed by a Holm-Sidak post-test NS: not significantly different. *: significantly different from the corresponding control with p < 0.05; ## or ###: significantly different respectively with p < 0.01 or 0.001. Statistical analyses were performed on log-transformed data for all the genes
caspase-3 activity (Fig. 10b) and propidium iodine-annexin V-labeling (Fig. 10c). However, no significant effect was observed on cleaved caspase-3 and cleaved PARP-1 protein abundance in A549 cells (Fig. 10a), which is indeed no really consistent with the two other observations. However, for two western blot analyses out of the three independent experiments, this effect was observable.
On the opposite, M2 macrophages displayed a strong protective effect for all three parameters.
All together, these results showed that M1 and M2 macrophages differentiated and polarized from THP-1 monocytes modulate the apoptotic response to etoposide of two cancer cell lines, HepG2 and A549 cancer cells. M1 macrophages had a cytotoxic effect and increased the etoposide-induced apoptosis. On the opposite, M2 macrophages were protective and decreased the apop-tosis in cancer cells exposed to this drug.
Using thisin vitro model of co-culture, we were able to reproduce the effects of macrophages observed in clinical
studies or with differentin vivo animal models. Many stud-ies have shown on one hand an inverse correlation between macrophage abundance in a tumor and patient prognosis and survival, and on the other hand a positive correlation with resistance to chemotherapy [11, 27–29]. In sites of chronic inflammation where a tumor may develop, macro-phages have a M1 phenotype [30]. M1 macromacro-phages are cytotoxic for pathogens and tumor cells. Their tumoricidal activity was related to their ability to secrete reactive nitro-gen and oxynitro-gen species and pro-inflammatory cytokines [7]. THP-1 M1 macrophages polarized after 24 h incuba-tion with 10 pg/ml of LPS and 20 ng/ml IFN-γ and incu-bated with HepG2 or A549 cells were able to increase the apoptosis of cancer cells induced by etoposide.
In malignant tumors, macrophages exhibit predom-inantly an M2-like phenotype [3, 31, 32]. M2 macro-phages improve tumor cell growth and survival by secretion of many growth factors like EGF, members of the FGF family, TGF-ß or VEGF (vascular endothelial growth factor) [10, 33]. Many soluble factors present in
Fig. 9 Modulation of HepG2 cell apoptosis induced by etoposide by co-cultured M0, M1 and M2 macrophages. Macrophages were co-cultured in indirect contact with HepG2 cells during 16 h before incubation with or without 50μM etoposide (+/− e) during 24 h. (a) HepG2 cell proteins were extracted and PARP-1 and caspase-3 protein abundance was assessed by western blotting using specific antibodies. ß-actin was used as loading control. Graphs represent the quantification of cleaved PARP-1 and cleaved caspase-3 abundance normalized by the corresponding ß-actin in three independent experiences. Results are expressed as mean ± 1 S.D. (n = 3). (b) After the incubation with etoposide, caspase-3 and-7 activity was assayed in HepG2 cells by measuring the fluorescence intensity of free AFC released from the cleavage of Ac-DEVD-AFC. Results are expressed in relative caspase-3/-7 activity as mean ± 1 S.D. (n = 3). Statistical analysis was carried out with the one-way ANOVA test followed by a Holm-Sidak post-test. NS: no significantly different from control cells incubated with etoposide; * or **: significantly different from control cells incubated with etoposide respectively with p < 0.05 or 0.01
the tumor microenvironment and secreted by macro-phages have already been described to decrease cancer cell response to chemotherapy like IL-1ß [34, 35], VEGF [36], TGF-ß [37], IL-4 [38] as well as cathepsins B and S [11]. However, not all of these genes are typical
M2 macrophage markers. Indeed, IL-1ß is up regulated in M1 macrophages and cathepsin S is slightly up regulated after IFN-γ and LPS stimulation (data not shown).
THP-1 M2 macrophages polarized by 72 h incubation with 20 ng/ml of IL-4 and IL-13 and incubated with HepG2
Fig. 10 Modulation of A549 cell apoptosis induced by etoposide by co-cultured M0, M1 and M2 macrophages. Macrophages were co-cultured in indirect contact with A549 cells during 24 h before incubation with or without 50μM etoposide (+/− e) during 16 h. (a) A549 cell proteins were extracted and PARP-1 and caspase-3 protein abundance was assessed by western blotting using specific antibodies.α-tubulin was used as loading control. Graphs represent the quantification of cleaved PARP-1 and cleaved caspase-3 abundance normalized by the correspondingα-tubulin in three independent experiences. Results are expressed as mean ± 1 S.D. (n = 3). (b) After the incubation with etoposide, caspase-3 and-7 activity was assayed in A549 cells by measuring the fluorescence intensity of free AFC released from the cleavage of Ac-DEVD-AFC. Results are expressed in relative caspase-3/-7 activity as mean ± 1 S.D. (n = 3). (c) After the incubation with macrophages, A549 cells were detached and stained with Annexin V-FITC and propidium iodide before fluorescence analysis by flow cytometry. The percentage of cells in the four different quadrants was calculated and the results present in different histograms where viable cells are Annexin V-/PI-, apoptotic cells Annexin V+/PI- and necrotic cells are PI +. Results are present as mean ± 1 S.D. (n = 3). Statistical analysis was carried out with the one-way ANOVA test followed by a Holm-Sidak post-test. NS: no significantly different from control cells incubated with etoposide; *, ** or ***: significantly different from control cells incubated with etoposide respectively with p < 0.05, 0.01 or 0.001
or A549 cells highly reduced the etoposide-induced apop-tosis. It has to be noted that, in human macrophages, NO production is not modulated by polarization as it is de-scribed for murine macrophages [5]. This is important since etoposide has been shown to be chemically modified by NO-derived species and forms products with reduced toxic activity [39].
Etoposide at the concentration used in this work did not influence macrophage polarization. Moreover macrophage expression profiles were very similar between co-culture and monoculture experiments performed in the same incu-bation conditions. It means that cancer cells have no im-pact on THP-1 macrophage polarization after incubation with etoposide. Results from Weigert et al. [40] showed that when primary macrophages were incubated in direct co-culture with MCF-7 cells, they produced TNF-α that in-duced MCF-7 cell apoptosis. Apoptotic cells released sphingosine-1-phosphate (S1P), which caused a macro-phage phenotypic switch from M1 to M2. THP-1 M0 mac-rophages did not induce cancer cell apoptosis in our co-culture system and no phenotypic switch was observed after co-culture with etoposide. However, the kinetic used in that study was more than 3 days longer than ours. The same research group also described that S1P can favor macrophage survival after etoposide incubation [39]. We did not study the impact of S1P on THP-1 macrophage survival, which seemed unaffected by 24 h incubation with 50μM of etoposide, but we did it on HepG2 cell response to etoposide. S1P had no effect on etoposide-induced apoptosis of HepG2 cells (data not shown). Hence, the differential effects we observed were not due to a shift from one phenotype to the other.
Our model is original because it uses THP-1 differenti-ated macrophages, which are easy to obtain, differentiate and polarize. M1 and M2 THP-1 macrophages have the same expression profiles than polarized primary macro-phages. We studied the influence of macrophages on can-cer cell response to etoposide. Macrophage pre-incubation with cancer cells was needed to obtain a protective effect of M2 macrophages on the etoposide-induced apoptosis. It means that the two cell populations have to exchange soluble factors, which will activate pro-survival pathways allowing cancer cells to resist to the etoposide-induced apoptosis. This model is a great tool to study the influence of a specific pathway in the protective or cytotoxic effect of macrophages on cancer cells. We used it to study the influence of the COX-I pathway (up-regulated in the M2 macrophages, data not shown) and no effect of COX-I in-hibition was observed on the protective effect of M2 macrophages.
Conclusion
In conclusion, we developed an easy, reproducible and well-characterized model of differentiated THP-1
monocytes polarized into M1 and M2 macrophages. Using this model, we demonstrated that M1 and M2 macrophages exerted opposite effects on cancer cell re-sponse to a chemotherapeutic drug.
Abbreviations
BSA:Bovine serum albumin; CD206 (=MRC1): Mannose receptor; IRDye: Infrared dye; PARP1: Poly [ADP-ribose] polymerase 1; PMA: Phorbol 12-myristate 13-acetate; RPS9: 40S ribosomal protein S9; TAM: Tumor associated macrophage.
Competing interests
The authors declare that they have no competing interests. Authors’ contributions
MG, FC and AF carried out the experiments. MG wrote the manuscript. MR and CM conceived of the study, and participated in its design and coordination and helped to draft the manuscript. All authors read and approved the final manuscript.
Acknowledgments
Marie Genin is a Research Fellow of the FRIA-FNRS (Fonds de la Recherche Scientifique, Belgium). Francois Clement is a recipient of a Télévie grant. Immunofluorescence staining observation with confocal microscopy was performed using the“morphology” technological platform (University of Namur) with the help of Noelle Ninane. FACS analysis was done using the“morphology” technological platform (University of Namur) with the help of Christian Didembourg. The authors would like to thank Muriel Moser (ULB, Gosselies) for helpful discussion and proofreading of the manuscript. They also acknowledge Caroline Peyrode (UMR 990, Clermont-Ferrand) for her scientific input. Author details
1
URBC, NARILIS, University of Namur, Namur, Belgium.2Laboratory of Biochemistry and Cellular Biology, NARILIS, University of Namur, 61 rue de Bruxelles, 5000 Namur, Belgium.
Received: 15 September 2014 Accepted: 14 July 2015 References
1. Gordon S. The macrophage: past, present and future. Eur J Immunol. 2007;37 Suppl 1:S9–17.
2. Gordon S, Taylor PR. Monocyte and macrophage heterogeneity. Nat Rev Immunol. 2005;5(12):953–64.
3. Mantovani A, Sozzani S, Locati M, Allavena P, Sica A. Macrophage polarization: tumor-associated macrophages as a paradigm for polarized M2 mononuclear phagocytes. Trends Immunol. 2002;23(11):549–55.
4. Gordon S. Alternative activation of macrophages. Nat Rev Immunol. 2003;3(1):23–35.
5. Biswas SK, Allavena P, Mantovani A. Tumor-associated macrophages: functional diversity, clinical significance, and open questions. Semin Immunopathol. 2013;35(5):585–600.
6. Mantovani A, Sica A, Sozzani S, Allavena P, Vecchi A, Locati M. The chemokine system in diverse forms of macrophage activation and polarization. Trends Immunol. 2004;25(12):677–86.
7. Van Ginderachter JA, Movahedi K, Hassanzadeh Ghassabeh G, Meerschaut S, Beschin A, Raes G, et al. Classical and alternative activation of mononuclear phagocytes: picking the best of both worlds for tumor promotion. Immunobiology. 2006;211(6–8):487–501.
8. Martinez FO, Helming L, Gordon S. Alternative activation of macrophages: an immunologic functional perspective. Annu Rev Immunol.
2009;27:451–83.
9. Pollard JW. Tumour-educated macrophages promote tumour progression and metastasis. Nat Rev Cancer. 2004;4(1):71–8.
10. Hagemann T, Biswas SK, Lawrence T, Sica A, Lewis CE. Regulation of macrophage function in tumors: the multifaceted role of NF-kappaB. Blood. 2009;113(14):3139–46.
11. Shree T, Olson OC, Elie BT, Kester JC, Garfall AL, Simpson K, et al. Macrophages and cathepsin proteases blunt chemotherapeutic response in breast cancer. Genes Dev. 2011;25(23):2465–79.
12. Mantovani A, Allavena P. The interaction of anticancer therapies with tumor-associated macrophages. J Exp Med. 2015;212:435–45. 13. Notte A, Ninane N, Arnould T, Michiels C. Hypoxia counteracts
taxol-induced apoptosis in MDA-MB-231 breast cancer cells: role of autophagy and JNK activation. Cell Death Dis. 2013;4, e638.
14. Lozano J, Menendez S, Morales A, Ehleiter D, Liao WC, Wagman R, et al. Cell autonomous apoptosis defects in acid sphingomyelinase knockout fibroblasts. J Biol Chem. 2001;276(1):442–8.
15. Wellington CL, Ellerby LM, Hackam AS, Margolis RL, Trifiro MA, Singaraja R, et al. Caspase cleavage of gene products associated with triplet expansion disorders generates truncated fragments containing the polyglutamine tract. J Biol Chem. 1998;273(15):9158–67.
16. Holness CL, Simmons DL. Molecular cloning of CD68, a human macrophage marker related to lysosomal glycoproteins. Blood. 1993;81(6):1607–13. 17. Andreesen R, Osterholz J, Bodemann H, Bross KJ, Costabel U, Lohr GW.
Expression of transferrin receptors and intracellular ferritin during terminal differentiation of human monocytes. Blut. 1984;49(3):195–202.
18. Huh HY, Pearce SF, Yesner LM, Schindler JL, Silverstein RL. Regulated expression of CD36 during monocyte-to-macrophage differentiation: potential role of CD36 in foam cell formation. Blood. 1996;87(5):2020–8. 19. Steinbach F, Thiele B. Phenotypic investigation of mononuclear phagocytes
by flow cytometry. J Immunol Methods. 1994;174(1–2):109–22. 20. Martinez FO, Gordon S, Locati M, Mantovani A. Transcriptional profiling of the
human monocyte-to-macrophage differentiation and polarization: new molecules and patterns of gene expression. J Immunol. 2006;177(10):7303–11. 21. Rey-Giraud F, Hafner M, Ries CH. In vitro generation of monocyte-derived
macrophages under serum-free conditions improves their tumor promoting functions. PLoS One. 2012;7(8), e42656.
22. Hirose K, Iwabuchi K, Shimada K, Kiyanagi T, Iwahara C, Nakayama H, et al. Different responses to oxidized low-density lipoproteins in human polarized macrophages. Lipids Health Dis. 2011;10:1.
23. Deshmukh VA, Tardif V, Lyssiotis CA, Green CC, Kerman B, Kim HJ, et al. A regenerative approach to the treatment of multiple sclerosis. Nature. 2013;502(7471):327–32.
24. Park EK, Jung HS, Yang HI, Yoo MC, Kim C, Kim KS. Optimized THP-1 differentiation is required for the detection of responses to weak stimuli. Inflammation research : official journal of the European Histamine Research Society [et al]. 2007;56(1):45–50.
25. Kodelja V, Muller C, Politz O, Hakij N, Orfanos CE, Goerdt S. Alternative macrophage activation-associated CC-chemokine-1, a novel structural homologue of macrophage inflammatory protein-1 alpha with a Th2-associated expression pattern. J Immunol. 1998;160(3):1411–8. 26. Chanput W, Mes JJ, Savelkoul HF, Wichers HJ. Characterization of polarized
THP-1 macrophages and polarizing ability of LPS and food compounds. Food & function. 2013;4(2):266–76.
27. Lewis CE, Pollard JW. Distinct role of macrophages in different tumor microenvironments. Cancer Res. 2006;66(2):605–12.
28. Ruffell B, Affara NI, Coussens LM. Differential macrophage programming in the tumor microenvironment. Trends Immunol. 2012;33(3):119–26. 29. Mitchem JB, Brennan DJ, Knolhoff BL, Belt BA, Zhu Y, Sanford DE, et al.
Targeting tumor-infiltrating macrophages decreases tumor-initiating cells, relieves immunosuppression, and improves chemotherapeutic responses. Cancer Res. 2013;73(3):1128–41.
30. Biswas SK, Sica A, Lewis CE. Plasticity of macrophage function during tumor progression: regulation by distinct molecular mechanisms. J Immunol. 2008;180(4):2011–7.
31. Biswas SK, Gangi L, Paul S, Schioppa T, Saccani A, Sironi M, et al. A distinct and unique transcriptional program expressed by tumor-associated macrophages (defective NF-kappaB and enhanced IRF-3/STAT1 activation). Blood. 2006;107(5):2112–22.
32. Saccani A, Schioppa T, Porta C, Biswas SK, Nebuloni M, Vago L, et al. p50 nuclear factor-kappaB overexpression in tumor-associated macrophages inhibits M1 inflammatory responses and antitumor resistance. Cancer Res. 2006;66(23):11432–40.
33. Sica A, Schioppa T, Mantovani A, Allavena P. Tumour-associated macrophages are a distinct M2 polarised population promoting tumour progression: potential targets of anti-cancer therapy. Eur J Cancer. 2006;42(6):717–27.
34. Kaler P, Galea V, Augenlicht L, Klampfer L. Tumor associated macrophages protect colon cancer cells from TRAIL-induced apoptosis through IL-1 beta-dependent stabilization of Snail in tumor cells. PLoS One. 2010;5(7), e11700.
35. Angst E, Reber HA, Hines OJ, Eibl G. Mononuclear cell-derived interleukin-1 beta confers chemoresistance in pancreatic cancer cells by upregulation of cyclooxygenase-2. Surgery. 2008;144(1):57–65.
36. Dias S, Choy M, Alitalo K, Rafii S. Vascular endothelial growth factor (VEGF)-C signaling through FLT-4 (VEGFR-3) mediates leukemic cell proliferation, survival, and resistance to chemotherapy. Blood. 2002;99(6):2179–84. 37. Ohmori T, Yang JL, Price JO, Arteaga CL. Blockade of tumor cell
transforming growth factor-betas enhances cell cycle progression and sensitizes human breast carcinoma cells to cytotoxic chemotherapy. Exp Cell Res. 1998;245(2):350–9.
38. Natoli A, Lupertz R, Merz C, Muller WW, Kohler R, Krammer PH, et al. Targeting the IL-4/IL-13 signaling pathway sensitizes Hodgkin lymphoma cells to chemotherapeutic drugs. Int J Cancer. 2013;133(8):1945–54. 39. Sinha BK, Kumar A, Bhattacharjee S, Espey MG, Mason RP. Effect of nitric
oxide on the anticancer activity of the topoisomerase-active drugs etoposide and adriamycin in human melanoma cells. J Pharmacol Exp Ther. 2013;347(3):607–14.
40. Jain RK. Normalization of tumor vasculature: an emerging concept in antiangiogenic therapy. Science. 2005;307(5706):58–62.
Submit your next manuscript to BioMed Central and take full advantage of:
• Convenient online submission • Thorough peer review
• No space constraints or color figure charges • Immediate publication on acceptance
• Inclusion in PubMed, CAS, Scopus and Google Scholar • Research which is freely available for redistribution
Submit your manuscript at www.biomedcentral.com/submit