HAL Id: tel-01238905
https://tel.archives-ouvertes.fr/tel-01238905
Submitted on 7 Dec 2015HAL is a multi-disciplinary open access
archive for the deposit and dissemination of sci-entific research documents, whether they are pub-lished or not. The documents may come from teaching and research institutions in France or
L’archive ouverte pluridisciplinaire HAL, est destinée au dépôt et à la diffusion de documents scientifiques de niveau recherche, publiés ou non, émanant des établissements d’enseignement et de recherche français ou étrangers, des laboratoires
through a description based on nonlocal intensity factors
Claudio Montebello
To cite this version:
Claudio Montebello. Analysis of the stress gradient effect in Fretting-Fatigue through a description based on nonlocal intensity factors. Solid mechanics [physics.class-ph]. Université Paris-Saclay, 2015. English. �NNT : 2015SACLN019�. �tel-01238905�
NNT : 2015SACLN019
THESE DE DOCTORAT
DE L’UNIVERSITE PARIS-SACLAY,
préparée à l’École Normale Supérieure de Cachan
ÉCOLE DOCTORALE N° 579
Sciences mécaniques et énergétiques, matériaux et géosciences (SMEMAG)
Spécialité de doctorat : Mécanique
Par
M. Claudio Montebello
Analysis of the stress gradient effect in Fretting-Fatigue through a description
based on nonlocal intensity factors
Thèse présentée et soutenue à Cachan, le 26 novembre 2015 : Composition du Jury :
M. Yves Nadot, Professeur, ENSMA Poitiers, Président du jury M. Daniel Nelias, Professeur, INSA Lyon, Rapporteur
Mme Marie-Christine Baietto, Directrice de Recherche - CNRS, INSA Lyon, Rapporteur
M. David Hills, Professeur, University of Oxford, Examinateur M. Yoann Guilhem, Maître de Conférences, ENS Cachan, Examinateur Mme S. Pommier, Professeure, ENS Cachan, Directrice de thèse
I would like to take this opportunity to sincerely thank all the people with whom I had the opportunity to work at the LMT-ENS Cachan and at SNECMA Villaroche. I spent a great time there, in a challenging environment, working on a project that passionates me. When I decided to pursue a PhD I knew that the road would have been long and arduous. Luckily, in these three years, I encountered a lot of amazing people that contribute to make my research work much easier.
I would like to sincerely thank all the members of the jury for the interest showed in my work. Their questions and remarks undoubtedly contribute to increase the quality of the manuscript.
My sincere thanks need to be addressed to Sylvie Pommier, my PhD advisor. Her support, her suggestions and her always positive attitude have been extremely important to perform my work in the best possible conditions.
Similarly, I have really appreciated the possibility to have a constant interaction with my industrial advisors at Snecma. A special thanks goes to Jean Meriaux; he is at the origin of the project on which I worked, but more than that, he has always been ready to help me whenever I had a problem. I cannot forget Julien Leroux, Karim Demmou and Nathalie Serres; all of them have been really kind and helpful.
I would like to thank all of my present and former colleagues at the LMT-ENS Cachan: Amaury, Matteo, Enrico, Andrea, Ionut, Maxime and all the others for the great times we had.
Last but not least, a big thanks to Manon and my family for unconditionally supporting me during these three years.
List of Figures v
List of Tables xi
Nomenclature xiii
Introduction 1
1 Industrial Context and State of the Art 5
1.1 Industrial context . . . 7
1.1.1 Turbofan . . . 8
1.1.2 Connection between disk and blade root . . . 10
1.1.3 In-flight loading condition experienced at contact interfaces . . 12
1.1.4 Snecma dimensioning process . . . 13
1.1.5 Industrial objectives . . . 14
1.2 Fretting-fatigue modeling . . . 16
1.2.1 Historical review . . . 16
1.2.2 Fretting-fatigue test geometries . . . 20
1.2.3 Fretting-fatigue test apparatus . . . 22
1.2.4 Slip quantification for transition criteria . . . 25
1.3 Damaging mechanisms in fretting-fatigue . . . 27
1.3.1 Fretting map . . . 28
1.3.2 Crack initiation . . . 28
1.3.3 Crack propagation . . . 32
1.3.4 Crack arrest . . . 35
1.3.5 Fretting-fatigue peculiarities . . . 37
1.4 Life prediction criteria . . . 40
1.4.1 Crack initiation prediction criteria . . . 41
1.4.2 Life prediction criteria . . . 45
1.5 Scientific challenges . . . 47
2 Nonlocal description of the fretting-fatigue problem 51 2.1 Background . . . 53
2.3 Contact mechanics and FE computation . . . 57
2.3.1 Stick-slip evolution for plain fretting . . . 58
2.3.2 Stick-slip evolution for fretting-fatigue . . . 61
2.3.3 Stress field computation in the substrate . . . 62
2.3.4 FE model details . . . 64
2.4 Nonlocal stress intensity factor computation . . . 65
2.4.1 Selection of the reference fields . . . 66
2.4.2 Normalization of the reference fields . . . 67
2.4.3 Nonlocal intensity factor computation . . . 69
2.4.4 Evolution of the intensity factors during fretting-fatigue . . . . 71
2.5 Influence of the contact geometry on the reference functions . . . 74
2.6 Sensitivity analysis . . . 76
2.6.1 Influence of the size of the extraction zone . . . 78
2.6.2 Influence of the mesh size . . . 81
2.6.3 Influence of the mesh type . . . 84
2.7 Chapter highlights . . . 85
3 Application of the approach to fretting-fatigue test data 89 3.1 Application strategy . . . 91
3.2 Experimental data . . . 92
3.2.1 Test apparatus . . . 93
3.2.2 Ti-6Al-4V . . . 93
3.2.3 Inconel 718 . . . 95
3.2.4 35NiCrMo16 low-alloyed steel . . . 96
3.3 Application of the approach . . . 98
3.3.1 Gross slip frontier . . . 99
3.3.2 Plain fretting . . . 102
3.3.3 Fretting-fatigue . . . 104
3.4 Influence of the friction coefficient variation . . . 107
3.5 Chapter highlights . . . 110
4 Crack initiation prediction criteria 111 4.1 Crack initiation frontier prediction strategy . . . 113
4.2 Multiaxial fatigue criteria . . . 113
4.2.1 From velocity field to stress field . . . 113
4.2.2 Reference field interpolation . . . 114
4.2.3 Computation of the strain and stress field . . . 118
4.2.4 Application of the multiaxial fatigue criteria . . . 123
4.3 Fracture mechanics approach . . . 139
4.4 Chapter highlights . . . 142 Conclusion and perspectives 145 A Karhunen-Loeve transform 151
1.1 (a) LEAP; (b) SaM146. . . 8 1.2 Turbofan schematic. . . 9 1.3 (a) Disc-blade dovetail type joint; (b) disc-blade fir-tree type joint. . 10 1.4 (a) CFM56-7B fan blade hub; (b) disc-blade connection load
compo-nents. . . 11 1.5 (a) Airbus A380-842 disc failure; (b) section of the IP turbine disc;
(c) damages resultant from disc failure, [ATSB, 2010]. . . 12 1.6 In-flight relative displacement at the contact interface, [Mary, 2009]. . 12 1.7 Evolution of the stress tensor at the contact surface and far from it
as a function of the contact status, i.e. stick or stick-slip. . . 13 1.8 FE model of the blade root attachment. . . 14 1.9 Stress distribution at the blade root / disc contact surface, [Ferr´e et al.,
2013]. . . 15 1.10 Effect of relative slip on fretting-fatigue strength, [Nishioka and
Hi-rakawa, 1969a]. . . 18 1.11 (a) Fretting-fatigue S-N curves for aluminium alloy 2014A in the
fully aged condition; (b) fretting-fatigue S-N curves for stainless steel EN58A in the annealed condition, [Waterhouse et al., 1983]. . . 19 1.12 (a) Schematic of the dog bone specimen/cylindrical pad configuration;
(b) fretting-fatigue apparatus, [Ara´ujo and Castro, 2012]. . . 21 1.13 (a) Schematic representation of the loading at the interface disc/blade
root; (b) dovetail blade root test apparatus [Rajasekaran and Nowell, 2006]. . . 22 1.14 (a) Fretting-fatigue single actuator machine; (b) Fretting-fatigue
dou-ble actuator machine, [Lee and Mall, 2004]. . . 23 1.15 Geometrical and load simplifications in fretting-fatigue tests. . . 24 1.16 Transition between fretting regime and reciprocal sliding, [Meriaux,
2010, Mary, 2009]. . . 25 1.17 Transition criteria in fretting regimes, [Fouvry et al., 1996]. . . 26 1.18 Loading conditions described by the term fretting-fatigue, [Hills and
1.19 (a) Relation between slip amplitude and wear rate, [Vingsbo and S¨oderberg, 1988]; (b) material response fretting map, [Fouvry et al.,
1996]. . . 29
1.20 (a) Stress concentration at the contact surface; (b) fretting scar and crack initiation, [Proudhon et al., 2006]. . . 30
1.21 Different crack propagation stages under plain fretting. . . 30
1.22 Quantitative analysis of a 3D fretting crack morphology by X-ray tomography: evolution of the nucleation and propagation angles ϑi, ϑp and ϑs measured inside the material along the specimen thickness, [Proudhon et al., 2007]. . . 31
1.23 Crack loading modes. . . 32
1.24 Typical fracture mechanics fatigue crack propagation behavior. . . 34
1.25 Kitagawa-Takahashi diagram, [Miller, 1993b]. . . 35
1.26 (a) Crack length evolution in function of the number of cycles under plain fretting, P0,max= 700 MPa, Qmax = 280 N/mm; (b) maximum crack length in function of Qmax, [Kubiak, 2006]. . . 36
1.27 Short crack arrest schematic representation [Kubiak, 2006]. . . 37
1.28 Different crack propagation stages under fretting-fatigue. . . 38
1.29 Illustration of the fretting-fatigue mapping concept defined for partial slip condition, [Fouvry and Kubiak, 2009]. . . 39
1.30 Fretting-fatigue Map, (P = 227 N/mm, p0 = 450 MPa (a): AISI 1034/52100 (Radius pad = 40 mm); (b) Ti-6Al- 4V/52100 (Radius pad = 30 mm), [Fouvry and Kubiak, 2009]. . . 40
1.31 Experimental crack initiation boundaries in term of maximum local quantities for Inconel 718 in plain fretting as a function of the pad radius [Amargier et al., 2010]. . . 44
1.32 Schematic representation of the radial shape process volume, [Proud-hon et al., 2005]. . . 45
1.33 Evolution of the crack tip stress intensity factors for plain fretting and fretting-fatigue, [de Pannemaecker et al., 2015]. . . 46
1.34 (a) Typical fretting-fatigue mark on an unbroken specimen, [Bellecave et al., 2014]; (b) stress gradient evolution for two plain fretting test with different pad radii. . . 48
1.35 (a) Wear on the internal part of a CFM56-3A fan root; (b) fretting-fatigue scar; (c) cracks initiation sites. . . 49
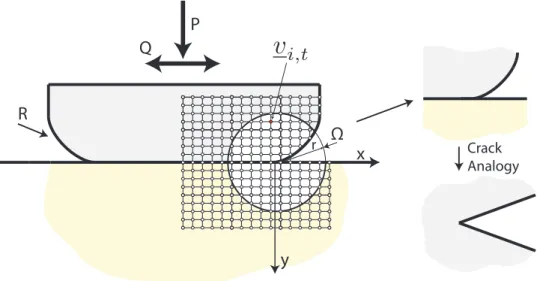
2.1 Crack analogue approach (flat punch over planar surface), [Giannakopou-los et al., 1998]. . . 53
2.2 (a) Illustration of the different scales in fracture mechanics ;(b) refer-ence frame attached to the crack tip T, [Fremy et al., 2012]. . . 55
2.3 Reference frame (R′) attached to the contact tip in which the velocity field (Equation 2.8) is defined. . . 56
2.4 Schematic representation of cylinder-plane contact configuration under
fretting-fatigue. . . 59
2.5 Evolution of the stick-slip zone as a function of the tangential force for cylinder plane configuration in plain fretting. . . 60
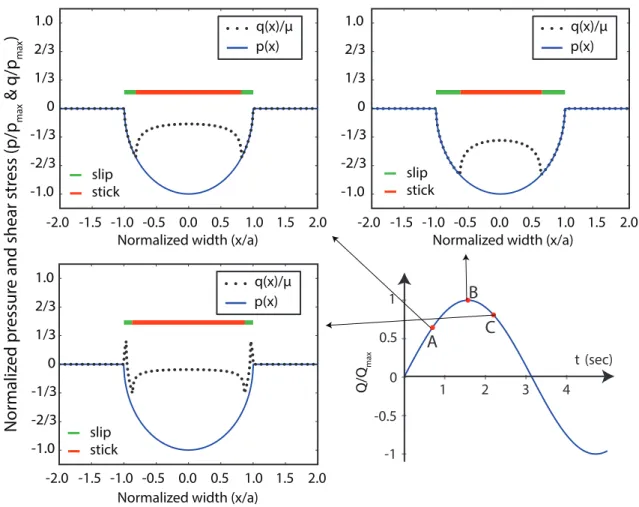
2.6 Illustration of Mindlin surface shear distributions generated in partial slip cylinder/plane contact under plain fretting and fretting-fatigue loading conditions, [Fouvry et al., 2014]. . . 62
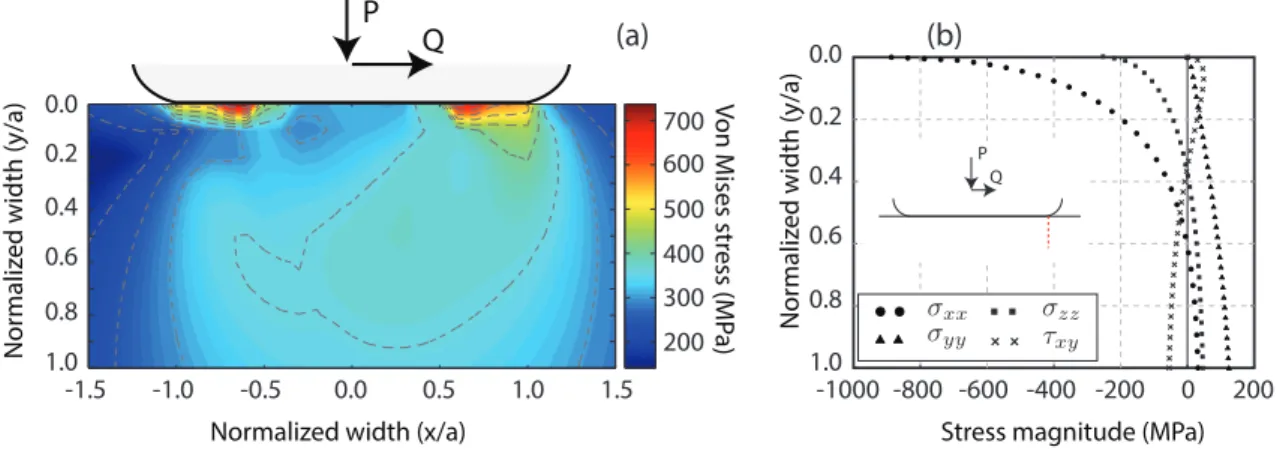
2.7 (a) Von Mises stress distribution in the substrate; (b) Stress tensor evolution as a function of the normalized depth. . . 64
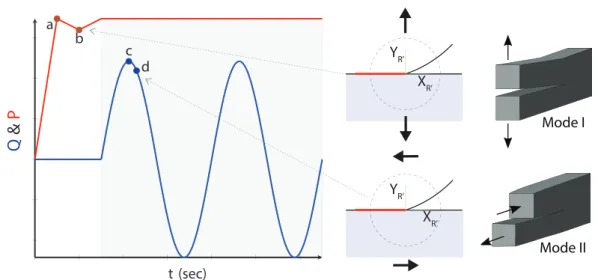
2.8 FEM parameters and loading evolution used. . . 65
2.9 Extraction of the velocity field over a circular zone centered at the contact edge. . . 66
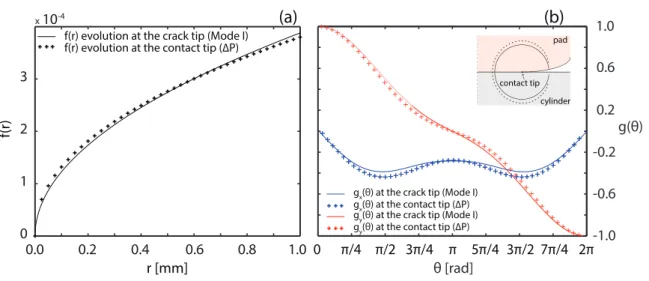
2.10 Different steps in the FE computation to extract the reference fields. 67 2.11 (a) Comparison between radial evolution of ds and radial evolution of the displacement field at the crack tip (mode I); (b) Comparison between tangential evolution of ds and tangential evolution of the displacement field at the crack tip (mode I). . . 68
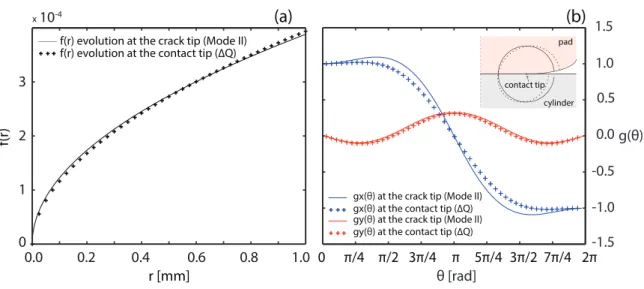
2.12 (a) Comparison between radial evolution of da and radial evolution of the displacement field at the crack tip (mode II); (b) Comparison between tangential evolution of da and tangential evolution of the displacement field at the crack tip (mode II). . . 69
2.13 (a) Error evolution introduced by the approximation; (b) evolution of the stick-slip region during fretting-fatigue cycle; (c) cyclic tangential load, Q. . . 70
2.14 (a) Radial evolution of dc; (b) (++) evolution of gc(ϑ) applied on a circle around the contact tip. . . 72
2.15 Evolution of Ia and Is during a plain fretting FE simulation. . . 73
2.16 Evolution of Ia and Ic during a plain fretting FE simulation. . . 73
2.17 Schematic representations of the steps of the algorithm: (−→) classic path, (−→) the re-computation of the reference fields is skipped. . . . 75
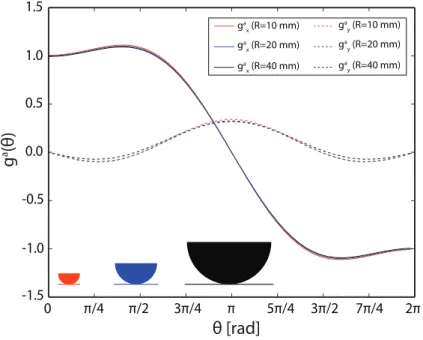
2.18 Comparison of ga(ϑ) for different geometries characterize by a change in pad radius. . . 76
2.19 Comparison of gs(ϑ) for different geometries characterize by a change in pad radius. . . 77
2.20 Comparison of gc(ϑ) for different geometries characterize by a change in pad radius. . . 77
2.21 Plane/plane contact configuration with rounded edges. . . 78
2.22 Schematic representation of the sensitivity analysis concerning the effect of the variation of the size of the extraction zone, Ω. . . 79
2.23 Nonlocal intensity factor as a function of radius. . . 80
2.24 Error evolution as a function of radius. . . 80
2.25 Mesh employed in the FE computations. . . 81
2.27 Error evolution as a function of the mesh size. . . 84 2.28 Nonlocal intensity factor as a function of the mesh size and element
type: CPE3 (linear triangular element), CPE4R (linear quadrilateral element), CPE6M (quadratic triangular element) CPE8R (quadratic quadrilateral element). . . 85 2.29 Error evolution as a function of the mesh size and element type:
CPE3 (linear triangular element), CPE4R (linear quadrilateral el-ement), CPE6M (quadratic triangular element) CPE8R (quadratic quadrilateral element). Example of triangular and quadrilateral meshes for a configuration corresponding to 10 elements for half-contact width. 86 3.1 Different steps in the application of the methodology developed in
Chapter 2. . . 92 3.2 (a) Plain fretting; (b) fretting-fatigue test apparatus. . . 93 3.3 (a) Crack initiation frontiers in plain fretting for different contact
configurations; (b) evolution of the crack initiation frontiers in fretting-fatigue for two different radii (σB(R = 0.01)), TI-6Al-4V. . . 94
3.4 (a) Crack initiation frontiers in plain fretting for different contact configurations , Inconel 718. . . 95 3.5 (a) Crack initiation frontiers in plain fretting for different contact
configurations; (b) evolution of the crack initiation frontiers in fretting-fatigue for two different radii, 35NiCrMo16 low-alloyed steel. . . 97 3.6 (a) Evolution of the gross slip limit in nonlocal coordinates for different
Coulomb’s friction coefficients and different geometries (Table 3.5); (b) relation between local and nonlocal friction coefficient (35NiCrMo16 low-alloyed steel). . . 101 3.7 (a) Evolution of the gross slip limit in nonlocal coordinates for different
Coulomb’s friction coefficients and different geometries; (b) relation between local and nonlocal friction coefficient (TI-6Al-4V). . . 101 3.8 (a) Evolution of the gross slip limit in nonlocal coordinates for different
Coulomb’s friction coefficients and different geometries; (b) relation between local and nonlocal friction coefficient (Inconel 718). . . 102 3.9 Nonlocal crack initiation boundaries for Inconel 718 in plain fretting. 103 3.10 Nonlocal crack initiation boundaries for Ti-6Al-4V in plain fretting. . 103 3.11 Nonlocal crack initiation boundaries for 35NiCrMo16 low-alloyed steel
in plain fretting. . . 104 3.12 Nonlocal crack initiation boundaries evolution with the introduction
of a cyclic bulk load, σB, for 35NiCrMo16 low-alloyed steel in
fretting-fatigue. . . 105 3.13 Nonlocal crack initiation boundaries evolution with the introduction
of a cyclic bulk load, σB, for Ti-6Al-4V in fretting-fatigue. . . 106
3.15 (a) Variable displacement method to compute the friction coefficient (b) evolution of the friction coefficient as a function of contact radius
and maximum Hertzian pressure, [Fouvry et al., 2014]. . . 108 3.16 Variation of the crack initiation frontiers as a function of the friction
coefficient for TI-6Al-4V. . . 109 4.1 Crack analogue approach, 0 ≤ ϑ ≤ 2π. . . 115 4.2 (a) Comparison between radial evolution of ds and radial evolution
of the displacement field at the crack tip (mode I); (b) Comparison between tangential evolution of ds and tangential evolution of the displacement field at the crack tip (mode I). . . 116 4.3 (a) Comparison between radial evolution of da and radial evolution
of the displacement field at the crack tip (mode II); (b) Comparison between tangential evolution of da and tangential evolution of the displacement field at the crack tip (mode II). . . 116 4.4 Interpolation of gs(ϑ). . . 119
4.5 Interpolation of ga(ϑ). . . 119
4.6 Comparison between the evolution of σxx,F F at the contact front and
σxx,CT at the crack tip (FF: fretting fatigue, CT: crack tip). . . 121
4.7 Stress field re-construction by using the nonlocal intensity factors (FE parameters: plain-fretting analysis, Pad radius = 20 mm, friction coefficient = 1.0, Young’s modulus = 119 400 MPa, Poisson’s ratio = 0.3, P = 347 N mm−1 and Q* = 237 N mm−1), IF: intensity factors,
FE: finite elements. . . 122 4.8 Schematic view of the different steps in the application of the modified
W¨ohler Curve Method, [Ara´ujo et al., 2007]. . . 125 4.9 (a) Material plane and normal and tangential components of the stress
tensor projection; (b) rectangular hull with orientation bounding the shear stress path ψ, [Ara´ujo et al., 2011]. . . 128 4.10 Crack initiation frontier obtained by applying the modified W¨ohler
curve method to the nonlocal crack initiation map for Ti-6Al-4V. . . 130 4.11 Crack initiation frontier obtained by applying the modified W¨ohler
curve method to the nonlocal crack initiation map for Inconel 718. . . 131 4.12 Crack initiation frontier obtained by applying the modified W¨ohler
curve method to the nonlocal crack initiation map for 35NiCrMo16 low-alloyed steel. . . 131 4.13 Crack initiation frontier obtained by applying the Crossland criterion
to the nonlocal crack initiation map for Ti-6Al-4V. . . 134 4.14 Crack initiation frontier obtained by applying the Crossland criterion
to the nonlocal crack initiation map for Inconel 718. . . 134 4.15 Crack initiation frontier obtained by applying the Crossland criterion
4.16 Schematic representation of the assumption made to decouple the effect of the plain fretting loading to the cyclic bulk force. . . 136 4.17 (a) Evolution of Ia
max as a function of σB in a situation where no
tangential force, Q, is applied as described in Figure 4.16b; (b) Predic-tion of the experimental data by applying the assumpPredic-tion presented in Equation 4.86. . . 137 4.18 Tridimensional crack initiation frontier obtained by applying the
mod-ified W¨ohler curve method to the nonlocal crack initiation map for Ti-6Al-4V. . . 138 4.19 Tridimensional crack initiation frontier obtained by applying the
Cross-land criterion to the nonlocal crack initiation map for Ti-6Al-4V. . . 139 4.20 (a) Kinked crack; (b) Fretting-fatigue analogue problem. . . 140 4.21 Comparison between different strategies to predict the crack initiation
frontier location. . . 142 5.1 Details of a 3D cylinder-plane contect FE model, used to extract the
nonlocal intensity factors. . . 148 5.2 (a) Triaxiality variation as a function of the specimen width, d; (b)
Nonlocal intensity factor variation as a function of the specimen width.149 5.3 Schematic representation of the nonlocal intensity factor extraction
process applied to an industrial component. . . 150 A.1 Example of the utilization of the POD technique to reduce the image
size. . . 154 A.2 Evolution of the error in the POD approximation as a function of the
3.1 Mechanical properties of Ti-6Al-4V used in [Ferr´e et al., 2013]. . . 94 3.2 Mechanical properties of Inconel 718 used in [Amargier et al., 2010]. . 96 3.3 Mechanical properties of 35NiCrMo16 low-alloyed steel. . . 96 3.4 Test data for 35NiCrMo16 low-alloyed steel presented in [Fouvry et al.,
2014] (PF: plain fretting, FF: fretting-fatigue), number of cycles = 106. 97
3.5 Gross slip frontier evolution in nonlocal quantities for 35NiCrMo16 low-alloyed steel. . . 100 3.6 Variation of the ratio between local and nonlocal friction coefficient
as a function of the material considered. . . 100 4.1 Coefficient values allowing to interpolate gs(ϑ) and ga(ϑ) and the ones
obtained for crack-tip displacement field in mode I and mode II. . . . 118 4.2 Percentage relative error between the stress tensor at the contact edge
and at the crack tip for ϑ = 3/2π. . . 122 4.3 Calibration values used for the modified W¨ohler curve method and
the Crossland criterion, lref: normalization length for confidentiality
issue. . . 133 4.4 Location of the initiation frontier following a fracture mechanics
Abbreviations:
LEFM Linear Elastic Fracture Mechanics Ys Yield Strength
UTS Ultimate Tensile Strength Symbols:
ds(x) Symmetric spatial reference field da(x) Antisymmetric spatial reference field dc(x) Complementary spatial reference field Is(t) Intensity factor (symmetric part) Ia(t) Intensity factor (antisymmetric part)
Ic(t) Intensity factor (complementary part)
Is
max Maximum value of the intensity factor (symmetric part) over a cycle
Ia
max Maximum value of the intensity factor (antisymmetric part) over a
cycle Ic
max Maximum value of the intensity factor (complementary part) over
a cycle
v(x, t) Velocity field expressed in the reference frame attached to the con-tact edge
qmax Maximum tangential shear stress at the contact surface
p0 Maximum normal pressure at the contact surface
P Linear normal force applied to the cylinder pad
Q Fretting linear tangential force applied to the cylinder pad Q* Fretting linear tangential amplitude
δ Fretting displacement
σB Maximum fatigue stress amplitude
∆K Stress intensity factor range
f (r) Radial evolution of the spatial reference field g Tangential evolution of the spatial reference field ξe(t) Error of the elastic approximation
ξtot(t) Error of the total approximation
µ Coulomb friction coefficient ˜
Aerospace structures are usually designed to operate for a long period of time (30-40 years and sometimes even more) assuring the same level of safety all lifelong. In this context, fatigue problems are the most common way of failure, as shown by the rare accidents occurred in the past.
The aircraft engines do not escape this fact. In the case of Snecma, among the different research area where the company is currently active, one in particular is becoming more and more important which is fretting-fatigue.
This phenomenon concerns all the engineering assemblies subjected to vibrational loading. Microsliding is experienced over part of the contact interface, which will damage the surface, leading to crack initiation very early in the life of the compo-nents. The disc-blade root attachment of the turbofan engine is the perfect spot for observing fretting-fatigue related damage. This is the reason why Snecma has funded an important research campaign intending to improve the understanding of fretting-fatigue with a direct consequence on the company procedures in terms of dimensioning rules and methodologies.
The main challenges from a scientific and industrial standpoint are the following ones:
• Ameliorate the existent numerical methods capable to predict the knockdown factor introduced by fretting-fatigue.
One of the reasons why this phenomenon is particularly difficult to handle is the fact that the contact between the bodies introduces an important stress gradient in the components. The latter has to be taken into account in order to have a good prediction of damaging process.
On the other hand, fretting-fatigue is a highly multiscale phenomenon. For instance, considering the example of the disc-root attachment, its size is some centimeters, the fretting scar observed at the interfaces is limited to some micrometers while the variation of the stress magnitude is already evident some micrometers far form the surface.
Furthermore, the evolution of the stress gradient depends on the geometry of the contact, which makes the results obtained through experimental tests, difficult to transpose to different geometries.
through some kind of model reduction techniques in order to conceive new algorithms that can be used in industrial applications.
In this manuscript a practical solution to overcome the aforementioned challenges is proposed.
A new method to describe the stress gradient effect in fretting-fatigue through nonlocal intensity factors is developed. The interest of the approach comes from the geometry independent nature of the nonlocal intensity factors. Therefore, they can be used to characterize the stress field around the contact edges for any given geometry and represent an objective way to compare experimental results coming from different test campaigns. This description is obtained through nonintrusive post-processing of FE computations and is conceived in order to be easily implementable in an industrial context.
The manuscript is divided into four main chapters:
• Chapter 1. The fretting-fatigue phenomenon is introduced by describing its effects on the industrial applications. Then a focus is done on the turbofan en-gine, explaining in detail its functioning which allows the reader to understand why some components are particularly sensitive to fretting-fatigue damage. In the second part of the chapter, a bibliographic review is presented which has the function to introduce some important concepts. The following topics are addressed: damage mechanism in plain fretting and fretting-fatigue, the different fatigue criteria available in the literature and the effect of the stress gradient.
The chapter ends with a discussion on how the research work presented here is intended to add some new knowledge to the fretting-fatigue research com-munity.
• Chapter 2. A new method to describe the stress gradient effect in fretting-fatigue is presented. By analyzing the mechanical fields in the proximity of the contact edges, it has been possible to extract nonlocal intensity factors that take into account the stress gradient evolution. For this purpose, the kinetic field around the contact ends is partitioned into a summation of multiple terms, each one expressed as the product between nonlocal intensity factors, Is, Ia,
Ic, depending on the macroscopic loads applied to the mechanical assembly,
and spatial reference fields, ds, da, dc, depending on the local geometry of the part.
A sensitivity analysis is performed in order to understand the impact that some key parameters have on the algorithm outcome.
• Chapter 3. The procedure presented in Chapter 2 is applied to fretting-fatigue test data.
In particular, it is shown that is possible to describe the crack initiation mech-anism taking into account the gradient effect, by using the nonlocal intensity factors as reference quantities.
• Chapter 4. Several multiaxial fatigue criteria are coupled to the description of fretting-fatigue through nonlocal intensity factors to obtain an analytical crack initiation frontier, function of common material data such us the pure torsion and the push-pull fatigue limit. By exploiting the description developed to partition the velocity field, the associated stress field is computed which is used as input for the multiaxial fatigue criteria.
Industrial Context and State of
the Art
Fretting occurs every time a junction between components is subjected to oscillating forces or vibrations. At the contact surface a micro relative tangential displacement over part of the interface is experienced. Com-bined with cyclic bulk fatigue loading, the so-called fretting-fatigue is a frequent source of failure constituting a major concern in safety-critical industries such as aerospace or nuclear power generation.
In the first part of this chapter the industrial framework, in which this research has been performed, is presented. Then, the principle of func-tioning of a modern turbofan is introduced, focusing in particular on the reasons why some components may suffer fretting-fatigue problems during the engine lifespan.
In the second part, a more academical description of fretting-fatigue is presented, articulated around a brief review of the major scientific breakthroughs in the comprehension of this phenomenon during the last century. The attention is focused on the damaging process; the crack initiation phase is analyzed as well as the propagation stage which can end with the arrest of the crack or continue until the failure of the part depending on the fretting-fatigue load magnitude. The main fatigue criteria used to predict crack initiation or crack arrest are then listed. The chapter concludes with a discussion on how the research presented in this manuscript may ameliorate the way in which fretting-fatigue is described in relation with the limitations of the existent approaches.
1 Industrial context - 1.1 - Turbofan
- 1.2 - Connection btw disk and blade root - 1.3 - In-flight loading condition ...
- 1.4 - Snecma dimensioning process - 1.5 - Industrial objectives
Chapter 1 - Table of Contents Flowchart
2 FF modeling - 2.1 - Historical review - 2.2 - FF test geometries - 2.3 - FF test apparatus - 2.4 - Slip quantification ... 3 Damaging mechanisms in FF - 3.1 - Fretting map - 3.2 - Crack initiation - 3.3 - Crack propagation - 3.4 - Crack arrest - 3.5 - FF peculiarities 4 Life prediction ... - 4.1 - Crack initiation ... - 4.2 - Life prediction ...
5 Scientific and industrial challanges
Fretting Fatigue in
industrial applications
Fretting Fatigue from an
academic point of view
1.1
Industrial context
Aircraft are among the most complex engineering systems that have been developed. Since the first flight of the Wright brothers in 1903, enormous technological break-throughs have transformed the initial pioneering experience of flight in the safest way to travel.
Despite this “idyllic” portrait of the aviation industry, in-flight failures still occur. In particular, a recent study [Findlay and Harrison, 2002] shows that fatigue-related problems are the cause of almost 60% of the total in-service failures. The most famous ones are probably the two Comet crashes in 1954, both of them caused by explosive cabin decompression. Scrupulous investigations proved that the failure of the pressurized cabin was due to fatigue crack growth initiated at windows caused by square corners that generate a severe stress concentration, [Withey, 1997]. Although serious fatigue failures had occurred before, as discussed in [Williams, 1965], these two accidents clearly demonstrated for the first time the negative impact that fatigue could have on the aviation industry. Since then, fatigue in aircraft structures has been a well-recognized problem with significant implications for transportation safety.
In the last twenty years the attention has been focused on turbofan engines that due to their complexity are the perfect candidates for fatigue failure. A massive research project, National Turbine Engine High Cycle Fatigue (HCF) Science and Technology (S&T) Program, funded by the Air Force, the Navy, and NASA, has started in 1994, aiming at reducing the negative impact that high cycle fatigue has on engine safety, reliability and readiness. An economic quantification of this impact, [Garrison, 2000], shows that it can exceed $400 million per year.
Looking more closely at the reasons of failures in aircraft engines, one in six of all accidents are caused by fretting, [Thomson, 1998]. Fretting occurs every time two contacting bodies are subjected to oscillating forces or vibrations, which give rise to micro relative tangential displacement over part of the interface. Combined with high cycle fatigue loading, the so-called fretting-fatigue has a negative effect on the material fatigue limit [Lindley, 1997], and represents a major concern for engine makers. In this context, Snecma, part of SAFRAN group, has designed and funded an important research campaign, the COGNAC project (COmpetion between the Gradient effect and the scale effect in Notch fatigue And Contact fatigue), intending to improve the understanding of fretting-fatigue with a direct consequence on the company procedures in terms of dimensioning rules and methodologies. This PhD thesis has been performed as a part of this research framework.
In the next section the principle of functioning of a turbofan engine is presented which is followed by a deeper analysis of the mechanism that makes some of the engine components the perfect spot for failures caused by fretting-fatigue.
1.1.1
Turbofan
The turbofan is an air-breathing jet engine widely used in commercial aircraft and business jets due to the high thrust combined with good fuel efficiency. As its name suggests (“turbo”+“fan”), it is composed by a gas turbine which generates mechanical energy from combustion, and a ducted fan that exploits this energy to accelerate the airflow rearwards.
(a) (b)
Figure 1.1: (a) LEAP; (b) SaM146.
The first and the most characteristic component in the engine is the fan, which purpose is to suck air from the outside accelerating it. The amount of air that the fan can handle is enormous considering that at takeoff this value can overcome a ton per second of air. Passing through the fan, the air separates into two streams; only 15/20 per cent of it flows into the internal core of the engine (hot stream) while the remaining 80/85 per cent (cold stream) is ducted along the outside of the core and is forced through a narrowing space which increases its speed (Figure 1.2). The ratio of the air bypassing the core to the air passing through it, is called bypass ratio. Because of its huge volume, the bypass air only needs to accelerate by a small amount in order to develop huge thrust.
The hot stream enters the internal core where two compressor stages, the low-pressure compressor (LPC) and high-low-pressure compressor (HPC), force its temper-ature and pressure to rise. Here the air passes through several smaller stages, each consisting of a set of rotating blades in between a set of stationary blades. Then the air enters the combustion chamber where its energy level is greatly increased by adding fuel through a series of injectors and igniting it. The higher is the pressure of the air the more energy will be added during combustion and the more efficient the process becomes. This is why the compressor stages are so important.
At the exit of the combustion chamber the super heated (the air at this stage can reach 1700 ◦C) and compressed air enters the high-pressure turbine, which has the
purpose to extract enough energy from the air to turn the high-pressure compressor. Then, the hot stream flows into the low-pressure turbine that has the task to power
the low-pressure compressor as well as the large fan thanks to the remaining energy absorbed from the airflow.
Fan LPC HPC CombustionChamber HPT LPT Nozzle
m0, V0 . mf, Vf . mc, Vc . mf, Vf . Hot stream Cold stream
Figure 1.2: Turbofan schematic.
Finally the combusted air races out through the exhausted nozzle at the back of the engine to be accelerated one last time. This exhausted stream produces only 20 percent of the engine total thrust. The remaining 80 percent is produced by the large volume of accelerated bypass air exiting the fan duct.
The description of the principle of functioning of the turbofan helps to realize the complexity of this engineering system. A small amelioration in one of the steps listed above can have a huge impact on the performance. Engine makers like Snecma, are challenged to continuously increase the overall efficiency of their products, in order to remain competitive: a little reduction in the fuel consumption means a considerable saving for airline companies. This optimization can be obtained in different ways:
• a better understanding of the aerodynamics inside the rotating parts can increase the performance of the compressor and turbine stages;
• new materials able to withstand higher temperatures have a positive effect on the thrust and fuel consumption;
• the use of composite materials, as it is the case for the fan of the LEAP engine, allows to reduce the weight of the structure;
• a better comprehension of the material deterioration due to fatigue will reduce maintenance costs.
The last point is the one debated in the research work, presented here, aiming at bringing new knowledge to ameliorate the understanding of fretting-fatigue, reducing in this way the maintenance cost and optimizing the design of the parts concerned by this phenomenon.
1.1.2
Connection between disk and blade root
In the previous section the principle of functioning of a modern turbofan engine has been presented. To sum up, the turbine stages extract the energy from the airflow, exiting the combustion chamber, to turn the compressor and the fan. It is clear, therefore, that the rotating parts play a major role. They usually share a common design configuration: a set of blades attached to a disk that is fitted onto the shaft which is responsible for the transmission of the power from one stage to another.
Concerning the attachment between blade root and disk, different choices can be made to ensure the connection. In Figure 1.3, the most common configurations are shown. The blades are fitted into the disk via a dovetail or a fir-tree connections, that ensure the radial retention of the blade, transmitting at the same time the tangential force to the disk. In addition, they allow the easy insertion and removal of the blades, which represents a fundamental requirement since in case of failure only the damaged blade is replaced with positive consequences in terms of maintenance cost and reliability.
(a) (b)
Figure 1.3: (a) Disc-blade dovetail type joint; (b) disc-blade fir-tree type joint. The strength of this type of connection represents also its weakness. The easy insertion and removal capability requires a small clearance between the dovetail blade root and the corresponding disc surface. Once the engine is switched on the centrifugal force tends to pull apart the joint, generating a normal load that presses the two bodies one against the other while the interaction between the airflow and the blades causes vibrations that propagate up to the contact surface where a relative displacement (δ) is experienced, (Figure 1.4).
The micro-slip is the cause of surface damage which leads to the initiation of embryo cracks very early in life. The initiated cracks can then propagate either in the blade root or in the disc due to the cyclic bulk fatigue loading generated by the centrifugal force. The design of the turbofan is such that the failure of a blade root
(a) (b) Fc Fa P Q P Q
Figure 1.4: (a) CFM56-7B fan blade hub; (b) disc-blade connection load compo-nents.
with consequent detachment of the part can be absorbed entirely by the external structure of the engine, as it was the case for the accident reported in [ATSB, 2002]. On the contrary, the disc failure will inevitably have more serious consequences since its mass coupled with the high rotational speed gives it enough energy to pass through the engine case. The crash of a DC-10 in Sioux City, Iowa, in 1989 or the most recent uncontained engine failure experienced by an A380 in Singapore (Figure 1.5) show the results that this type of malfunctioning can have.
In order to limit the damage at the contact interface between the blade root and the disk some solutions can be adopted:
• the modification of the surface properties through the introduction of a com-pressive residual stress can stop or at least slow down the crack propagation process, [Liu and Hill, 2009, Mall et al., 2011];
• the intercalation of a thin layer of softer material between the contacting bodies works as a shelter preventing the propagation of the damage into the substrate [Fridrici et al., 2003].
The analysis presented in the following sections does not take into account the aforementioned techniques to mitigate the damage at the contact surface. With that said, there are no particular limitations for the introduction of the effects of these palliative techniques inside the methodology developed and this could be the object of future works.
(a) (b) (c)
Fracture face “B” Fracture face “A”
Drive arm fracture
Figure 1.5: (a) Airbus A380-842 disc failure; (b) section of the IP turbine disc; (c) damages resultant from disc failure, [ATSB, 2010].
1.1.3
In-flight loading condition experienced at contact
in-terfaces
The first step in the process of preventing catastrophic failure of the blade root/disc attachment is the knowledge of the exact load spectrum that this part will experience. An accurate estimation, however, is hard to obtain since it is almost impossible to perform in-situ measurements during in-flight service. A first evaluation can be done by simplifying the classic flight mission in three different phases: take off, cruise and landing (Figure 1.6).
t
in-flight vibrations due to aeroelastic effects
engine starts engine switched off
take-off cruise landing
micr os lidin g amplitude (δ) ~100μm
Figure 1.6: In-flight relative displacement at the contact interface, [Mary, 2009]. During the take-off phase the engine starts and the centrifugal force, experienced by the blades, attains its maximum. As a consequence an important displacement is observed at contact interface (50 - 100 µm). Once the aircraft reaches its cruise altitude the rotational speed of the turbofan remains almost constant as well as the centrifugal force. This phase of the flight is characterized by high frequency vibrations caused by the interaction between the airflow and the blades resulting in
micro-displacement over part of the contact interface (≃10 µm). Finally at the end of the landing phase, the engine is switched off and the loads fall to zero.
To sum up, the connection between blade root and disc experiences two types of fatigue loading:
i) low cycle fatigue (LCF) loads that characterize take-off and landing;
ii) high-cycle fatigue (HCF) loads caused by high frequency vibrations that are predominant during cruise.
Fretting-fatigue is generated by the coupling between this two type of loading; the high frequency vibrations produce micro-displacements over part of the contact interfaces damaging the surface and promoting the initiation of cracks (fretting) while the fatigue loads, generated by the cyclic variation of the centrifugal force, play an important role in the crack propagation.
A more detailed analysis of the contact status at the interface between the disk and the blade root, highlights the presence of a central zone where the two bodies are in stick condition, surrounded by a second zone in the proximity of the contact edges where slip is experienced (Figures 1.7). The discontinuity at the transition between stick and partial slip zone creates a strong stress concentration. Furthermore, the influence of the contact rapidly vanishes as soon as we move away from the surface, thus a steep stress gradient is observed.
Fc Fa P Q x z p0 qmax p q Stress peak stick zone stick slip zone τxy -z P Q
Evolution of the stress field far from the contact surface.
--> Stress gradient
Evolution of the stress field on the contact surface.
--> Stress peak at the stick-slip transition zone
Figure 1.7: Evolution of the stress tensor at the contact surface and far from it as a function of the contact status, i.e. stick or stick-slip.
1.1.4
Snecma dimensioning process
As previously mentioned, it is difficult to obtain the exact load distribution and evolution experienced by the blade root/disc connection during flight. Numerical
computations are therefore employed to enrich the data obtained through experimen-tal tests. For this purpose, finite element models are extensively used to compute the quantities - stress, strain or displacement - used for the dimensioning process of the part as well as for its optimization. By simulating the aerodynamic interaction be-tween the blades and the airflow and the effects of the centrifugal force, it is possible to estimate the mechanical loads arising in the structure. For instance, this type of computation permits to compute the relative displacement between the contacting bodies.
Figure 1.8: FE model of the blade root attachment.
The drawback of this procedure relies on the sensitivity of the results obtained to the level of mesh refinement. A fine mesh (few micrometers) is needed to obtain a convergent solution of the stress distribution at the contact interface (Figure 1.9). This requirement, however, is in conflict with the need of fast computations that can be used for dimensioning purposes. A compromise is therefore reached in order to obtain a sufficiently precise result, minimizing the computational cost.
To ensure the robustness of the procedure a safety factor is applied to the results obtained.
One of the objects of the work presented here is to provide a solution at the “precision vs computational cost” problem. This is possible through a multiscale
description of fretting-fatigue that will be presented in the next chapter.
1.1.5
Industrial objectives
The work presented in this manuscript is part of a research framework started by Snecma in 2010, the COGNAC project (COmpetion between the Gradient effect
Confidential
Figure 1.9: Stress distribution at the blade root / disc contact surface, [Ferr´e et al., 2013].
and the scale effect in Notch fatigue And Contact fatigue), aiming at better un-derstanding the gradient effect with respect to crack initiation and propagation in fretting-fatigue. Several questions on how to deal with this phenomenon remain open and need to be answered:
• For a contact condition characterized by the presence of a partial slip zone over part of the surface, the discontinuity between the stick and the slip zone introduces a singularity at the origin of a strong stress concentration (Figure 1.7).
For industrial applications, usually, a 3D FE model is employed to compute the stress distribution at the contact surface. However, due to the presence of the stress concentration factor, to obtain a convergent solution a fine mesh is needed (few micrometers) close to the transition zone. For industrial applications, this requirement is difficult to respect since the computational cost would be too high .
It is therefore important to develop prediction tools which use as input quan-tities that are easier to obtain than the local stresses. This is particularly true for applications characterized by complicate geometries.
• The influence of the contact rapidly vanishes far from the surface. The microc-racks, initiated at the interface can therefore stop as a result of the decreasing stress tensor value which is no more sufficient to promote crack growth. In addition, for the same stress value at the contact surface, different geometries generate different stress gradient evolutions with a direct effect on the fatigue life of the part. Therefore, an analysis based on local quantities (maximum contact pressure, p0, and shear stress amplitude, qmax) will produce outcomes
depending not only on the material of the contacting bodies but also on the geometry of the experimental setup.
This is a major problem for Snecma, because it makes the experimental data obtained on laboratory test machines almost unusable for dimensioning pur-poses since the scale of these specimens are usually very different from the real industrial part.
A local approach is not sufficient to describe properly the effect of the stress gradient.
• The material volume interested by a stress level able to cause fatigue damage is low and comparable to the grain size. As a consequence fatigue life scatter and size effect are observed which are linked to the probability of encountering a favorable site for crack initiation.
Regarding the research framework in which this work has been performed, three other PhD thesis have been funded on complementary subjects with the aim to achieve a breakthrough in the understanding of fretting-fatigue. In particular, Johan Bellecave, and Barabara Ferry are performing their research in collaboration between the LMT laboratory in Cachan and the university of Brasilia under the supervision of Sylvie Pommier and Alex Ara´ujo. Their works focus on the experimental investigation of the competition between gradient effect and size effect in fretting-fatigue. The fourth PhD thesis is performed at Pprime, by Julien Simon and supervised by Yves Nadot. The aim in this case is to study the effect of the stress gradient in v-notch specimens focusing on the similarities with fretting-fatigue.
The 4 thesis are linked by the challenge to reproduce accurate results concerning initiation, propagation or fatigue life prediction in fretting-fatigue just by using data coming from experimental tests performed on v-notch specimens. These tests are relatively simple and cheap compared to the ones needed for fretting-fatigue. If this possibility is confirmed, it will represents an important result.
1.2
Fretting-fatigue modeling
1.2.1
Historical review
Historically, the first authors reporting fretting related effects were Eden, Rose and Cunningham in a scientific article published in 1911, [Eden et al., 1911]. Despite the initial object of their research was to determine the effect of rotational speed on the W¨olher curve of a steel specimen using a rotating beam apparatus, they observed the formation of oxide debris in the steel grips of the testing machine. This curious phenomenon was the object of further investigations in the work of Tomlinson, [Tomlinson, 1927], who designated a test apparatus to produce small amplitude relative movement between two contacting bodies. He concluded that the resultant “brown stain” appearing on the surfaces was related to the tangential motion between the two parts.
Meanwhile fretting side effects started to be observed in industrial applications. Almen [Almen, 1937] performed some research at General Motors on false brinelling as a response to severe wheel bearing damage observed in automobiles that were transported by ship or train before to be delivered. The conclusion was that the vibrations caused during the transportation were at the origin of the damage.
The first big step forward in the understanding of fretting is accomplished thanks to the work of Tomlinson and his colleagues [Tomlinson et al., 1939] that in 1939 published a paper that introduced some fundamental concepts. In particular it is shown that the corrosion observed has mechanical origins rather than chemical ones, and in addition it is recognized that slip - the tangential relative motion over part of the contacting surfaces - is the sine qua non of surface damage appearance. Furthermore, the authors suspected a relation between the fretting damage spot and the crack initiation site. Lastly, it is in this paper that the term“fretting corrosion” was employed for the first time.
The appreciable loss in fatigue properties caused by fretting was confirmed in [Warlow-Davies, 1941]. The author performed a series of tests where the specimens experienced first a fretting load in order to create the classic fretting scar on the surfaces, and later the same specimens were inserted in a fatigue machine. By this means, the negative effect of fretting can be quantified by measuring the percentage loss in fatigue strength with respect to the unfretted specimen. The tests were performed for a medium carbon steel and for a nickel-chromium-molybdenum alloy steel showing a fatigue strength reduction of around 13 and 18 per cent, respectively.
Similar results were obtained by [McDowell, 1952, Fenner and Field, 1958]. The first showed that the conjunction of fretting and fatigue produce fatigue strength reduction factors up to 5, while the second proved that fretting works as a catalyst for the crack initiation process observing that the reduction effect was related to the slip magnitude. Fenner showed that the fatigue strength of an aluminum alloy decreases progressively with the increase of the size of the partial slip zone up to 10 µm.
Despite the first scientific and technical breakthroughs, at that time, fretting was still an obscure subjects for engineers. I find amusing what (Sir) Stanley Hooker (assistant chief engineer of Rolls-Royce Ltd) said about Warlow-Davies, [Sharman,
2002], who works under his direction from 1942 to 1946:
“No scratch or frettage was too microscopic to escape his attention, and he possessed the sixth sense of being able instantly to recognize whether such a mark would lead
to a dangerous failure”.
Be able to recognize whether a fretting scar was dangerous or not for the mechanical integrity of the part was seen as a magical sixth sense capability!
In the last 50 years an increasing interest on fretting-fatigue has driven a lot of researchers towards important advancements in the discipline. Among the most relevant works, it is worth mentioning the series of papers published by Nishioka and Hirakawa, [Nishioka et al., 1968, Nishioka and Hirakawa, 1969a, Nishioka and Hirakawa, 1969b, Nishioka and Hirakawa, 1969c, Nishioka and Hirakawa, 1969d,
Nishioka and Hirakawa, 1972]. The authors recognized the importance of the slip magnitude in the determination of the damage caused by fretting-fatigue. They focused their attention on press-fitted axles assemblies analyzing the effect of various factors such as size, shape, clamping pressure, magnitude of nominal stresses, on the amplitudes of the relative slip.
They noticed that the damage produced was not proportional to the slip mag-nitude, in particular, when the relative slip becomes larger than a certain value (in their case 25 microns) the alternating tangential stress to apply in order to observe crack initiation increases. Once the micro-cracks initiate they are soon worn out. This observation will be confirmed and validated some years later by Vingsbo and S¨oderberg, [Vingsbo and S¨oderberg, 1988], who defined three regimes: stick regime, mixed stick-slip regime and gross slip regime, as a function of the damage produced. Furthermore, they observed that the cracks usually started in the zone where the stress concentration due to contact is the highest one, (at the contact edges) with an angle inclined towards the center of the contact zone, which is found to be the direction which maximizes the shear stress.
Broken with other surface cracks Cracked Not cracked Broken 0 10 20 30 40 50 0 10 20 30 40 76 Relative Slip mmx10-3 A lt er na ting S tr ess K g/mm 2
( I )
( II )
( III )
( IV )
( V )
Figure 1.10: Effect of relative slip on fretting-fatigue strength, [Nishioka and Hi-rakawa, 1969a].
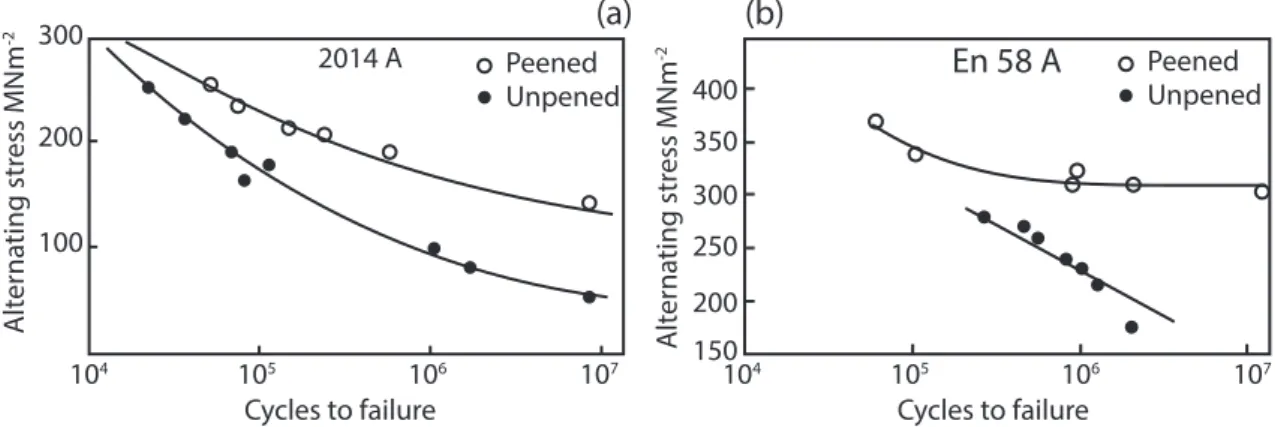
During the Seventies, on the one hand, an increasing number of papers are published focusing on better understanding the fretting-fatigue damage mechanisms, on the other hand, some researchers start addressing the problem of how to efficiently design against fretting-fatigue. It is the case of the papers published by Waterhouse in 1976, [Waterhouse, 1976] and by Hoeppner and Gates in 1981, [Hoeppner and Gates, 1981], where the authors try to give some practical advice in order to avoid fretting-fatigue damage. For instance, the use of lubricant decreases the friction coefficient diminishing the damage at the contact interface. The careful selection of compatible materials, the reduction of the vibrations at the interface in order to limit the slip magnitude, an intelligent design aiming to reduce the stress concentration factors at the contact borders, are some of the advice given by the authors. Furthermore, surface treatments appeared to be one of the best way to avoid or at least to slow down the negative effect of fretting-fatigue as it is proved by the numerous papers that start to be published in those years analyzing this technique, [Waterhouse et al., 1962, Taylor and Waterhouse, 1972, Waterhouse et al., 1983]. In [Waterhouse et al., 1962] the influence of electrodeposited metals on the mechanical response of a mild steel is investigated concluding that the overall effect depends on the balance between the reduction of fretting damage and the negative effect of plating on the fatigue strength of the material. In [Taylor and Waterhouse, 1972] the same type of analysis is carried out, focusing on the effect of sprayed molybdenum coatings. Similar results were obtained. Another possibility to reduce the fretting-fatigue negative effects is to introduce compressive stress on the surface of the part by the use of shoot-peening, [Waterhouse et al., 1983] (Figure 1.11). This last techniques is still used nowadays.
Peened Unpened 100 200 300 A lt er na ting str ess MN m -2 104 105 106 107 Cycles to failure 2014 A En 58 A 150 A lt er na ting str ess MN m -2 200 250 300 350 400 (a) (b) 104 105 106 107 Cycles to failure Peened Unpened
Figure 1.11: (a) Fretting-fatigue S-N curves for aluminium alloy 2014A in the fully aged condition; (b) fretting-fatigue S-N curves for stainless steel EN58A in the
annealed condition, [Waterhouse et al., 1983].
With the publication of Jonhson’s monograph on contact mechanics, [Johnson, 1985], another improvement in the understand of fretting-fatigue mechanism is achieved. Some interesting analytical results concerning stress and strain at the interface between two contacting bodies are derived, enriching the existent
solu-tions presented some decades before in [Hertz, 1882, Cattaneo, 1938, Muskhelishvili, 1953]. Together with this new information on the mechanical fields arising at the contact surface, some authors started to applied fracture mechanics tools to predict fretting-fatigue endurance. In [Edwards, 1984], the life estimation is done using stress intensity factors that take into account the bulk stress and the forces introduced by fretting. Today, this approach remains very promising as it is proven by a recent article published by Hills and his colleagues, [Hills et al., 2012], who use a similar approach to predict the fatigue life of the specimen.
In the last years the number of articles on fretting-fatigue is increased exponen-tially. A rapid search on ScienceDirect shows that the number of papers related to fretting-fatigue published in the last twenty years (5122) is more than 3 times the total number of articles published before 1990 (1591). This is the reason why, even if I tried to be exhaustive, I would inevitably miss some important papers. With that said, I would like to spend some words on the work of Hills and Nowell, [Hills and Nowell, 1994] and the one of Giannakopoulos and his colleagues, [Giannakopoulos et al., 1998, Giannakopoulos et al., 2000]. With “Mechanics of Fretting Fatigue”, Hills and Nowell have written a book that is now a bestseller of the fretting-fatigue literature in which a state of the art description of this phenomenon is presented. Giannakopoulos and his colleague, instead, are among the first to demonstrate a quantitative equivalence between contact and fracture mechanics. This two works have had an important influence on the research performed and presented in this manuscript.
1.2.2
Fretting-fatigue test geometries
Fretting-fatigue is considered a plague for the modern industry and its negative effects on mechanical assemblies have been experienced in many different sectors such as automotive, aerospace, train, construct equipment, wire ropes, etc. No matter which industry is concerned, all of them share the need to certify the components to ensure that are riskless for the users. For this purpose experimental test campaigns are usually needed and, considering the wide range of contact configurations existing in the industrial components, a simplification is required. Experimental tests are standardized around three different reference contact configurations: sphere/plane contact, cylinder/plane contact, plane/plane contact.
1.2.2.1 Sphere/plane contact
Sphere/plane contact, is a uni-dimensional configuration for which analytical results obtained by Hertz, [Hertz, 1882], for frictionless normal contact, and by Cattaneo and Mindlin, [Cattaneo, 1938, Mindlin, 1949], are available. This configuration has the advantage to be relatively easily to setup from an experimental point of view since there is no problem related to the alignment of the sphere with respect to the plane being the contact surface a point. On the other hand a 3D computation of the mechanical fields is required whenever the loads are not axisymmetric or the crack
propagation phase is studied; in these cases the computations become heavily time consuming.
1.2.2.2 Cylinder/plane contact
In this case the contact is bidimensional. This statement is true for a value of the ratio, b/a higher than 5, where b is the thickness of the pad, and a is the contact semi-width as it is proven in [Fellows et al., 1995]. In other words, if this condition is respected, the highest stresses will be reached at the center of the specimen (Figure 1.12a), and they will correspond to a plane strain condition. Therefore, the problem can be represented as if it was bidimensional. Due to this important characteristic, this configuration is the one commonly used in fretting-fatigue test campaign; first, the experimental setup is well mastered, secondly, a fast comparison between experimental and computational results is possible.
b h
2a
(a) (b)
Figure 1.12: (a) Schematic of the dog bone specimen/cylindrical pad configuration; (b) fretting-fatigue apparatus, [Ara´ujo and Castro, 2012].
1.2.2.3 Plane/plane contact
This configuration leads to a tridimensional contact characterized by a stress distri-bution that, close to the contact borders becomes discontinuous. Some important difficulties in the experimental setup, such us the alignment of the pad, and the need to perform tridimensional FE computations, limit its application. It is worth mentioning that in the last years some analytical solutions concerning the stress distribution have been obtained, [Ciavarella and Macina, 2003].
1.2.2.4 Dovetail/blade root contact
In an article published in 2006, [Rajasekaran and Nowell, 2006], the authors conceived an experimental apparatus to reproduce the loading experienced by a dovetail blade root in an aircraft gas turbine. Certainly, this setup allows to well represents the industrial attachment but, at the same time, it applies to only a specific geometry and is far more difficult to put in place with respect to the aforementioned contact configurations. For this reason this type of test machines represents a niche among the fretting-fatigue test apparatus.
Blade Disc
M
P
Q
Fc
Fa
(a) (b)Figure 1.13: (a) Schematic representation of the loading at the interface disc/blade root; (b) dovetail blade root test apparatus [Rajasekaran and Nowell, 2006].
1.2.3
Fretting-fatigue test apparatus
In the previous section the different contact configuration used to simulate fretting-fatigue have been described. Here a detailed description of the whole apparatus employed in the test campaigns is presented. With the exception of the dovetail/blade root contact configuration the other ones share more or less the same setup. In Figure 1.12b, the fretting-fatigue apparatus used by Ara´ujo and his colleagues at the university of Brasilia is shown while in Figure 1.14 a schematic representation of a single actuator test machine and a double actuator one are presented.
Concerning the double actuator test machine (Figure 1.14b), two clamps hold the specimen in the right position. The first one is fixed while the second one is connected to an hydraulic actuator, (actuator 2) that is free to move in the axial direction controlling the bulk tension in the specimen. A second actuator, (actuator 1) is connected to a cradle, carrying the fretting pad arrangement. The two pads
Pads Actuator 1 Actuator 2 Grip Specimen Pad holder Force sensor 1 Force sensor 2 P P Q Q Pads Actuator Grip Specimen Pad holder Force sensor 1 Force sensor 2 P P Q Q (a) (b)
Figure 1.14: (a) Fretting-fatigue single actuator machine; (b) Fretting-fatigue dou-ble actuator machine, [Lee and Mall, 2004].
are pressed onto the specimen surface to create the normal force, P , while the tangential force, Q, is regulated by the displacement of the actuator, (actuator 1). The displacement between the specimen and the pads is then recorded, for instance, through the use of laser sensors.
In the case of a single actuator test machine (Figure 1.14a), as its name suggests, there is a single actuator which control the bulk tension in the specimen, σB. The
fretting pad arrangement is attached to the fatigue test frame and works as a spring that reacts to the motion of the pads pressed against a “dog bone” fatigue specimen. The reaction of the spring results in the cyclic tangential load, Q, whose value is half of the difference between the forces measured at the lower and upper load cells of the servo-hydraulic system.
To sum up, fretting-fatigue is a complex phenomenon that can provoke the failure of the assembly and therefore laboratory tests are needed to understand the damage mechanisms. Since the geometry of the industrial parts are usually extremely complex, a first simplification is made in order to develop a reasonable complex fretting-fatigue test bench. This means that usually one of the following contact configurations -plane/plane, cylinder/plane, sphere/plane - shown in Figure 1.15, is retained.
δ
t
take-off cruise landing in-phas
e frettin g load out-of-pha se fretting load
Industrial context Laboratory tests
C on tac t simplifica tion Loads simplifica tion t t Q , P , σB Q , P , σB
Figure 1.15: Geometrical and load simplifications in fretting-fatigue tests.
A second simplification is done on the load evolution experienced at the disc/blade root connection. Considering that the aeroelastic vibrations can reach frequencies close to 400 Hertz, it is clear that the ratio between the number of fatigue cycles (centrifugal force due to engine switch-on and switch-off) and the fretting ones (generated by the vibrations due to the interaction with the airflow) is really low.
In other words, for each flight, just one fatigue cycle is registered while millions of fretting cycles are experienced by the part. This is something to bear in mind since during test campaigns this condition is usually not respected.
The possible test scenarios (with some exceptions) are therefore two: in the case in which a single actuator fretting-fatigue apparatus is the only available, the fatigue load and the fretting ones are inevitably in phase, while the two load modes can be decoupled within certain limits with a double actuator machine. Analyzing the literature on fretting-fatigue, the first setup has been really common and is now replaced by better performing double actuator devices. With that said, even with this setup it is difficult to simulate the real in flight loads ratio experienced by the disc/root blade attachment, since it would mean to have extremely long tests with important costs. As a consequence, the effect of the fatigue load will be overestimated.
1.2.4
Slip quantification for transition criteria
As it is already mentioned before, one of the peculiarities of fretting-fatigue is repre-sented by the microdisplacements over part of the interface that can severely damaged the surface. It is necessary to quantify the “micro” displacement in order to separate the different slip regimes that have a direct effect on the damage mode.
A first distinction can be made between fretting regime, characterized by a central zone which is never exposed to the external environment, and reciprocal sliding. A simple way to formalize the transition between these two conditions is obtained using the ratio of the displacement amplitude, δ∗, to the contact semi width, a
c, [Fouvry
et al., 1996]. For values of the ratio higher than 1, the contacting parts are in total slip condition otherwise fretting regime is established (Figure 1.16).
2δ ac 2δ e = 1 e < 1 e > 1 Nor mal for ce (P) Displacement amplitude (δ) Q
stick-slip gross sliding
stick zone slip zone δ (Q*, δ*) Displacement amplitude (δ) Ta ngen tial f or ce ( Q )
Fretting regime Reciprocal sliding
Transition Q δ Q δ (Q*=μP)
Figure 1.16: Transition between fretting regime and reciprocal sliding, [Meriaux, 2010, Mary, 2009].
In this manuscript we focus on the fretting regime since is the situation experi-enced at the attachment between disc and blade root. With that said, by analyzing the contact behavior through the evolution of the tangential force, Q, as a function of the displacement, δ, a subdivision of the fretting regime can be made. Three different slip conditions are observed, as described in [Vingsbo and S¨oderberg, 1988]:
• Stick condition: in this case the tangential force at the contact interface, q(x), is lower than the Coulomb limit, µp(x), where µ is the Coulomb’s coefficient and p(x) is the local normal force. The displacement registered is therefore exclusively produced by the elastic deformation of the parts;
• Stick-slip condition: locally the Coulomb’s slip limit is reached, q(x) > µp(x) and, as a consequence, a slip zone is created that is located at the extremity of the contact surface. The macroscopic response of the assembly, Q(δ), has an elliptic shape. The nonlinear evolution of Q(δ) is related to the friction at the contact interface that can be coupled with plasticity if the local stresses are high enough;
![Figure 1.9: Stress distribution at the blade root / disc contact surface, [Ferr´e et al., 2013].](https://thumb-eu.123doks.com/thumbv2/123doknet/14501444.719305/34.892.144.747.160.381/figure-stress-distribution-blade-root-contact-surface-ferr.webp)
![Figure 1.29: Illustration of the fretting-fatigue mapping concept defined for partial slip condition, [Fouvry and Kubiak, 2009].](https://thumb-eu.123doks.com/thumbv2/123doknet/14501444.719305/58.892.208.680.203.593/figure-illustration-fretting-fatigue-mapping-concept-defined-condition.webp)