Supporting information
Aerosol Filtration Efficiency of Common Fabrics
Used in Respiratory Cloth Masks
Abhiteja Konda,
‡,aAbhinav Prakash,
‡,a,bGregory A. Moss,
cMichael Schmoldt,
a,cGregory D. Grant,
band Supratik Guha
a,b,*
a Center for Nanoscale Materials, Argonne National Laboratory, Lemont, IL 60439, USA. b Pritzker School of Molecular Engineering, University of Chicago, Chicago, IL 60637. c Worker Safety & Health Division, Argonne National Laboratory, Lemont, IL 60439, USA.
‡ These authors have contributed equally to the work.
* To whom correspondence should be addressed: Supratik Guha
Telephone: (773) 834-4209 E-mail: guha@uchicago.edu
2 Filtration efficiencies for various fabrics tested at two different flow rates, and the effect of layering on the filtration efficiencies of chiffon, silk, and 600 TPI cotton. Detailed information on various fabrics used.
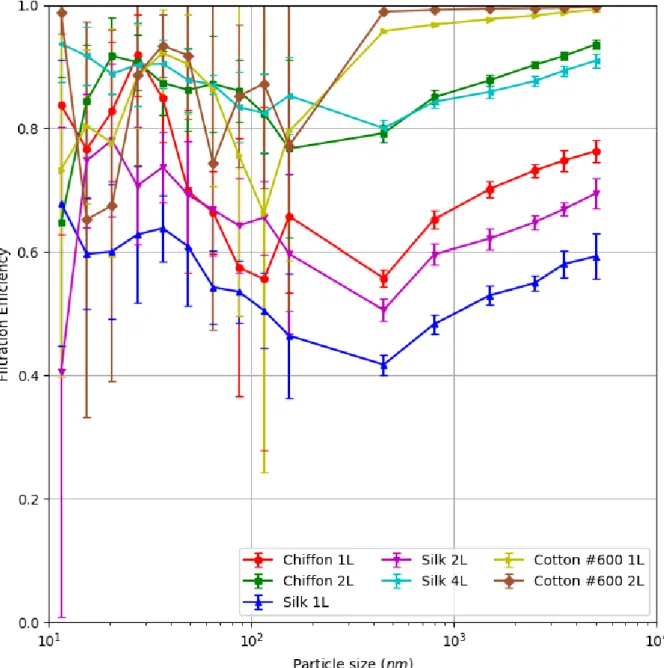
Figure S1: Filtration Efficiency of Different Fabrics as a Function of Number of Layers at a Flow Rate of 1.2 CFM. The plot shows the filtration efficiencies of chiffon (1 and 2 layers), silk (1, 2, and 4 layers), and 600 TPI cotton (1 and 2 layers).
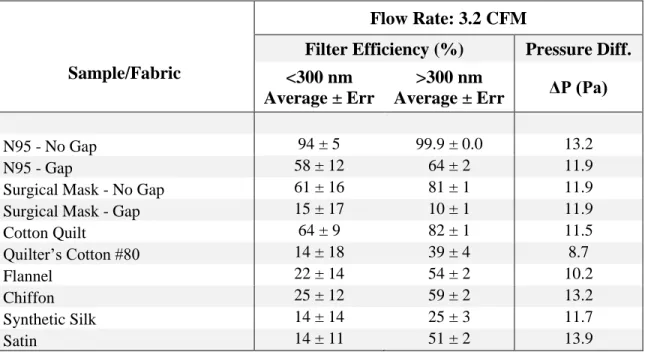
Table S1: Filtration efficiencies of various test specimens at a velocity of 0.26 m/s (3.2 CFM) and the corresponding ΔP values. The filtration efficiencies are the weighted average of seven replicates. ΔP indicates the pressure difference across the sample and is a good indicator of the breathability through the sample when used as mask.
Flow Rate: 3.2 CFM
Filter Efficiency (%) Pressure Diff. Sample/Fabric <300 nm
Average ± Err
>300 nm
Average ± Err ΔP (Pa)
N95 - No Gap 94 ± 5 99.9 ± 0.0 13.2
N95 - Gap 58 ± 12 64 ± 2 11.9
Surgical Mask - No Gap 61 ± 16 81 ± 1 11.9
Surgical Mask - Gap 15 ± 17 10 ± 1 11.9
Cotton Quilt 64 ± 9 82 ± 1 11.5 Quilter’s Cotton #80 14 ± 18 39 ± 4 8.7 Flannel 22 ± 14 54 ± 2 10.2 Chiffon 25 ± 12 59 ± 2 13.2 Synthetic Silk 14 ± 14 25 ± 3 11.7 Satin 14 ± 11 51 ± 2 13.9
4 Figure S2: Filtration Efficiency of Different Samples Tested at a Flow Rate of 1.2 CFM. Plot shows the filtration efficiencies for various samples across the two size distributions including N95 and surgical mask.
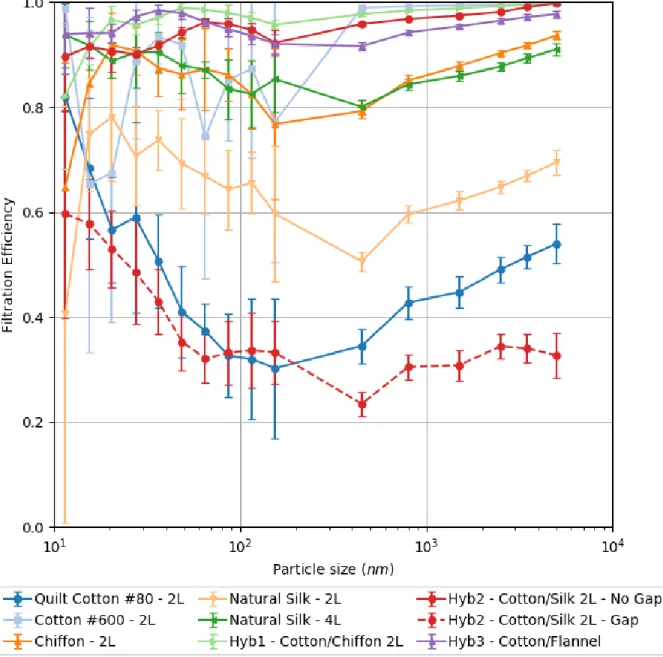
Figure S3: Filtration Efficiency of Different Samples Tested at a Flow Rate of 1.2 CFM. Plot shows the filtration efficiencies for various multi-layered samples across the two size distributions.
6 Figure S4: Filtration Efficiency of Different Samples Tested at a Flow Rate of 3.2 CFM. Plot shows the filtration efficiencies for various samples across the two size distributions.
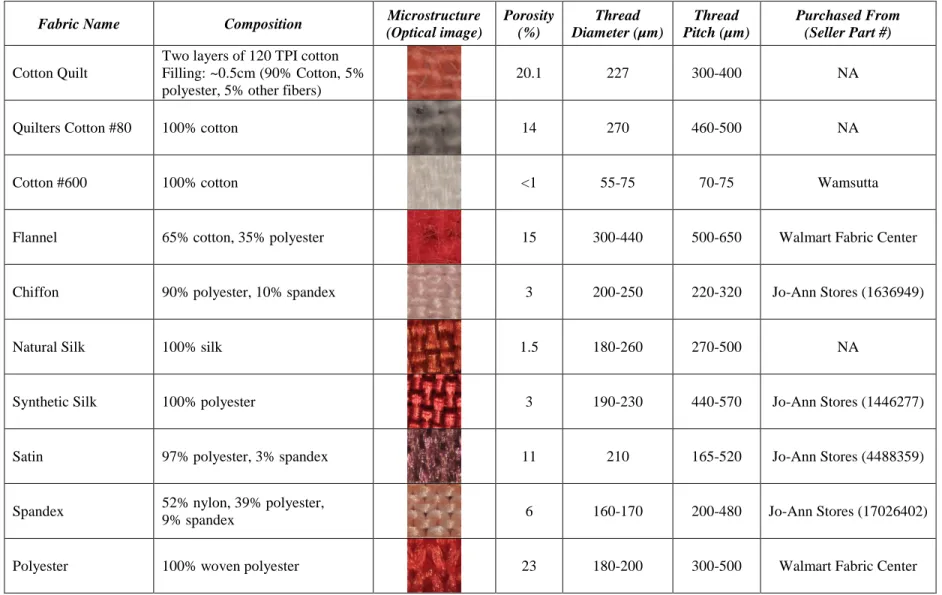
Table S2: Specific Information on the Various Fabrics Used. Table showing the composition, microstructure, approximate porosity, thread diameter, approximate thread pitch, and the source of the materials (where applicable). Pitch and thread diameter often vary depending upon the weave direction resulting in the variation noted.
Fabric Name Composition Microstructure
(Optical image) Porosity (%) Thread Diameter (µm) Thread Pitch (µm) Purchased From (Seller Part #) Cotton Quilt
Two layers of 120 TPI cotton Filling: ~0.5cm (90% Cotton, 5% polyester, 5% other fibers)
20.1 227 300-400 NA
Quilters Cotton #80 100% cotton 14 270 460-500 NA
Cotton #600 100% cotton <1 55-75 70-75 Wamsutta
Flannel 65% cotton, 35% polyester 15 300-440 500-650 Walmart Fabric Center
Chiffon 90% polyester, 10% spandex 3 200-250 220-320 Jo-Ann Stores (1636949)
Natural Silk 100% silk 1.5 180-260 270-500 NA
Synthetic Silk 100% polyester 3 190-230 440-570 Jo-Ann Stores (1446277)
Satin 97% polyester, 3% spandex 11 210 165-520 Jo-Ann Stores (4488359)
Spandex 52% nylon, 39% polyester,