ELECTRONIC SUPPORTING INFORMATION
Model Peptide Studies of Ag
+
Binding Sites from the
Silver Resistance Protein SilE
V. Chabert,
aM. Hologne,
bO. Sénèque,
cA. Crochet,
dO. Walker
band K. M.
Fromm
a*a.
Univ. Fribourg, Department of Chemistry, Chemin du Musée 9, 1700 Fribourg, Switzerland. E-mail:
[email protected]
b.
Univ. Lyon, CNRS, UCB Lyon 1, ENS-Lyon, Institut des Sciences Analytiques, UMR 5280, 5 rue de la
Doua, 69100 Villeurbanne, France.
c.
Univ. Grenoble Alpes, LCBM and CEA/BIG/CBM/PMB and CNRS, LCBM, UMR 5249, 38000 Grenoble,
France.
d.
Univ. Fribourg, Fribourg Center for Nanomaterials, FriMat, Chemin du Musée 9, 1700 Fribourg,
Table of contents
Experimental Procedures ...3
Determination of Ag
+/peptides binding constants...4
AgHETM
1H,
13C-HSQC NMR spectra...8
Methionine oxidation assays...9
Silver-methionine solid state structure ...11
Characterization of LP1 ...14
Experimental Procedures
Solid-Phase Peptide Synthesis (SPPS). Peptide models were synthesized by SPPS (Solid-Phase Peptide Synthesis) on a
Rink-Amide resin (Novabiochem) on a 118 μmol scale.1 The resin has been swelled in DCM (dichloromethane) during 30 min under
stirring. 9-fluoromethoxy-carbonyl (Fmoc)-protected amino acids (Bachem) were coupled by using PyBOP (benzotriazol-1-yl-oxytripyrrolidinophosphonium hexafluorophosphate, Novabiochem) as coupling agent, DIPEA (N,N-diisopropylethylamine, Sigma-Aldrich) as organic base, and DMF (N,N′-dimethylformamide, Sigma-Aldrich) as solvent, during 30 min. After each coupling, a mixture of acetic anhydride (Acros Organics)/pyridine (Acros Organics)/DMF (1:2:7) has been added to the resin during 3 min in order to protect the unreacted functional groups. Fmoc deprotection steps were carried out by using 20% piperidine (Sigma-Aldrich) in DMF, three times during 3 min. The N-terminus was acetylated by using a mixture of acetic anhydride/pyridine/DMF (1:2:7) during 3 min. After each step, the solvent has been removed by filtration and the resin has been washed five times with DMF, and once with DCM. Side chain deprotection and peptide cleavage from the resin were carried out by adding 8 mL of a cocktail of 95.5% TFA (trifluoroacetic acid, Sigma-Aldrich), 1.5% EDT (ethane dithiol, Sigma-Aldrich), 1.5% TIS (triisopropylsilane, Sigma-Aldrich) and 1.5% water during 2h. The TFA has been evaporated under vacuum and the peptides were precipitated and washed 3 times with cold diethyl ether (Sigma-Aldrich). Peptides were dried and purified by semi-preparative reverse-phase HPLC (Waters 600) on a NUCLEODUR C18 HTec Column (Macherey-Nagel) with a linear gradient from 5% to 40% acetonitrile in water with 0.1% TFA, and then lyophilized. Characterization of the peptides was performed by ESI-MS
(Bruker Esquire HCT) and 1H NMR (Bruker Ascend 400 MHz), and the purity (> 95%) was controlled by analytical HPLC (Waters
alliance).
NMR spectroscopy. Lyophilized peptides (1-2 mg) have been dissolved in 300 μL of D2O (Cambridge Isotope Laboratories) and
the concentrations have been determined by UV-Vis spectroscopy. The molar absorptivity at 205 nm (ε205) of each peptide is
given by the modified formula (from Anthis et al.2):
𝜀205=
∑
(
𝜀𝑖𝑛𝑖)
+ 𝜀𝑏𝑏× 𝑟where for each amino acid i, εi is the molar absorptivity of the amino acid side chain (from Goldfarb et al.3 for all values, except
for glutamine and asparagine values, which come from Saidel et al.4) and ni is the number of times that this amino acid appears
in the peptide sequence. εbb is the molar absorptivity of a backbone peptide bond, and r is the number of residues in the peptide
sequence. Peptide solutions (500 µM) were then prepared in a deuterated HEPES
(4-(2-hydroxyethyl)-1-piperazineethanesulfonic acid) buffer (20 mM, pD 7.8), and 1H NMR titrations were performed on a Bruker Ascend 400 MHz by
adding increasing amounts of AgClO4 deuterated solution of which the concentration (48.0 mM) has been previously
determined by ICP analysis. Titration experiments using imidazole-d4 as a competitor have been performed in the above-mentioned conditions, using the imidazole-d4 (3-25 mM, pD 7.8) as buffer instead of HEPES. The titration curves were fitted
using the program DynaFit5, with the binding constants of [Ag(imidazole)n]+ (n = 1, 2) complexes (LogKass = 2.96 and 6.71 for the
1:1 and 1:2 complexes respectively) determined by Czoik et al.6. 1H, 13C-HSQC spectra where measured with peptide samples of
ca. 50 mM in D2O, before and after addition of 2 eq. of AgClO4 deuterated solution (0.96 M). DOSY experiments were recorded
using stimulated echo employing bipolar gradients and 3-9-19 pulse sequence for water suppression ( = 200 ms, = 1ms, 16384 x 32 points, T =303 K) in the case of the free and complexed form of LP1.
CD spectroscopy. The concentration determination of LP1 solutions has been performed as previously described for NMR
Oxidation assays. Lyophilized peptides (1-2 mg) have been dissolved in bidistillated water in order to reach a concentration of
ca. 1 mM. Then, pH values have been adjusted to 7 by adding a few drops of NaOH solution (1 M). AgClO4 (1 eq.) has been then
added to half of the solution volumes. Each sample has been measured by HPLC analysis (Waters alliance, Linear gradient: 5% to
30% acetonitrile in water with 0.1% TFA in 15 min) and ESI-MS analysis (Bruker Esquire HCT), before and after addition of H2O2
(100 eq.) during 1h.
{[Ag2(L-Methionine)4](NO3)2, 2H2O}n crystallization. Silver nitrate (85 mg, 0.5 mmol, Acros Organics) and L-methionine (149 mg,
1 mmol, Sigma-Aldrich) were added to a NMR tube containing 500 µL of D2O. The tube has been sonicated and heated until a
clear solution was obtained. The sample has been stored in the dark for 1 day, and single crystals of {[Ag2(L-Methionine)4](NO3)2,
2H2O}n were obtained. Data collection for single crystal X-ray crystallography has been performed using Mo-Kα radiation
(0.71073 Å) at 200(2) K with a STOE IPDS II diffractometer equipped with an Oxford Cryosystem open flow cryostat. The
structure has been solved and refined using full-matrix least-squares on F2 with the SHELXL package7. The crystal has been
mounted on loops and all geometric and intensity data were taken from one single crystal. All heavy atoms have been refined anisotropically. Crystallographic data has been deposited with the Cambridge Crystallographic Data Center, 12 Union Road, Cambridge CB21EZ, UK. Copies of the data can be obtained on quoting the depositing numbers CCDC 1547635 (Fax: +44-1223-336-033; E-mail: [email protected]).
Determination of Ag
+/peptides binding constants
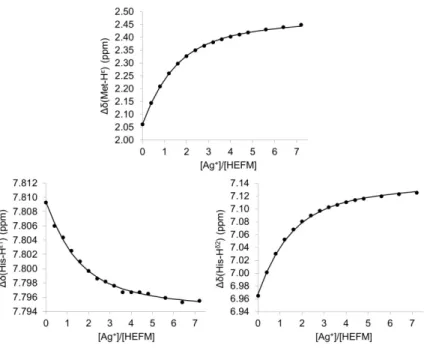
Silver binding constants (LogKass) of each complex have been determined from Ag+ titrations of the peptides in competition with
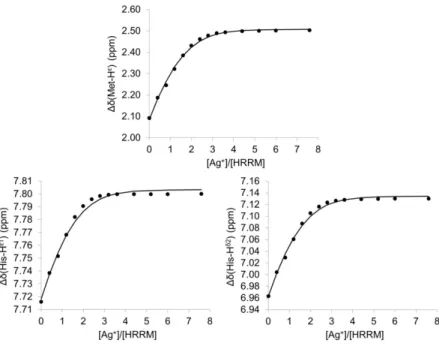
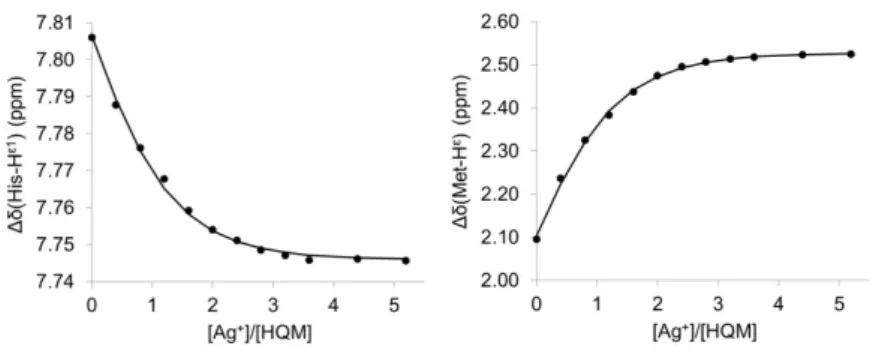
imidazole-d4. Figures S1-S8 show the plot of Met-Hε, His-Hδ2 and/or His-Hε1 (when Δδ ≥ 0.05 ppm) 1H NMR resonances shifts
obtained during the competition experiments and the fits obtained using the program Dynafit5.
Figure S1. Plots of the histidine and methionine 1H resonances shift by addition of AgClO4 (0 to 4.36 mM) to a solution of HEFM
Figure S2. Plots of the histidine and methionine 1H resonances shift by addition of AgClO4 (0 to 4.36 mM) to a solution of MNEH
(500 µM) in competition with imidazole-d4 (3.32 mM, pD 7.8). The solid lines correspond to the fits obtained with DynaFit.5
Figure S3. Plots of the histidine and methionine 1H resonances shift by addition of AgClO4 (0 to 4.36 mM) to a solution of HRRM
Figure S4. Plots of the histidine and methionine 1H resonances shift by addition of AgClO4 (0 to 4.36 mM) to a solution of HQKM
(500 µM) in competition with imidazole-d4 (3.43 mM, pD 7.8). The solid lines correspond to the fits obtained with DynaFit.5
Figure S5. Plots of the histidine and methionine 1H resonances shift by addition of AgClO4 (0 to 4.36 mM) to a solution of HQAM
(500 µM) in competition with imidazole-d4 (3.46 mM, pD 7.8). The solid lines correspond to the fits obtained with DynaFit.5
Figure S6. Plots of the histidine and methionine 1H resonances shift by addition of AgClO4 (0 to 4.36 mM) to a solution of HQM
(500 µM) in competition with imidazole-d4 (3.35 mM, pD 7.8). The solid lines correspond to the fits obtained with DynaFit.5
Figure S7. Plots of the histidine and methionine 1H resonances shift by addition of AgClO4 (0 to 4.36 mM) to a solution of HQRM
Figure S8. Plots of the histidine and methionine 1H resonances shift by addition of AgClO4 (0 to 4.36 mM) to a solution of MDQH
(500 µM) in competition with imidazole-d4 (3.25 mM, pD 7.8). The solid lines correspond to the fits obtained with DynaFit.5
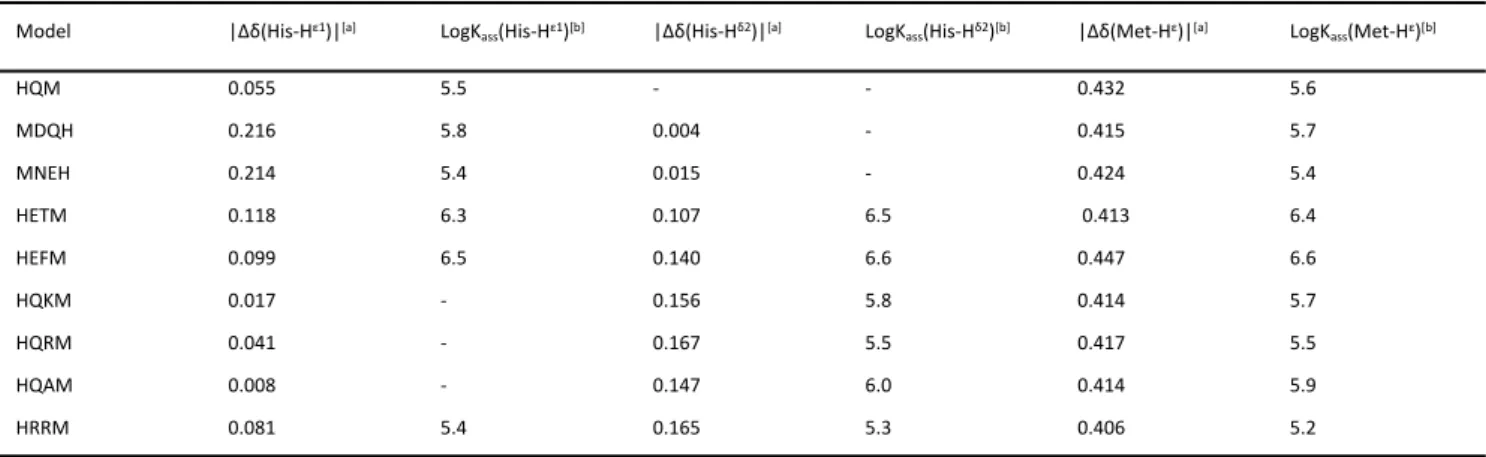
Table S1. Comparison of the binding constants (LogKass ± 0.1) individually determined from His-Hε1, His-Hδ2 and Met-Hε1H NMR shifts.
Model |Δδ(His-Hε1)|[a] LogK
ass(His-Hε1)[b] |Δδ(His-Hδ2)|[a] LogKass(His-Hδ2)[b] |Δδ(Met-Hε)|[a] LogKass(Met-Hε)[b]
HQM 0.055 5.5 - - 0.432 5.6 MDQH 0.216 5.8 0.004 - 0.415 5.7 MNEH 0.214 5.4 0.015 - 0.424 5.4 HETM 0.118 6.3 0.107 6.5 0.413 6.4 HEFM 0.099 6.5 0.140 6.6 0.447 6.6 HQKM 0.017 - 0.156 5.8 0.414 5.7 HQRM 0.041 - 0.167 5.5 0.417 5.5 HQAM 0.008 - 0.147 6.0 0.414 5.9 HRRM 0.081 5.4 0.165 5.3 0.406 5.2
[a] The 1H NMR shifts (Δδ) correspond to maximal values of the peptides titration by AgClO
4. [b] LogKass values are extracted from competition experiments using
AgHETM
1H,
13C-HSQC NMR spectra
The comparison of 1H, 13C-HSQC NMR spectra of the apo- and holo-forms of each model peptide allowed to find out which
amino acid were involved in the Ag+ coordination sphere. Indeed, 13C NMR chemical shift are less sensitive to conformational
changes and can therefore attest to the Ag+ binding to the different side chains when nearby 13C resonances are altered8. This
highlighted a methionine and histidine involvement in Ag+ coordination in each model and a glutamate participation in AgHETM
and AgHEFM (Figure S9).
Figure S9. 1H, 13C-HSQC NMR spectra of HETM (red) and AgHETM (blue). (a) The His-Cδ2 resonance at 117 ppm in each spectrum
indicates a predominance of the His-Nε2-H tautomer. (b) The Glu-Cβ and Glu-Cγ resonances shift suggests a glutamate
Methionine oxidation assays
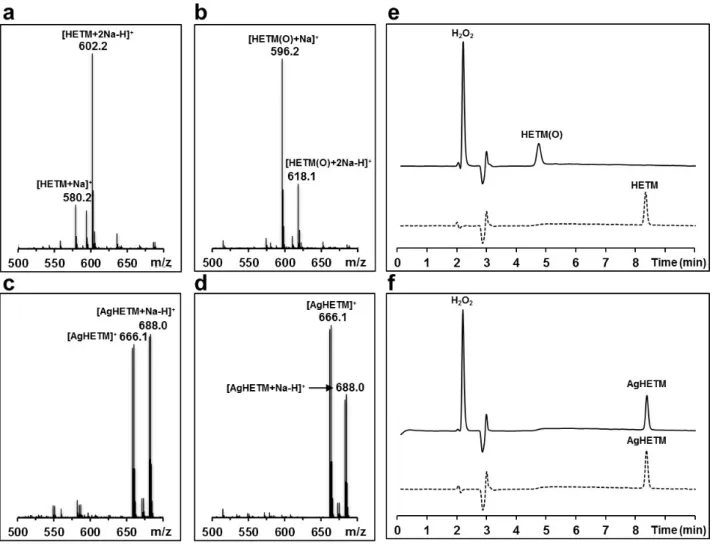
Due to their sulfur containing side chain, the methionine residues are highly oxidizable in presence of reactive oxygen species
(ROS)9,10. To explore this sensitivity in our models and its effect on silver complexation, oxidation assays were performed by
incubating the models in presence of an excess of hydrogen peroxide during 1h. Using this procedure, all free peptides were oxidized to sulfoxide, respectively in one case into sulfone. These results have been confirmed by both ESI-MS and analytical
HPLC (Table S2). For instance, the ESI-MS spectrum of HETM before H2O2 treatment shows two peaks which correspond to
sodium adducts of the reduced peptide ([HETM+Na]+ and [HETM+2Na-H]+) (Figure S10a), while after H
2O2 treatment, the
spectrum only shows peaks of the sulfoxide species ([HETM(O)+Na]+ and [HETM(O)+2Na-H]+) (Figure S10b). Moreover, the HPLC
analysis confirms the full oxidation of the peptide by H2O2 (Figure S10e). However, when bound to silver, the same model
peptide can no longer be oxidized by H2O2. Indeed, ESI-MS spectra and HPLC chromatograms of all the silver bound model
peptides are identical before and after H2O2 treatment. The two ESI-MS spectra show the same species (e.g. [AgHETM]+ and
[AgHETM+Na-H]+) (Figure S10c-d) and the HPLC chromatograms present the same retention time before and after treatment
with H2O2 (Figure S10f).
Figure S10. Methionine oxidation assays. (a-b) ESI-MS analysis of HETM (1 mM) before (a) and after (b) a one hour incubation
with H2O2 (100 mM). (c-d) ESI-MS analysis of AgHETM (1 mM) before (d) and after (e) a one hour incubation with H2O2 (100
Table S2. ESI-MS observed species and HPLC retention times of the models before and after incubation with H2O2.
Model ESI-MS before H2O2
(m/z) ESI-MS before H2O2 (species) ESI-MS after H2O2 (m/z) ESI-MS after H2O2 (species) HPLC retention time before H2O2 (min) HPLC retention time after H2O2 (min) MDQH 593.2 615.2 [MDQH+Na]+ [MDQH+2Na-H]+ 609.1 631.1 [MDQH(O)+Na]+ [MDQH(O)+2Na-H]+ 8.3 2.2 HETM 580.2 602.2 [HETM+Na]+ [HETM+2Na-H]+ 596.2 618.1 [HETM(O)+Na]+ [HETM(O)+2Na-H]+ 8.4 4.7 HEFM 626.2 648.2 [HEFM+Na]+ [HEFM+2Na-H]+ 642.2 658.2 [HEFM(O)+Na]+ [HEFM(OO)+Na]+ 9.2 7.3 HRRM 640.3 320.7 754.2 [HRRM+H]+ [HRRM+2H]2+ [HRRM+H+TFA]+ 656.3 328.6 770.2 [HRRM(O)+H]+ [HRRM(O)+2H]2+ [HRRM(O)+H+TFA]+ 8.8 6.2 HQM 478.1 [HQM+Na]+ 494.1 [HQM(O)+Na]+ 7.1 3.6 HQKM 584.2 606.2 [HQKM+H]+ [HQKM+Na]+ 600.3 622.3 [HQKM(O)+H]+ [HQKM(O)+Na]+ 7.5 4.0 HQRM 612.2 [HQRM+H]+ 628.3 [HQRM(O)+H]+ 7.9 5.0 MNEH 615.2 [MNEH+2Na-H]+ 631.2 [MNEH(O)+2Na-H]+ 8.3 4.2 HQAM 549.1 [HQAM+Na]+ 565.2 [HQAM(O)+Na]+ 7.7 4.1
Table S3. ESI-MS observed species and HPLC retention times of the model complexes before and after incubation with H2O2.
Model ESI-MS before H2O2
(m/z) ESI-MS before H2O2 (species) ESI-MS after H2O2 (m/z) ESI-MS after H2O2 (species) HPLC retention time before H2O2 (min) HPLC retention time after H2O2 (min) AgMDQH 699.1/701.1 [AgMDQH+Na-H]+ Idem Idem 8.3 Idem
AgHETM 664.1/666.1 686.1/688.0
[AgHETM]+ [AgHETM+Na-H]+
Idem Idem 8.4 Idem
AgHEFM 710.2/712.1 732.1/734.1
[AgHEFM]+ [AgHEFM+Na-H]+
Idem Idem 9.4 Idem
AgHRRM 746.2/748.2 373.7/374.6
[AgHRRM]+ [AgHRRM+H]2+
Idem Idem 8.8 Idem
AgHQM 562.0/564.0 [AgHQM]+ Idem Idem 7.1 Idem
AgHQKM 690.1/692.1 345.6/346.6 [AgHQKM]+ [AgHQKM+H]2+ Idem Idem 7.3 Idem AgHQRM 718.1/720.1 359.7/360.6 [AgHQRM]+
[AgHQRM+H]2+ Idem Idem 7.9 Idem
AgMNEH 699.1/701.0 [AgMNEH+Na-H]+ Idem Idem 8.3 Idem
AgHQAM 633.1/635.0 [AgHQAM]
+
Silver-methionine solid state structure
The complex {[Ag2(L-Methionine)4](NO3)2•2H2O}n crystallizes in the monoclinic P21 space group and contains two independent
silver ions. Each metal ion is coordinated in a trigonal planar fashion (Sum of angles : ΣAg1 = 360°; ΣAg2 = 352.2°) by the carboxylate group of one methionine (Ag1-O4 = 2.34(1) Å, Ag2-O1 = 2.34(2) Å) and by the thioether moieties of two other methionine ligands (Ag1-S1 = 2.454(7) Å, Ag1-S4 = 2.487(6) Å, Ag2-S2#1 = 2.503(7) Å, Ag2-S3 = 2.538(6) Å; #1: x+1, y, z). The
calculated bond valences evidence a stronger binding of sulfur atoms to the silver cation (SAg1-S1 = 0.40, SAg1-S4 = 0.37, SAg2-S2 =
0.35, SAg2-S3 = 0.32) than of the oxygen atoms (SAg1-O4 = 0.26, SAg2-O1 = 0.26)11. Each metal coordination sphere is complemented
by two weak bonds (SAg1-O3= 0.04, SAg1-O3#1 = 0.06, SAg2-O2 = 0.07, SAg2-s2= 0.05).
Figure S11. 1D coordination polymer formed by the {[Ag2(L-Methionine)4](NO3)2•2H2O}n complex along the a axis. The complex
forms a helical 1D coordination polymer along the a axis. The coordination spheres of the two silver ions are completed by a third methionine on each side of the helix.
inter-Table S4. Crystal data and structure refinement for {[Ag2(L-Methionine)4](NO3)2•2H2O}n.
Empirical formula C20H48Ag2N6O16S4
Formula weight 972.62
Temperature 200(2) K
Wavelength 0.71073 Å
Crystal system Monoclinic
Space group P 21
Unit cell dimensions a = 5.0810(3) Å α= 90°
b = 24.7309(12) Å β= 99.007(5)° c = 14.5097(10) Å γ= 90° Volume 1800.77(19) Å3 Z 2 Density (calculated) 1.794 Mg/m3 Absorption coefficient 1.393 mm-1 F(000) 992 Crystal size 0.480 x 0.180 x 0.030 mm3 Theta range for data collection 1.421 to 25.189°.
Index ranges -6<=h<=6, -29<=k<=29, 0<=l<=17 Reflections collected 6406
Independent reflections 6406 [R(int) = 0.1138] Completeness to theta = 25.189° 99.2 %
Absorption correction Integration Max. and min. transmission 0.9681 and 0.7492
Refinement method Full-matrix least-squares on F2 Data / restraints / parameters 6406 / 59 / 423
Goodness-of-fit on F2 1.019
Final R indices [I>2sigma(I)] R1 = 0.0864, wR2 = 0.2272 R indices (all data) R1 = 0.1164, wR2 = 0.2525
Absolute structure parameter 0.02(3) Extinction coefficient n/a
Largest diff. peak and hole 1.651 and -1.109 e.Å-3 Refined as a 2-component perfect twin. H atoms on heteroatoms not refined.
Table S5. Bond lengths [Å] and angles [°] for {[Ag2(L-Methionine)4](NO3)2•2H2O}n.
Ag(1)-O(4) 2.339(14) Ag(2)-O(2) 2.85(2) Ag(1)-S(1) 2.454(7) Ag(2)-S(2) 3.224(6) Ag(1)-S(4) 2.487(6) O(4)-Ag(1)-S(1) 122.4(4) Ag(1)-O(3) 3.02(2) O(4)-Ag(1)-S(4) 114.9(4) Ag(1)-O(3)#1 2.86(2) S(1)-Ag(1)-S(4) 122.6(2) Ag(2)-O(1) 2.336(16) O(1)-Ag(2)-S(2)#1 134.9(5) Ag(2)-S(2)#1 2.503(6) O(1)-Ag(2)-S(3) 99.5(5) Ag(2)-S(3) 2.538(6) S(2)#1-Ag(2)-S(3) 117.8(2)
Table S6. Hydrogen bonds for {[Ag2(L-Methionine)4](NO3)2•2H2O}n [Å and °].
D-H...A d(D-H) d(H...A) d(D...A) <(DHA)
N(1)-H(1A)...O(6) 0.91 2.01 2.81(2) 145.1 N(1)-H(1B)...O(16)#3 0.91 2.00 2.85(3) 155.8 N(1)-H(1C)...O(2)#2 0.91 1.90 2.78(2) 161.0 N(2)-H(2A)...O(4)#2 0.91 1.91 2.81(2) 167.7 N(2)-H(2B)...O(7)#2 0.91 2.47 2.92(2) 110.7 N(2)-H(2B)...O(8) 0.91 1.98 2.85(2) 158.7 N(2)-H(2C)...O(15) 0.91 1.88 2.79(3) 179.5 N(3)-H(3C)...O(6)#1 0.91 1.88 2.76(2) 160.4 N(3)-H(3D)...O(7)#4 0.91 1.95 2.76(3) 147.1 N(3)-H(3E)...O(11)#5 0.91 2.02 2.92(3) 170.1 N(4)-H(4C)...O(5)#6 0.91 2.00 2.82(3) 149.9 N(4)-H(4D)...O(13)#1 0.91 2.06 2.97(2) 175.8 N(4)-H(4E)...O(8)#1 0.91 1.88 2.75(2) 159.7 O(15)-H(15D)...O(9)#2 0.87 2.01 2.84(3) 157.4 O(15)-H(15D)...O(10)#2 0.87 2.60 3.37(3) 146.6 O(15)-H(15E)...O(9) 0.87 1.95 2.79(3) 163.0 O(16)-H(16A)...O(12) 0.87 1.99 2.79(3) 154 O(16)-H(16B)...N(6)#1 0.87 2.57 3.38(2) 155 O(16)-H(16B)...O(12)#1 0.87 1.95 2.80(3) 165.5 O(16)-H(16B)...O(13)#1 0.87 2.521 3.12(2) 127.5
Characterization of LP1
A 14-amino acid peptide (LP1: Ac-AHQKMVESHQRMMG-NH2) containing two HX2M motifs has been synthesized and studied for
its interaction with silver ions. To confirm the stoichiometry of the Ag+/LP1 complex, DOSY experiments were recorded in the
case of the free and complexed form. The resulting diffusion constants show similar values in the case of the free and complexed form, indicating that there is no dimerization of LP1 in presence of silver ions (Figure S14).
Figure S13. LP1 1H NMR titration. Histidine imidazole 1H resonances (His-Hε1, His-Hδ2) shift by addition of AgClO4 (0 to 2 mM) to a
solution of LP1 (500 µM) in deuterated HEPES buffer (20 mM, pD 7.8).
Figure S14. DOSY experiments of apo-LP1 (A) and holo-LP1 (B). Addition of AgClO4 (8 mM) to a solution of LP1 (2 mM, HEPES 20
mM, pD 7.4) induces no significant changes in diffusion constant indicating that LP1 doesn’t oligomerize to a dimer when complexed to silver ions. Data were processed using DOSY module of Topspin 3.2.
References
1 R. B. Merrifield, J. Am. Chem. Soc., 1963, 85, 2149.
2 N. J. Anthis and G. M. Clore, Protein Sci., 2013, 22, 851.
3 A. R. Goldfarb, J. Biol. Chem., 1951, 193, 397.
4 L. J. Saidel, J. Biol. Chem., 1952, 197, 285.
5 P. Kuzmič, Anal. Biochem., 1996, 237, 260.
6 R. Czoik, A. Heintz, E. John and W. Marczak, Acta Phys. Pol. A, 2008, 114, 51.
7 G. M. Sheldrick, Acta Crystallogr. Sect. C Struct. Chem., 2015, 71, 3.
8 B. Bersch et al., Biochemistry, 2011, 50, 2194.
9 E. Cabiscol, J. Tamarit and J. Ros, Int. Microbiol., 2000, 3, 3.
10 J.-W. Chu and B. L. Trout, J. Am. Chem. Soc., 2004, 126, 900.


 2 •2H 2 O}n complex](https://thumb-eu.123doks.com/thumbv2/123doknet/14934786.665618/11.892.188.690.747.1061/figure-s-crystal-packing-ag-l-methionine-complex.webp)
 2 •2H 2 O} n .](https://thumb-eu.123doks.com/thumbv2/123doknet/14934786.665618/12.892.88.758.102.720/table-s-crystal-data-structure-refinement-ag-methionine.webp)
 2 •2H 2 O} n [Å and °].](https://thumb-eu.123doks.com/thumbv2/123doknet/14934786.665618/13.892.82.796.105.510/table-s-hydrogen-bonds-ag-l-methionine-å.webp)