HAL Id: tel-01691930
https://hal.archives-ouvertes.fr/tel-01691930
Submitted on 24 Jan 2018HAL is a multi-disciplinary open access archive for the deposit and dissemination of sci-entific research documents, whether they are pub-lished or not. The documents may come from teaching and research institutions in France or abroad, or from public or private research centers.
L’archive ouverte pluridisciplinaire HAL, est destinée au dépôt et à la diffusion de documents scientifiques de niveau recherche, publiés ou non, émanant des établissements d’enseignement et de recherche français ou étrangers, des laboratoires publics ou privés.
Aiming for illusions: The perception of size and its
influence on motor control
Hester Knol
To cite this version:
Hester Knol. Aiming for illusions: The perception of size and its influence on motor control. Space Physics [physics.space-ph]. AIX-MARSEILLE UNIVERSITE, 2016. English. �tel-01691930�
Aix-Marseille Université
Ecole Doctorale Sciences du Mouvement Humain
Aiming for illusions:
The perception of size and its influence on motor control
Hester Knol
Thèse en vue d’obtenir le grade de docteur d’Aix-Marseille Université Specialité : Contrôle Perceptivo-Moteur et Apprentissage
Soutenance le 14 décembre 2016 devant le jury composé de:
Patrick Haggard University College London Examinateur
Raoul Huys Université de Toulouse Co-directeur
Viktor Jirsa Aix-Marseille Université Directeur de Thèse Jean-Christophe Sarrazin ONERA, Salon de Provence Co-encadrant Jeroen Smeets Vrije Universiteit Amsterdam Rapporteur Frank Zaal Rijksuniversiteit Groningen Rapporteur
UMR 1106 – Institut de Neurosciences des Systèmes INS
Aan waat’ren der rust.
Foar oma
To my grandmother Gré (in memoriam)
A
bstract
The influential two-visual streams hypothesis ascribes specific functional roles to the ventral and the dorsal network of the visual system. The ventral system has been hypothesized to process information for conscious perception perception), whereas the dorsal stream processes information for action (vision-for-action). The idea of two separate visual networks in the human brain inspired an enormous amount of research over the past 20 or so years. The results are conflicting and divisive about the idea, causing a seemingly insurmountable gap between supporters and opponents. This thesis aims to unravel a part of the jigsaw puzzle of how perception and action are functioning.The Ebbinghaus figure consists of an object embedded in a specific context (e.g., centre circle surrounded by smaller or bigger circles). The perceived object size often deviates from its physical size, which is the so-called Ebbinghaus illusion. The Ebbinghaus figure has been used to distinguish vision-for-perception that is susceptible to visual illusions (i.e., relative size) from vision-for-action that remain unaffected by perceptions of relative sizes (i.e., absolute physical size). Albeit several papers report that the Ebbinghaus illusion affects solely perception, a growing number of studies demonstrate that action is similarly affected by this illusion. A rule to control the size perception of the centre object in the Ebbinghaus figure to ‘appear smaller’ or to ‘appear bigger’ does not exist so that predicting illusion magnitudes remains guesswork. Therefore, it remains also questionable whether all Ebbinghaus figures evoke an illusion, and which factors are key for illusion effects. We quantified the Ebbinghaus figure based on its geometry and systematically assessed its size illusion. One third of all Ebbinghaus configurations did not result in significant illusion effects. For the other part, the illusion effects were due to all geometrical parameters of the Ebbinghaus figure.
After the quantification of Ebbinghaus figures, a visuomotor task was implemented in which precision and speed of the voluntary movement were investigated. The visuomotor behaviour was quantitatively and qualitatively described for discrete
and reciprocal sliding movements in terms of kinematics and the underlying dynamics. The description of the visuomotor task and of the perception of Ebbinghaus figures lead to combine both visuomotor task and Ebbinghaus figures. The latter study demonstrates that the Ebbinghaus figure influences the movement. The Ebbinghaus factors that affected perception, however, did not all appear to significantly influence the movement.
Due to its systematic approach and the methodological contributions, this work can serve as a basis for future studies on the perception and action mechanisms. This dissertation demonstrated that the ventral stream and dorsal stream are not strictly functionally distinct, and that potentially different informational variables are used for ‘vision for perception’ and ‘vision for action’ irrespective of whether certain variables cause (perceptual) illusions.
R
ésumé
L’hypothèse bien connue des deux voies visuelles attribue des rôles fonctionnels spécifiques aux réseaux cérébraux ventral et dorsal du système visuel. Ce modèle émet l’hypothèse selon laquelle la voie ventrale sous-tend le traitement de l'information pour la perception consciente (vision-for-perception), alors que la voie dorsale est impliquée dans le traitement de l'information pour l'action (vision-for-action). L'idée de deux réseaux visuels distincts dans le cerveau humain a fait l’objet de très nombreux travaux de recherche au cours des 20 dernières années. Mais les résultats apparaissent contradictoires et divisent de façon catégorique la communauté scientifique entre les partisans d’une spécification anatomique pour le traitement de l’information visuelle et les adversaires. Cette thèse vise à éclaircir une partie du mystère de la façon dont la perception et l'action s’articulent.
La figure d’Ebbinghaus se compose d'un objet incorporé dans un contexte spécifique (par exemple, un cercle central entouré par des cercles plus petits ou plus grands). Dans cette situation, la taille de l'objet perçu diffère généralement de sa taille physique, un phénomène bien connu sous le nom d’Illusion Ebbinghaus. La figure Ebbinghaus a été utilisée pour distinguer la fonction d’une vision pour la perception (consciente), sensible aux illusions visuelles (taille relative), de la fonction d’une
vision pour l’action affectée par les propriétés physiques de l’objet (taille physique). Alors que les publications rapportent que l'illusion d'Ebbinghaus affecte exclusivement la perception, un nombre croissant d'études démontrent que l'action est impactée de façon similaire par cette illusion. Actuellement, il n’existe pas de règle qui permet de contrôler la perception de la taille de l’objet cible (apparaissant comme plus grand ou plus petit) dans l’Illusion d’Ebbinghaus et à partir de laquelle on puisse prédire son amplitude. Par conséquent, on peut se demander si la figure d’Ebbinghaus évoque systématiquement une illusion et quels sont les facteurs qui déterminent les effets observés. Dans une première étude, nous avons ainsi cherché à quantifier la figure d’Ebbinghaus à partir de ses propriétés géométriques et évalué de façon systématique les effets sur la taille perçue. Les résultats montrent qu’un tiers des configurations Ebbinghaus n’ont pas révélé d’effet significatif d’illusion. Pour l’autre partie des configurations Ebbinghaus en revanche, les effets d'illusion étaient dus à l’ensemble des paramètres géométriques manipulés.
Après quantification des configurations Ebbinghaus, une démarche comparable de caractérisation des mouvements visuomoteurs a été implémentée sous la forme d’une tâche visuomotrice dans laquelle les mouvements volontaires étaient étudiés sous des contraintes de précision et de vitesse. Pour des mouvements d’atteinte discrets et continus, le comportement était décrit quantitativement et qualitativement en termes de cinématiques et dynamiques sous-jacentes. La caractérisation des mouvements visuomoteurs et la quantification de la perception des configurations Ebbinghaus ont ensuite permis de concevoir une tâche visuomotrice dont les cibles étaient des figures d’Ebbinghaus. Les résultats de cette dernière étude révèlent que les figures d’Ebbinghaus influencent le mouvement. Mais, les facteurs géométriques manipulés pour affecter la perception n’influencent pas tous le mouvement.
Grâce à son approche systématique et à ses développements méthodologiques, les travaux de cette thèse pourront servir de référence pour de nouvelles études sur les mécanismes de perception et d’action. Cette thèse a également démontré que les voies ventrale et dorsale ne sont pas strictement distinctes fonctionnellement, et que différentes variables informationnelles sont potentiellement utilisées pour ‘la vision pour la perception’ et ‘la vision pour l’action’ indépendamment du fait que certaines variables causent des illusions.
P
ublications
This document summarizes the research conducted during my PhD. Some ideas and figures have appeared previously in the following:1. Knol H, Huys R, Sarrazin JC, Jirsa VK (2015) Quantifying the Ebbinghaus figure effect: target size, context size, and target-context distance determine the presence and direction of the illusion. Front. Psychol. 6:1679. doi: 10.3389/fpsyg.2015.01679. 2. Huys R, Knol H, Sleimen-Malkoun R, Temprado JJ, Jirsa VK (2015) Does changing
Fitts' index of difficulty evoke transitions in movement dynamics? EPJ Nonlinear Biomed. Phys. 3: 8. doi: 10.1140/epjnbp/s40366-015-0022-4.
3. Knol H, Sarrazin JC, Spiegler A, Huys R, Jirsa VK. Ebbinghaus figures that deceive the eye do not necessarily deceive the hand. Under review.
4. Knol H, Spiegler A, Huys R, Jirsa VK. Dynamical perception and action mechanisms under illusionary conditions using Bayesian statistics. In preparation.
A
cknowledgments
The choice to do a PhD, and to do this PhD in Marseille was a good and difficult one. I appreciate the support of many people that have been somehow important for me as a beginning scientist, for me as a colleague, for me as friend, for me as a daughter and sister.Dank je wel Raoul Huys. Thank you for sharing your knowledge and supporting me during these years. Thank you for your honesty, your trust, and advice in science and life. It was a pleasure working and learning with you. Oh, and thank you for your lovely humour, especially early in the morning before having had breakfast. You can cut your wild hairs, but please, never loose them.
Thank you Viktor Jirsa. Thank you for trust in me. Thank you for giving me the opportunity to start my PhD in your lab. Thank you for showing me around in science. Your time-to-time guidance and friendly human encounters in the lab, in the pub, and at home has made a difference.
Merci Jean-Christophe Sarrazin. Thank you for your endless motivation, and the gift to make others enthusiastic for the work we are doing. Thank you for your help with the French administrative system that is most of the time difficult for me to understand.
I would like to acknowledge the jury members: Jeroen Smeets, Frank Zaal and Patrick Haggard. Thank you for your time and interest in my work.
Thank you INS-members for sharing ideas, cakes, food, and drinks.
Thank you ONERA DCSD in Salon de Provence for welcoming me even though I was hardly ever around. Merci Francine, Christelle, Bruno, Sami, Kevin, Laurent. Thank you Pascale and Véro for being my friends, for taking care of me when it was necessary, and most of all for making me feel home.
Thank you Christophe for bringing music and bad words in my life that made me survive in Marseille (and its traffic).
Merci Lisbeth, Isabelle, Fabienne for doing beautiful music projects, having wonderful rehearsals with aperos in the pool, and thank you for being friends. Also thank you Thierry, Daniele, Jean-Claude and Anne-Marie for sharing the joy of music and our wonderful rehearsals! Merci Henri, for your support and for welcoming me/us at your beautiful place.
Thank you Galina Mal-IEIE-va, ma chérie (chérie lady), for being my friend through good and bad days.
Thank you Paula for being a beautiful, creative, nerdy, loving, helpful, and understanding friend that made me feel welcome in a time where everything was new.
Thank you Tim Proix for hosting me and helping me out when I arrived in Marseille, and for all the good times outside the lab.
Thank you friends that reminded me of the beautiful, and sometimes challenging life outside of the lab and being a bit of family to me: Isabelle, Caro, Antoine, Paolo, Rohit, Ana, Javi, Seb, Carlijn, Niek, Solveig, Kasia, Spase, Claude, Svetlana, Piotr, Rita, Richard, Luka, Marisa, Tim Kunze, Martin, Marta, Jorge, Mathieu, Stefania, Domagoj, Huifang.
Thank you Marmaduke for your technical support, and thanks you for sharing some of your ideas about how to make this world a good/better place. Thank you Mireille, for sharing your ideas about science.
Thank you Irene and Julie, and previously Adam, Francesca, Marcel, and Emmanuel for being my office buddies to share cookies, weekend-stories, and work-stuff with. Foar myn leaven. To my friends that I left (spatially) at home, but that remained my deepest friends and support and will remain connected to me wherever I go on this planet.
I want to thank my grandparents pake Tseard and beppe Tryntsje, and my lovely, big family. Especially I owe a big ‘thank you’ to my parents and Dolon, for loving me and supporting me always, for assuring me to take risks, and to go for nothing else but everything. Ik hâld fan jim.
No word will catch my gratitude for you with the right tone and feeling, Andreas. Thank you, for sharing life with me.
C
ontents
1 Introduction
1
1.1. Preliminaries 1
1.2. Dichotomy of the visual system 2
1.2.1. The two-visual systems hypothesis 2
1.2.2. Visual illusions as a tool to study the dichotomy 3 of the visual system
1.2.3. The perception of Ebbinghaus figures 5
1.3. Illusion effects on movement 6
1.3.1. Dynamical systems underlying movement 6
1.4. Outline of the thesis 8
2.
Perception : Quantifying the Ebbinghaus figure effect.
10
2.1. Abstract 10
2.2. Introduction 11
2.3. Material and methods 15
2.3.1. Participants 15 2.3.2. Apparatus 15 2.3.3. Procedure 16 2.3.4. Data analysis 17 2.4. Results 18 2.4.1. Illusion magnitude 18 2.4.2. Area of uncertainty 20 2.4.3. Response time 21
2.4.4. Correlations between illusion magnitude, area of uncertainty, 22 and response time
2.5. Discussion 23
2.5.1. Summarized findings 23
2.5.2. Models describing the Ebbinghaus illusion 27
2.5.3. Illusion effects in motor tasks 30
2.5.4. Methodological concerns 31
2.5.5. Conclusion 33
3. Action : Does changing Fitts’ index of difficulty evoke
transitions in movement dynamics?
34
3.1. Abstract 34 3.2. Introduction 35 3.3. Methods 38 3.4. Results 41 3.5. Discussion 50 3.6. Conclusions 54
3.7. Supplementary information 57
4. Perception-Action : Ebbinghaus figures that deceive the eye
do not necessarily deceive the hand.
64
4.1. Abstract 64 4.2. Introduction 65 4.3. Methods 72 4.3.1. Participants 72 4.3.2. Apparatus 72 4.3.3. Procedure 74 4.3.4. Movement parcellation 74 4.3.5. Dependent measures 77 4.4. Results 79
4.4.1. Fitts’ law – the effect of target size on non-normalized durations 79
4.4.2. Illusion effects 80
4.4.3. Perceptual categories 82
4.4.4. Correlation perception and movement time 82
4.4.5. Vector field angles 83
4.4.6. Difference probabilities 85
4.4.7. Classified movement endpoints 86
4.4.8. Endpoint distribution 86
4.5. Discussion 87
4.6. Supplementary information 98
5. Perception and Action Mechanisms
102
5.1. Introduction 102 5.2. Background 103 5.2.1. DST – motor control 103 5.2.2. DST – perception 105 5.2.3. DST – perception-action coupling 108 5.3. Methods 115 5.4. Preliminary results 116 5.5. Discussion 118
6. General Discussion
124
6.1. Summary 1246.2. Dichotomies in perception and action 126
6.2.1. Dichotomy between conscious and unconscious perception 126
6.2.2. Dichotomy between conceptual and perceptual knowledge 129
6.2.3. Dichotomy between discrete and rhythmic movements 130
6.3. Illusions from a constructivist and ecological perspective 131
6.4. Methodological contributions and limits 134
6.5. Future directions 137
6.6. Conclusions 139
Abbreviations:
PCA Principal Component Analysis
TVSH Two Visual Streams Hypothesis
ID Index of Difficulty
CV Coefficient of Variation
SD Standard Deviation
DST Dynamical Systems Theory
RD-model Rayleigh damping and Duffing oscillator model
MT Movement Time
AT Acceleration Time
DT Deceleration Time
C
hapter 1 | General introduction
“Experience is not a thing that happens to people, but a thing that people do.”
- O’Regan
1.1 Preliminaries
Visual perception is a crucial part of a functioning human being. Since ancient times, scientists have been fascinated by the way human beings perceive the world. Perception can hardly exist without movement of one-self or its’ surrounding. Think of, for example, eye movements. Even when we think we are not moving, our eyes are making little rapid movements (so called saccades) that allow building an understanding of our visual environment. Thus perception and action are crucially linked. But how perception and action are functionally coupled and coordinated remains a puzzle. As a logical consequence, numerous studies have investigated how our body deals with visual perception, goal-directed movements, and how perception and movements are coupled.
One influential hypothesis that gained much attention in the last decades is the two visual streams hypothesis (TVSH). This hypothesis proposes that visual information for perception is processed relatively independently from the visual information for action. Visual illusions have been used as a tool to make a distinction between the ventral stream that processes ‘vision for perception’ and the dorsal stream that processes ‘vision for action’. The ventral stream is found to be sensitive to the relative size of objects and therefore sensitive to size-illusions, whereas the dorsal stream is processing the absolute, physical size information of objects and thus remains unaffected by size-illusions. The hypothesis has been widely endorsed, but
also met much criticism. The experimental results of the last 20 years are contradictory and inconclusive.
In the work that is presented in this thesis we study the perception of size illusions on perception and action. We aim to quantify the perception of a size illusion in order to answer the question whether perception is always sensitive to size illusions. Subsequently, the question whether size illusions will influence movements, and if so, if these effects depend on the movement type, can be answered.
In order to gain a deeper understanding in the nature of the theoretical debate, the following sections will provide a short overview of the background of the two visual systems hypothesis and the results from psychophysical experiments. This section will be followed by an overview of the influence of visual illusions on movements in the framework of the dynamical systems theory.
1.2 Dichotomy of the visual system
By focusing on the neural areas and connections involved in (cognitive) processes, neuroscientists raised one important dichotomy of the visual perception system in the 1980s. The first discussion of an anatomical dichotomy of the visual system concerned the distinction of ‘vision of object identity’ and ‘vision of space’ that were localized in the subcortical geniculostriate and tectofugal systems, respectively (Trevarthen, 1968). In 1982 Ungerleider and Mishkin found that macaques with lesions in the inferotemporal cortex were unable to identify objects, but maintained the ability to locate objects. The macaques with lesions in the posterior parietal cortex showed the inverse pattern. Subsequently, the geniculostriate-tectofugal dichotomy was replaced by a cortical dichotomy of the visual system with corticocortical connections originating in the striate area that are mediating both vision of object identity and of space (Ungerleider and Mishkin, 1982). They referred to the distinct cortical visual systems as the ‘what’ and the ‘where’ system.
Following the influential work of Ungerleider and Mishkin (1982), a hypothesis was forwarded in which two visual processing systems were not identified as ‘what’ and ‘where, but as ‘vision for perception’ and ‘vision for action’ (Goodale and Milner, 1992; Milner and Goodale, 1995). The two visual systems hypothesis (TVSH) was established after studies with patient D.F. Patient D.F. suffers from visual agnosia as a result of accidental monoxide poisoning that damaged the ventral stream of the visual system (e.g., Murphy et al., 1998). The ventral pathway is projecting from the primary occipital cortex to the inferotemporal cortex. Damage to the ventral pathway can lead to visual agnostic patients that are unable to identify or recognize objects but are successful in performing motor tasks with these objects. For example, a letter would not be recognized as being a letter, but could nevertheless be successfully put in a mailbox. Damage to the dorsal cortical pathway that projects from the primary occipital cortex to the posterior parietal cortex, can result in optic ataxic patients. Optic ataxic patients are unable to reach accurately to objects, although they can recognize the object (e.g., Perenin and Vighetto, 1988). This led scientists to functionally dissociate the visual system into a ventral and dorsal stream. The ventral stream processes visual information for conscious perception, whereas the direct visual guidance of action is the exclusive avocation of the dorsal stream (Milner and Goodale, 1995).
1.2.2 Visual illusions as a tool to study the dichotomy of the visual system
Visual illusions1 that can make objects or representations look smaller or bigger than
they are have been applied to study the extent to which the ventral and dorsal stream are functionally distinct. Examples of contextual illusions are the Müller-Lyer figure and the Ebbinghaus figure (also called Titchener circles; see figure 1.1). The logic behind the visual illusion application is that the perception of object size operates within the allocentric frame of reference. Encoding target position, as well as planning the arm trajectory towards it, can be influenced by the spatial relationships that the target has with environmental cues (Conti and Beaubaton, 1980; Foley, 1975;
1In philosophy it is debated what visual illusions are, whether they exist, or even, whether
everything we perceive is necessarily an illusion. I acknowledge the debate, but in the rest of this thesis I will adopt the nomenclature as is commonly used in conventional papers on perception and Ebbinghaus figures and alike.
Gentilucci and Negrotti, 1996; Toni et al., 1996; Gentilucci et al., 1997). Thus, perception of object size is thought to be mostly relative and rarely in physical measures (Aglioti et al., 1995). Therefore, placing an object next to surrounding objects that are smaller (or bigger) can ‘fool’ the size perception. At the other hand, the information required for movements towards objects is likely to be processed within an egocentric frame of reference, that is, a frame of reference centered on the body of the agent in order to encode target position in space (Soechting and Flanders, 1989; Gentilucci et al., 1997). This body scaled information about object size remains unaffected by the contextual information, and thus will not be ‘fooled’ by visual illusions.
Many psychophysical tasks have been performed to falsify the TVSH in pointing and grasping tasks. Aglioti, DeSouza, and Goodale (1995) surrounded poker-chips with smaller and bigger circles (the Ebbinghaus illusion, Fig. 1.1 B) and asked participants to perceptually judge the size in the pre-test phase, and pick up a poker-chip in the test-phase. The Ebbinghaus illusion had a powerful effect on the perceptual judgment of object size, but grasping the same object remained largely scaled according to the actual object’s size. The authors concluded that the “calibration of grip aperture is quite refractory to the compelling size-contrast illusion” (p. 684). These results were confirmed by multiple studies implementing various contextual illusions in perception or/and action (mainly grasping and
Figure 1.1 Examples of geometrical size-weight illusions, with in (A) the
van Doorn et al., 2009; Haffenden et al., 2001; Stöttinger et al., 2012; Fischer, 2001; Alphonsa et al., 2014). Though these numerous studies have shown a functional distinction between the ventral and dorsal stream, the body of studies contradicting these findings and interpretations is accumulating (e.g., Franz et al., 2000, 2001; Pavani et al., 1999; Vishton et al., 1999; Franz, 2001; van Donkelaar, 1999; Brenner and Smeets, 1996; Smeets and Brenner, 1995).
These conflicting results from psychophysical studies have been partly explained by methodological differences in grasping and pointing tasks (Bruno et al., 2008; Bruno and Franz, 2009). Some methodological concerns have been raised with regard to the validity of the way perception and action were compared
(Franz and Gegenfurtner, 2008; Pavani et al., 1999; Franz et al., 2000), and how (if at all, see van Donkelaar, 1999; Jackson and Shaw, 2000; Westwood et al., 2000; Ellenbürger et al., 2012) perception was quantified (e.g., Smeets and Brenner, 2006). These methodological weaknesses, and the variety of the applied measures, leave scientists, to date, with an insuperable gap with regard to the debate whether the visual system is functionally distinct.
1.2.3 The perception of Ebbinghaus figures
The Ebbinghaus figure is applied to experimental paradigms for over 100 years. The application of Ebbinghaus figures for studying the possible dissociation of the ventral and dorsal stream gained popularity since the landmark paper of Aglioti, DeSouza and Goodale (1995). However, to date, a rule describing the illusion effects as a function of the parameters that create this illusionary effect is absent. A few studies have systematically tested several parameter combinations to find the principal factors evoking the illusion effect (Massaro and Anderson, 1971; Roberts et al., 2005; Nemati, 2009). These studies found different factors contributing to the illusion effect: the size of the center circle, the context circle size, the number of context circles (Massaro and Anderson, 1971; Roberts et al., 2005), the distance between the context circle and the center circle (Roberts et al., 2005; Im and Chong, 2009), and the size of the area of empty space between the context circles (Nemati, 2009). However, the rules proposed by the latter authors did not specify the interplay
of the parameters. Therefore, the source(s) of the illusion effects remains unknown, which hinders predictions of illusion effects in the application of Ebbinghaus figures in experiments.
1.3 Illusion effects on movement
Like the various methods to capture the illusion effects on visual perception, numerous methods have been applied to capture the illusion effects on movements. Next to grasping movements, pointing movements have been a popular method mainly since the work of psychologist Paul M. Fitts who proposed a quantification of difficulty in pointing tasks. The law proposed by Fitts finds it origin in information theory. It describes the relation between target size, target distance, and the result on the performance (i.e., movement time) (Fitts, 1954). Fitts’ law poses that the required time to successfully execute an aiming movement increases linearly with task difficulty. The prediction of movement time with regard to the target size and the distance allows for verification of the influence of perceived target size on the movement time. This idea resulted in Fitts’ tasks with the Ebbinghaus (like) figure as target (Fischer, 2001; Alphonsa et al., 2014; van Donkelaar, 1999; Handlovsky et al., 2004; Ellenbürger et al., 2012; Lee et al., 2002). This way of studying the TVSH did not, however, resolve the conflicting results that were pointed out in the section 1.2.2.
1.3.1 Dynamical systems underlying movement
An important question is how all the components (i.e., cells, tissue, organs, muscles) of a human body can lead to controlled motor behavior in order to achieve a goal. Motor behavior such as motor coordination is viewed as self-organized pattern formation processes. In 1980 Kugler, Kelso and Turvey presented a concept of movement and control in terms of dynamical structures. Coordination dynamics aims to identify generic principles of pattern formation by searching for phenomenological laws of perceptual-motor behavior. Coordinated movements are spontaneously performed following characteristic stable patterns of behavior. The focus lies on the stability properties of the system under study, changes in stability and number and type of solutions as a function of parameters (bifurcations), and
famous example is a bimanual finger wiggling experiment at some relative phase and at a certain frequency. The fingers are wiggled in the same direction (to the mid-line), and are moving in-phase when the fingers move in the same direction and with the same frequency and phase. Two stable relative phases were found, 0° and 180°. All other relative phases are highly unstable. Furthermore, 0° is more stable that 180°. If the frequency of finger wiggling is increased while moving at 180°, the participants will spontaneously make a transition to 0°. The opposite, transitioning from 0° to 180°, is not true.
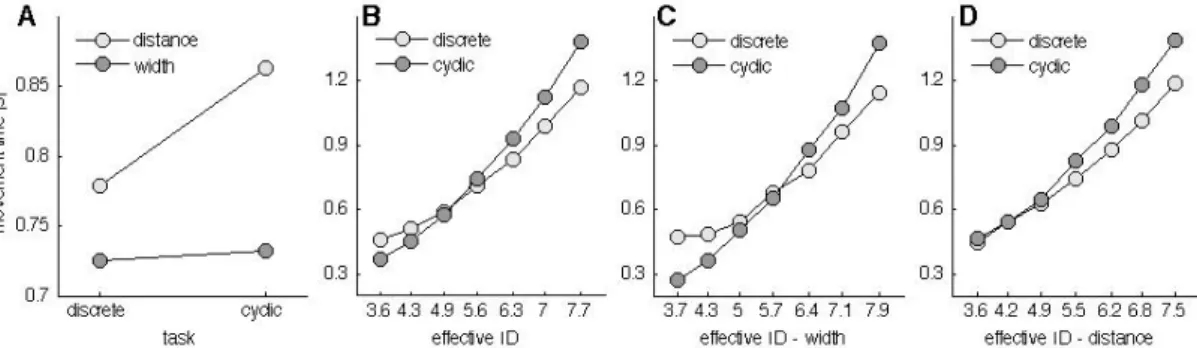
Since the late 1990s the behavior resulting from the Fitts’ pointing tasks has been studied with respect to the principles of the dynamical systems theory. Fitts’ tasks have been studied with respect to the question whether discrete and continuous movements can be considered to be distinct, driven by different control processes. The dynamical systems theory (DST) offers a classification principle based on phase flow topologies, which identify all behavioral possibilities within a class. This classification is model-independent; every behavior within a class can be mapped upon others, whereas maps between classes do not exist. Systems belong to the same class if, and only if, they are topologically equivalent. Motor control and timing mechanisms governed by different topologies can thus not be reduced to each other: they belong to different equivalent classes.
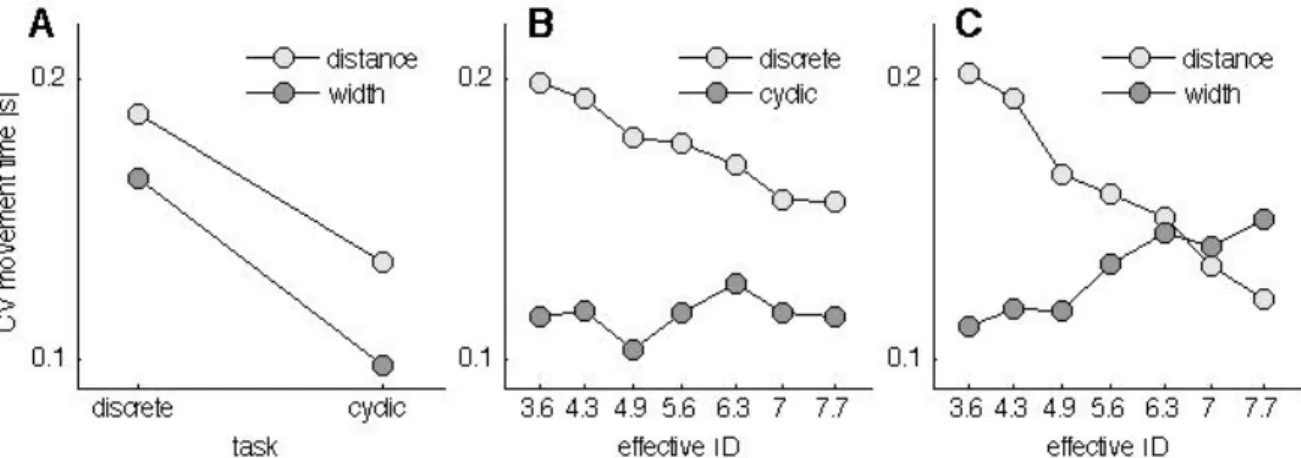
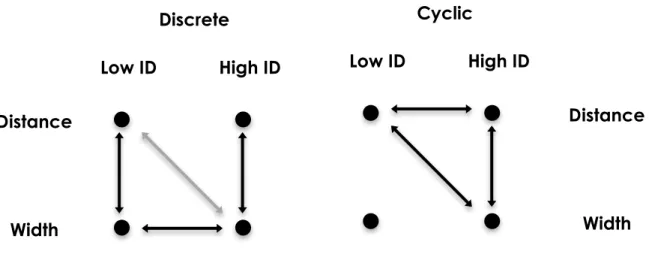
The relation between task difficulty and movement time has been shown to be continuous. However, discontinuities have been observed in both reciprocal as well as discrete Fitts’ tasks (Huys et al., 2010a; Sleimen-Malkoun et al., 2012). The discontinuity has been mainly ascribed to an abrupt transition between two distinct dynamic regimes that occurs with increasing the task difficulty. These two dynamic regimes that have been identified are limit cycle and fixed point behavior (Huys et al., 2010a; Buchanan et al., 2004). A limit cycle is a trajectory that returns to its starting point, thus describes a closed orbit in the state space, which is spanned by the position of the movement x(t) at time t and its change in time dx(t)/dt. Limit cycle behaviour is typically used to describe rhythmic activity. A fixed point instead is a location in the state space at which there is no movement, that is, no changes in time
dx(t)/dt = 0. The behaviour around a fixed point is discrete (attracting or repelling). Thus the start position and the target can be ascribed as repelling and attracting for movements in discrete Fitts’ tasks. By observing this abrupt transition from limit cycle behaviour to fixed-point behaviour suggests that the human nervous system abruptly engages a different control mechanism when task difficulty increases. Again, task difficulty comprises the target width and the distance to the target, and thus task difficulty can be changed by changing target width or distance. However, it remains unclear whether the transition between limit cycle behavior and fixed-point behavior are evoked similarly under the distance and width induced scaling of task difficulty.
Another factor that might influence a transition from one behavior to the other is the perceived target width or distance. For example, if a target is perceived as being smaller than it is, the question arises whether the behavior then follows the perceived or the physical target size. To date, however, it remains unknown whether the subjectively perceived target width can influence this transition and the corresponding movement dynamics underlying the Fitts’ task. Possibly, the contradicting results identified in motor tasks with incorporated size-weight illusions share one common denominator: the sensitivity of motor regimes to size-weight illusions is different.
1.4 Outline of the thesis
The conflicting results of various studies incorporating size-weight illusions lead to the main aim of this thesis, that is, to unravel whether the relative size perception of a target influences the movement towards it. More precisely, the objective is to quantify the perception of the Ebbinghaus figure, the movement dynamics of Fitts’ tasks, and finally how the quantified Ebbinghaus figures influence movement dynamics of the quantified Fitts’ tasks. In order to shed light on the influence of relative size perception on movements, a structured and thorough study of visual perception, and the perception-action interaction is called for.
Therefore, chapter 2 is dedicated to the quantification of the Ebbinghaus figure size percept for a set of 30 conditions that are Fitts’ task compatible. In this chapter, the range of parameter combinations are studied in a systematic fashion with a method that is well known in psychophysics and vision research, but has not yet found its way in the study of size-weight illusions. In order to identify how the parameters of Fitts’ task (i.e., the target size and the distance to the target) are influencing the transition between motor control regimes, an experiment that quantified discrete and reciprocal aiming movements is presented in chapter 3. In this chapter a systematic scaling of a large range of parameter combinations of a classical Fitts’ task leads to a further detailed description of Fitts’ law.
Chapter 2 and Chapter 3 subsequently lay the foundation for Chapter 4 in which the effect of the perception of Ebbinghaus figures on the motor control in a set of Fitts’ tasks is reported. In Chapter 5 we elaborate on the possible mechanisms that underlie perception and action. The thorough examination of perception (Chapter 2) and movement (Chapter 3 and 4) with a carefully designed analysis lead to novel insights concerning the influence of the Ebbinghaus figure on motor control, and leaves space for a debate on the general coupling of perception and action (Chapter 5). Finally, Chapter 6 comprises a discussion about alternative dichotomies of visual information processing, and a reflection on the results from a constructivist and ecological approach. The thesis concludes with indications for future research that could foster our knowledge of the visual system and the link between perception and action.
C
hapter 2 | Perception : Quantifying the Ebbinghaus figure
effect
2“No two people see the external world in exactly the same way. To every
separate person a thing is what he thinks it is -- in other words, not a thing, but
a think.”
- Penelope Fitzgerald
2.1 Abstract
Over the last 20 years, visual illusions, like the Ebbinghaus figure, have become widespread to investigate functional segregation of the visual system. This segregation reveals itself, so it is claimed, in the insensitivity of movement to optical illusions. This claim, however, faces contradictory results (and interpretations) in the literature. These contradictions may be due to methodological weaknesses in, and differences across studies, some of which may hide a lack of perceptual illusion effects. Indeed, despite the long history of research with the Ebbinghaus figure, standardized configurations to predict the illusion effect are missing. Here, we present a complete geometrical description of the Ebbinghaus figure with three target sizes compatible with Fitts’ task. Each trial consisted of a stimulus and an
2 Published as Knol H, Huys R, Sarrazin J-C, Jirsa VK (2015) Quantifying the Ebbinghaus figure
isolated probe. The probe was controlled by the participant’s response through a staircase procedure. The participant was asked whether the probe or target appeared bigger. The factors target size, context size, target-context distance, and a control condition resulted in a 3×3×3+3 factorial design. The results indicate that the illusion magnitude, the perceptual distinctiveness, and the response time depend on the context size, distance, and especially, target size. In 33% of the factor combinations there was no illusion effect. The illusion magnitude ranged from zero to (exceptionally) ten percent of the target size. The small (or absent) illusion effects on perception and its possible influence on motor tasks might have been overlooked or misinterpreted in previous studies. Our results provide a basis for the application of the Ebbinghaus figure in psychophysical and motor control studies.
2.2 Introduction
Optical illusions evoke a perceived image, color, contrast, lightness, brightness, or size that differs from the physical ‘reality’ of the figure. These illusions have mainly been used to test theories predicting the successes and failures of the perceptual system, particularly by the Gestalt school (Robinson, 1998). Optical illusions have been classified based on the behavioral manifestation of forty-five illusions (e.g. Coren et al., 1976). One commonly mentioned class is the one of size-contrast illusions, in which the size of an element is affected by its surrounding elements. A famous size-contrast illusion is the Ebbinghaus figure (see Figure 2.1), also called Titchener circles.
For over a century the Ebbinghaus figure has been used in experimental psychology to evoke an optical illusion of the perceived circle size. The Ebbinghaus figure consists of a target circle (a in Figure 2.1A) that is surrounded by multiple context circles (b in Figure 2.1A). It is thought that by surrounding the target with small or big circles, the target will appear bigger or smaller, respectively (Obonai, 1954; Massaro and Anderson, 1971). More than ten theories have been trying to explain the physiological mechanism(s) responsible for the over- and underestimation of the target (for a review see: Robinson, 1998). However, attempts
to quantify the illusion magnitude of this widely used geometrical visual illusion have not resulted in a (complete set of) geometrical rule(s), which is in all likelihood at least partly due to the broad spectrum of parameters involved. Several rules have been developed to identify the principal factors influencing the perceptual judgment evoked by the Ebbinghaus figure (e.g. Massaro and Anderson, 1971; Roberts et al., 2005; Nemati, 2009). Principle factors that have been identified are the size of the target (a in Figure 2.1A), the context circle size (c in Figure 2.1A), the number of context circles (Massaro and Anderson, 1971; Roberts et al., 2005), the target-context distance (b in Figure 2.1A; Im and Chong, 2009; Roberts et al., 2005) and the size of the area of empty space between the context circles (Nemati, 2009). However, these proposed rules do not specify the exact interplay between the three parameters specified in Figure 2.1A, which makes utilization of these rules for parameter selection and the prediction of the corresponding illusion effect tricky if not impossible. Furthermore, these rules have barely been validated. Indeed, Franz and Gegenfurtner (2008) concluded their review stating that: “…currently not much is known on the exact sources of the Ebbinghaus illusion.”
Figure 2.1 (A) The parameters of the Ebbinghaus figure with the radius of the target
(a) and the context (c), and the distance from the target center to the context center (b).
(B) Example of the Ebbinghaus stimulus with the scaling probe (not scaled to real
size). The distance between the center of the probe and the center of the target was 16 cm. The context circles covered approximately 75 % of the circumference.
This lacuna did not withhold experimentalists to employ this figure to shed light on the so-claimed distinction between the ventral and dorsal visual pathway (see the review of Franz and Gegenfurtner, 2008). Accordingly, the visual system contains two distinct streams: the ventral pathway is specialized in processing information leading to conscious perception whereas the dorsal pathway is specialized in processing information for sensory-motor action (Goodale & Milner, 1992; Milner & Goodale, 1995). The dorsal stream encodes visual information into the required coordinates for skilled motor behavior, and does this in absolute metrics determined relative to the observer (egocentric frame of reference), whereas the ventral stream encodes the information into object properties relative to the properties of other objects (scene based frame of reference), and therefore provides a rich and detailed representation (Goodale, 2014). Based on this hypothesis, online control and the programming of movements would recruit the dorsal stream and, since absolute metrics are determined relative to the observer and not relative to the context of the object, would therefore be insensitive to visual illusions (Goodale, 2014; Milner & Goodale, 2008).
Several studies have reported evidence for the illusion insensitivity during grasping movements (Aglioti et al., 1995; Franz and Gegenfurtner, 2008; Stöttinger et al., 2010, 2012; Haffenden et al., 2001). However, these findings seem to mismatch with studies that show a clear effects of visual illusions on grasping (Franz et al., 2000; Pavani et al., 1999) and pointing (Gentilucci et al., 1996; van Donkelaar, 1999). These seemingly contradicting results led to the hypotheses (for a review see Franz & Gegenfurtner, 2008) that a clear functional dissociation between perception and action cannot be made (Franz et al., 2000; Gentilucci et al., 1996), that the ventral pathway would have to be partially involved (Carey, 2001; Aglioti et al., 1995), and that two dorsal pathways (e.g., the use and grasp system) exist in stead of one (Binkofski and Buxbaum, 2013).
Seemingly conflicting results of studies that quantified the illusion effect in perception and movements tasks may be explained in various methodological ways (Bruno et al., 2008; Bruno and Franz, 2009). Franz (2001) classified two measurement
types, to which he referred as the standard and the non-standard perceptual measures. In the standard method, participants either compare the size of two illusion stimuli or of one probe and one illusion stimulus. In the non-standard method, participants scale the aperture (with or without vision of the hand) to indicate the perceived size. Potential problems arising in the standard method are: First, by changing the size of the inner circle of an Ebbinghaus figure, as in Aglioti et al. (1995), it is not just the target size that is changed but also the distance from the target to the context circle, and therefore also the illusion magnitude (Roberts et al., 2005). Second, sometimes a stimulus-stimulus configuration is used in the perceptual task whereas a stimulus-probe configuration is used in the motor task (as in Aglioti et al., 1995). Third, if a task consists of comparing stimulus A with stimulus B, the question comes up which stimulus evokes an illusion effect (if any). For the non-standard method, a potential problem is that it is questionable that studying the perceptual illusion effect by asking participants to scale their aperture indeed provides a ‘pure’ perceptual measure. Note that this method has generated conflicting results (Haffenden and Goodale, 1998; Daprati and Gentilucci, 1997). Across methods, if graspable targets are used (in the perceptual task), the minimum stepsize of the target or probe might be relatively big compared to the illusion magnitude. Furthermore, Franz & Gegenfurtner (2008) identified methodological biases and statistical corrections in the comparison of perception and movement task data. There are, however, also studies that have not quantified or reported the illusion effect on perception (e.g. van Donkelaar, 1999; Ellenbürger et al., 2012; Jackson and Shaw, 2000; Westwood et al., 2000), or have not used a control condition (Ellenbürger et al., 2012). To recapitulate, the conflicts in the reported results may well be due to the various methods used, and potential weakness therein as discussed here above. Consequently, it is hard, if possible at all, to draw strong conclusions about the proposed dissociation of the ventral and dorsal stream in perceptuomotor tasks based on research using optical illusions.
With the aim to (partly) fill this gap, we here provide a fully parameterized Ebbinghaus figure, and systematically quantified the illusion effect for parameter ranges that are relevant for behavioral experiments. Thereto, we used a methodology
that is well established in the psychophysics literature, namely, the staircase procedure. We predicted that target size, context size, and target-context distance would affect the perceived target size of the Ebbinghaus figure, but that some parameter combinations, in particular those involving small target sizes (Massaro and Anderson, 1971), would fail to elicit a significant illusion effect. Intuitively, we further expected that some stimulus configurations, in particular those evoking a strong illusion effect, would be perceptually more distinct than others, and that this would affect the decision making as expressed in the response times. That is, we expected response time to scale inversely with perceptual distinctiveness. Our results will be able to guide future experimentalists, which, we hope, will contribute in clarifying the role of the ventral stream in the guidance of motor behavior.
2.3 Materials and methods 2.3.1 Participants
Twelve participants (6 females and 6 males, age mean ± SD = 28.9 ± 3.5) with normal or corrected to normal vision volunteered in the experiment. The experiment was performed in accordance with the Helsinki Declaration and all participants gave a written informed consent prior to their participation.
2.3.2 Apparatus
The visual stimuli were drawn and generated using the Psychophysics Toolbox in Matlab R2009b (The MathWorks Inc., Natick, MA) (Brainard, 1997; Kleiner et al., 2007). Black stimuli were presented against a white background (see Figure 2.1) and multisampled to control for aliasing effects. To prevent interference from previous trials and to control hemispace bias the stimuli were randomly presented on the left or the right side of the screen while an isolated probe (i.e., target without context circles) was presented simultaneously on the opposite side of the screen at a distance of 16 cm from the stimulus (and at the same height). The stimuli were displayed with a Dell Precision T3610 and Nvidia Quadro K2000 video card on a Dell P2714H monitor with a resolution of 1920 × 1080 pixels (597.9 × 336.3 mm, 52.96° × 29.27°)
and a frame rate of 60 Hz. The participants sat at a 60 cm distance from the monitor and their heads were supported with a chin-rest so as to ensure that the distance between the head and the monitor remained fixed.
2.3.3 Procedure
Based on a fully geometrical description (Figure 2.1A), three target sizes (2 × a in Figure 2.1A), three target – context distances (b in Figure 2.1A), three context sizes (bigger, equal, and smaller than the target; c in Figure 2.1A), and three control conditions (isolated targets) were selected, resulting in a 3 × 3 × 3 + 3 factorial design. The equidistantly spaced context circles covered approximately 75 percent of the circumference in all conditions to control for the completeness of the surround (Roberts et al., 2005). Consequently, the number of context circles varied as a function of context size and target-context distance. The stimuli diameters were 0.5, 1.0 and 2.0 cm. (These sizes were chosen with an eye on planned future studies involving Fitts’ task; the corresponding indices of difficulty (i.e., ID=log2(2D/W), where D and
W represent the distance between the targets and the target width (Fitts, 1954), were 6, 5 and 4, respectively.) Context sizes were 20, 100 and 180 percent of the target size; i.e., 0.1, 0.5 and 0.9 cm for the small target, 0.2, 1.0, and 1.8 cm for the medium target, and 0.4, 2.0, and 3.6 cm for the big target. Three distances from the center of the target to the center of the context circles (i.e., b in Figure 2.1A) were calculated based on the smallest distance being 10 percent bigger than the radius of the target plus the radius of the biggest context; i.e., 0.8 cm for the small target, 1.6 cm for the medium target, and 3.0 cm for the big target. The other two distances were incremented with 0.6 cm for each distance. All dimensions were corrected for pixel size and rounded to the nearest integer.
A two-down, one-up staircase procedure was used to find the perceptual threshold between the probe and the target in which the probe size was adjusted (García-Pérez, 1998). Two staircases per condition were used, one in which the initial condition of the probe was 0.4 cm bigger than the target size, and one in which it was 0.4 cm smaller. Each staircase started with a probe diameter step size of four pixels (i.e., 0.12 cm). The participants were tasked with pressing a key (A or L) for the
bigger appearing target or probe on the left (A) or right side (L) of the keyboard corresponding to the target and probe location on the screen. Depending on the response of the participant, the probe size was adjusted according to the two-down, one-up staircase procedure. In a sequence of responses, a reversal is the event where the response to probe n deviates from that at n-1. After each reversal the step size was halved, until the minimum of one pixel (i.e., 0.03 cm) was reached, which was then retained. The participants were instructed to respond as soon as they had decided which key to press, but it was made clear that it was not a reaction time task. After each key press, the stimulus disappeared and a random noise window was displayed for one second followed by a fixation cross (duration: 0.5 s). Then the next stimulus with the adjusted probe appeared. A staircase was terminated and removed from the cue after a participant had reversed the direction of the staircase 11 times. After five conditions, the participants could take a small pause. Upon completing the first half of the experiment, the participants took a ten to fifteen minutes break. The entire experiment lasted for about 2 hours.
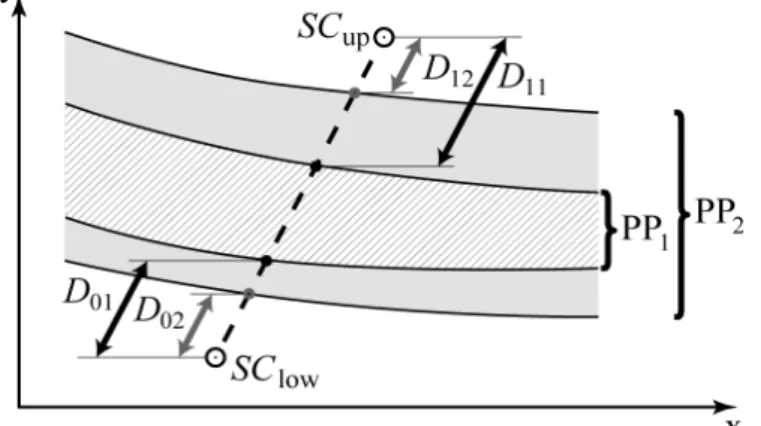
2.3.4 Data analysis
From the last 10 reversals, the perceptual threshold (PT) was calculated according to equation 2.1, PT = 1 mΣj=1 m 1 nΣi=1 n SC upi + 1 nΣi=1 n SC lowi ⎛ ⎝⎜ ⎞ ⎠⎟ (2.1)
in which m corresponds to the number of staircases (here 2), n represents the number of reversals taken into account (here 10), Explicitly, the mean of SCup and SClow are
calculated based on the last 10 reversals and are referred to as the upper and lower staircase threshold respectively. The range between the mean SCup and mean SClow
reflected the area of uncertainty (AU; Equation 2.2).
AU = 1
nΣin=1SCupi −
1
nΣin=1SClowi (2.2)
To control for inter-individual differences in the judgment of the target sizes in the control condition, and to allow for inter-individual and inter-trial comparisons, the judgments were corrected by subtracting the perceptual threshold of the control
trial (PTcontrol) from the corresponding perceptual threshold of each trial (PTtrial), i.e.,
IM = PTcontrol – PTtrial, where IM stands for illusion magnitude. For the statistical
analyses and the visualizations, the illusion magnitude was used.
Response time was defined as the time between stimulus presentation onset and the participant’s response. We next computed the average response time before a participant crossed one of the staircase thresholds for the first time (referred to as RTbase). For this procedure, the first response was omitted. The average response time
following this threshold crossing was referred to as RTAU.
Three-way repeated measures ANOVAs with target size (a in Figure 2.1A), distance (b in Figure 2.1A), and context size (c in Figure 2.1A) as within participants factors were performed to investigate the effects on the illusion magnitude and the area of uncertainty. If significance levels were met (a = .05), the tests were followed up by Bonferroni post-hoc tests (a = .05). A four-way repeated measures ANOVA with target size (a), distance (b), context size (c), and response moment (RTbase, RTAU)
as within participants factors was used to investigate significant effects on response time. The degrees of freedom were corrected according to the Greenhouse-Geisser method to control for non-sphericity of the data if necessary. If this was the case, the adjusted degrees of freedom were reported below. In order to examine if the perceived size of the targets of the illusion trials were significantly different form those of the control trials, a paired samples t-test was performed for each condition. Pearson correlation coefficients were calculated to investigate potential (linear) correlations between response time, area of uncertainty and illusion magnitude, and between the response time before the area of uncertainty for the upper and lower staircase.
2.4 Results
2.4.1 Illusion magnitude
Recall, for the statistical analysis the control perceptual threshold (PTcontrol) per target
size was subtracted from the PTtrial to control for the participants’ ability to judge
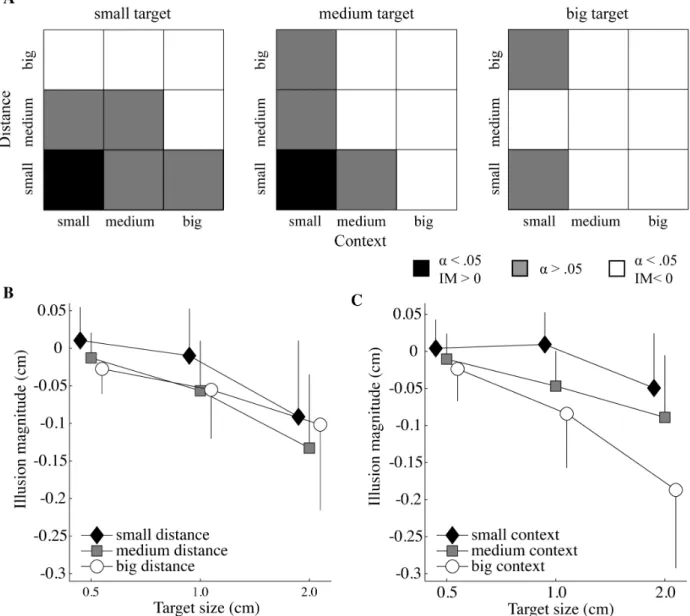
targets of different sizes. Figure 2.2A displays the results of the paired samples t-tests to investigate if the illusion magnitudes were significantly different from the control
trials. There, it can be seen that a target appeared only bigger than it was when the context and distance were small (i.e., 20 percent of the target size and 110 percent of target plus biggest context size, respectively) and the target size small or medium (i.e., 05 or 1.0 cm). In 33 percent of the cases, there was no significant illusion effect. For all other conditions the target was perceived as smaller than it actually was.
Significant main effects for illusion magnitude were found for context size (F(2,22)=40.698, p=.000, ηp2=.787), distance (F(2,22)=24.181, p=.000, ηp2=.687) and
target size (F(1.244, 13.686)=28.973, p=.000, ηp2=.725). The illusion magnitudes of all
target sizes were significantly different (all p < .005; mean ± SD for the small (-.01 ± .01), medium (-.04 ± .01), and big (-.11 ± .02) target size), as well as for all context sizes (all p < .001; mean ± SD for the small .01 ± .01), medium .05 ± .01), and big (-.10 ± .02) context). For target – context distance, small distances differed significantly from the medium (p < .000) and big distances (p < .005), however, medium and big distances did not differ significantly from each other (p > .05; mean ± SD for distance small (-.03 ± .01), medium (-.07 ± .01) and big (-.06 ± .01)).
The analysis further revealed a significant interaction between target size and target-context distance (F(4,44)=3.933, p=.008, ηp2=.263; see Figure 2.2B), as well as
between target size and context size (F(2.244,24.687)=12.822, p=.000, ηp2=.538; see
Figure 2.2C), indicating that context size and distance influenced the illusion effect differently for the different target sizes. If significantly different from the baseline, the big and medium target-context distances always had a diminutive effect on the perceived target size (Figure 2.2A). The illusion magnitude under the small distance was always smaller than that of the medium and big distance, except when the illusion had a magnifying effect on the perceived target size. Except for the small distance, the big context size always had a stronger diminutive effect on the perceived target size than the medium context size, and the medium context size always had stronger diminutive effect than the small context size (see Figure 2.2C). The interaction of the three factors distance, context and target size approached significance (F(3.857, 42.431)=2.427, p=.065, ηp2=.181). The target-context distance by
2.4.2 Area of uncertainty
The area of uncertainty was only significantly influenced by target size (F(1.260,13.855)=22.731, p=.000, ηp2=.674). Post-hoc tests indicated that it increased in
Figure 2.2 Illusion effects as a function of target size, context size, and target-context
distance. (A) Significance levels resulting from paired sample t-tests and the direction of the illusion magnitude (IM) for each target size as a function of the context-target distance and context size. The black and white squares indicate a significant effect for bigger perceived targets and smaller perceived targets, respectively. The gray squares show conditions that were not significantly different from the control trials (a = .05).
(B) Mean IM (and standard deviation) as a function of target size and distance. (C)
the control conditions as well as in the illusion trials as target size increased (for illusion trials: big versus medium or small target size (p < 0.005), medium versus small target size (p < 0.05)).
2.4.3 Response time
The response times for the three target sizes for the baseline (RTbase) and area of
uncertainty (RTAU) control conditions were not significantly different (p > .05; mean ±
SD RTAU for target small (.89 ± .38), medium (.89 ± .47) and big (.96 ± .57)).
Presentation of the Ebbinghaus figures, however, provoked longer response times compared to the control conditions (F(1,11)=35.795, p=0.000, ηp2=.765). In addition,
for the illusion trials, RTAU was significantly higher than RTbase (F(1,11)=7.8, p=0.017,
ηp2=.415; Figure 2.3A). Further, a significant main effect of target-context distance
(F(2,22)=6.1, p=0.008, ηp2=.356; Figure 2.3B) and of target size (F(2,22)=4.9, p=0.17,
ηp2=.310; Figure 2.3C) on the response time was found. Post-hoc tests revealed that
response times were significantly longer at small distances compared to big distances (p < 0.01) and in the big target size conditions than in the small target size conditions (p < 0.05). Furthermore, an interaction effect between target size and distance was found (F(4,44)=2.9, p=0.034, ηp2=.207) which was mainly caused by the medium
distance. For the small and big distance, the response times increased with increasing target size, whereas for the medium distance the response time was shortest at the medium target size.
Figure 2.3 Response times. (A) Average
response time (and standard deviation) as a function of time; base refers to the baseline responses and AU refers to responses in the area of uncertainty. Panel B and C represent the average response time (and standard deviation) over a small (s), medium (m) and big (b) distance
(B) and target size (C). Asterisks indicate
2.4.4 Correlations between illusion magnitude, area of uncertainty, and response time
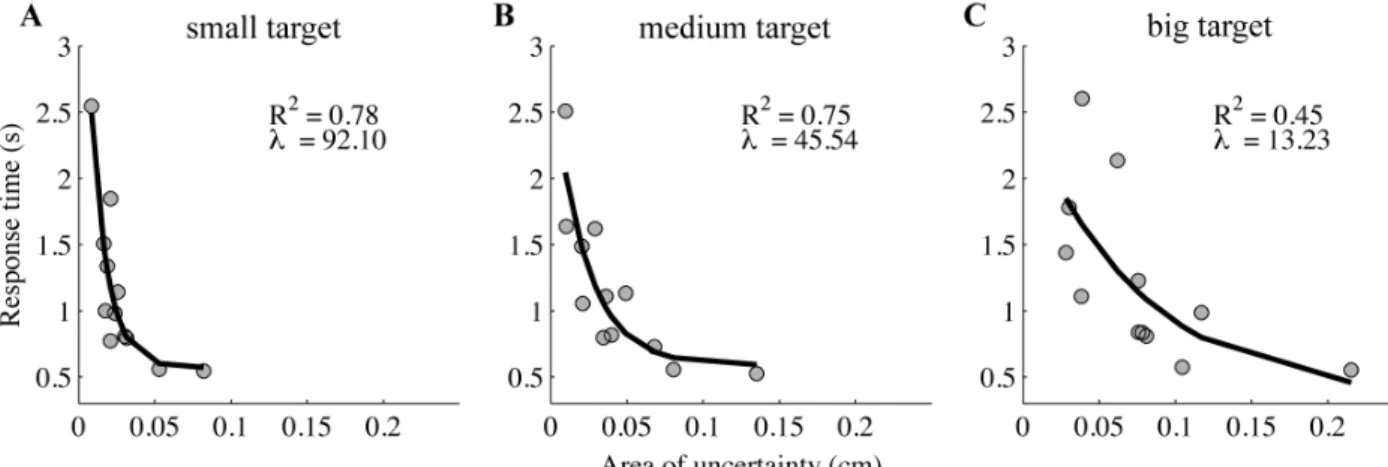
A significant but weak correlation was found between the absolute illusion magnitude and the area of uncertainty (r(322)=.12, p<.05). Further, as the absolute illusion magnitude increased, the response time (moderately) increased (r(322)=.25, p<.001). In contrast, if the area of uncertainty increased, the response time decreased (r(322)=-.41, p<.001). Further examination of the relation between the area of uncertainty and response time across participants revealed that it was exponential, and that the exponent decreased with target size (Figure 2.4).
Figure 2.4 Response time in the area of uncertainty as a function of the area of
uncertainty. The response time decays exponentially as a function of the area of uncertainty, and the decay increases with the increasing target size (the small (A), medium (B), and big target (C) are represented in the left, middle, and right panel, respectively).
2.5 Discussion
2.5.1 Summarize findings
We investigated the role of context size, target-context distance, and (actual) target size on perceived target size using a staircase procedure. In accordance with our hypotheses, we found no significant illusion effect in 33 percent of the 27 applied parameter combinations. Whenever there was an illusion effect, all three factors affected the perceptual threshold. A target circle appeared bigger in only two out of 27 conditions (i.e., 7 percent), namely, when presenting a small or medium target with small context circles at a small distance. In all other cases (i.e., 60 percent) the target appeared smaller. The area of uncertainty grew with a growing target size and with a decreasing target-context distance. Furthermore, the response time increased whenever context circles surrounded the target, and with increasing target size. The response time correlated positively with the illusion magnitude, but opposing our prediction, correlated negatively (but weakly) with the area of uncertainty.
Illusion magnitude
Massaro and Anderson (1971) formulated an equation according to which the illusion effect scales positively with target size. In accordance therewith, the authors reported two experiments that both showed increased illusion effects as a function of increasing target size (more specifically, 1.3, 1.5 and 1.7 cm). Our findings are in agreement with theirs, and we showed that this effect holds for a wider range of target sizes (namely, 0.5, 1.0, and 2.0 cm).
Nemati (2009) argued that illusionary effects of the Ebbinghaus figure are the result of a combination of a size contrast effect and the area of empty space (i.e., the area of the stimulus that is not filled by the context). The size contrast effect holds that smaller or bigger context circles, relative to the target, cause an overestimation or underestimation, respectively, of the perceived target size due to contrast mechanisms (Massaro and Anderson, 1971). If so, our findings should reflect only size contrast effects since we controlled for the empty space area by covering 75 percent of the circumference in all stimulus configurations. In accordance with Roberts et al. (2005), we reported, however, that small context circles did not always make the target appear bigger (i.e., only in 22 percent of the cases a target with a
small context was perceived as being bigger). That is, the Ebbinghaus figure cannot be reduced to ’just’ a size-contrast effect in which a target is always perceived as being bigger when the context is smaller than the target size. In other words, we oppose earlier work describing magnifying and reducing effects of the smaller and bigger surround on a target, respectively (Obonai, 1954; Massaro and Anderson, 1971).
As compared to Roberts et al. (2005), fewer parameter combinations resulted in positive illusion magnitudes (i.e., overestimation of target size) and, furthermore, the absolute maximum illusion magnitude was bigger. Differences in the direction and size of the illusion effect could possibly be explained by the different target sizes (Roberts et al., 2005 employed target sizes of 1.05 and 1.4 cm whereas we used 0.5, 1.0 and 2.0 cm), since target size played a big role in the size of the illusion magnitude, and interacted with target-context distance and context size.
Target-context distance has been suggested to be more important than the size-contrast effect for the illusion magnitude (Im and Chong, 2009). This suggestion, however, is not supported by our results: although a significant effect of target-context distance on illusion magnitude was found, this effect was weaker than the effect of context size and target size.
Whereas a target-context distance larger than 1.9 cm (3.5 degrees) was found to decrease the perceived target size (Roberts et al., 2005), a small target-context distance (0.3-1.2 cm in Girgus et al., 1972) has been shown to increase the perceived target size (Girgus et al., 1972; Oyama, 1960). That is, perceived target size seems to reveal an inverted u-shape as a function of context distance. In line therewith we found increased perceived target sizes for small distances (0.8 and 1.6 cm for the small and medium sized target, respectively) when combined with a small context whereas a distance of 1.4 cm in combination with a small context size did not result in an increased perceived target size. For all other target-context distances (i.e., 2.0 to 4.2 cm), if there was an effect, the perceived target size was smaller than the actual target size. However, this was also the case for the smallest target-context distance for the biggest target (2.4 cm). In fact, the largest target was never perceived as being bigger, which could be due to the target-context distances that for this target size always exceeded the 0.3-1.6 cm range, or other protocol variations (a, b in figure 2.1).