T E C H N I C A L N O T E
Open Access
Use of embedded strain gages for the in-vitro
study of proximal tibial cancellous bone
deformation during knee flexion-extension
movement: development, reproducibility and
preliminary results of feasibility after frontal low
femoral osteotomy
Stéphane Sobczak
1*, Patrick Salvia
1, Pierre-Michel Dugailly
2, Philippe Lefèvre
2, Véronique Feipel
2,
Serge Van Sint Jan
1, Marcel Rooze
1,2,3Abstract
Background: This paper reports the development of an in-vitro technique allowing quantification of relative (not absolute) deformations measured at the level of the cancellous bone of the tibial proximal epiphysis (CBTPE) during
knee flexion-extension. This method has been developed to allow a future study of the effects of low femoral osteotomies consequence on the CBTPE.
Methods: Six strain gages were encapsulated in an epoxy resin solution to form, after resin polymerisation, six measurement elements (ME). The latter were inserted into the CBTPEof six unembalmed specimens, just below the
tibial plateau. Knee motion data were collected by three-dimensional (3D) electrogoniometry during several cycles of knee flexion-extension. Intra- and inter-observer reproducibility was estimated on one specimen for all MEs. Intra-specimen repeatability was calculated to determine specimen’s variability and the error of measurement. A varum and valgum chirurgical procedure was realised on another specimen to observed CBTPEdeformation after
these kind of procedure.
Results: Average intra-observer variation of the deformation ranged from 8% to 9% (mean coefficient of variation, MCV) respectively for extension and flexion movement. The coefficient of multiple correlations (CMC) ranged from 0.93 to 0.96 for flexion and extension. No phase shift of maximum strain peaks was observed. Inter-observer MCV averaged 23% and 28% for flexion and extension. The CMC were 0.82 and 0.87 respectively for extension and flexion. For the intra-specimen repeatability, the average of mean RMS difference and the mean ICC were calculated only for flexion movement. The mean RMS variability ranged from 7 to 10% and the mean ICC was 0.98 (0.95 - 0.99).
A Pearson’s correlation coefficient was calculated showing that RMS was independent of signal intensity. For the chirurgical procedure, valgum and varum deviation seems be in agree with the frontal misalignment theory. Conclusions: Results show that the methodology is reproducible within a range of 10%. This method has been developed to allow analysis the indirect reflect of deformation variations in CBTPEbefore and after distal femoral
osteotomies. The first results of the valgum and varum deformation show that our methodology allows this kind of measurement and are encourageant for latter studies. It will therefore allow quantification and enhance the understanding of the effects of this kind of surgery on the CBTPEloading.
* Correspondence: [email protected]
1
Laboratory of Anatomy, Biomechanics and Organogenesis (LABO) (CP 619), Faculty of Medicine, Université Libre de Bruxelles (ULB), Bruxelles, Belgium Full list of author information is available at the end of the article
© 2011 Sobczak et al; licensee BioMed Central Ltd. This is an Open Access article distributed under the terms of the Creative Commons Attribution License (http://creativecommons.org/licenses/by/2.0), which permits unrestricted use, distribution, and reproduction in any medium, provided the original work is properly cited.
Background
Valgus deformity of the knee is a well-known factor in the aetiology of lateralized gonarthrosis. Following Pau-wel’s theory [1], Maquet proposed to use frontal lower limb realignment techniques [2-4]. However, in 25 to 30% of the cases, pain persists after treatment [5]. For other authors [6], 3D correction of knee joint deforma-tion could improve the outcome of the realignment treatment. Only one experimental study on the effects of high tibial osteotomies on knee joint kinematics and muscular moment arms of thigh muscles has been pub-lished [7]. Several studies [8-11] reported joint con-straint distribution and contact area distribution for various joints, various static positions and loading conditions. The methods utilised do not allow tracking of in-vivo femoro-tibial articular deformations during continuous knee flexion-extension motion despite the usefulness of these studies. In-vitro and in-vivo analysis of dynamic joint deformation patterns is also still a chal-lenge. The mechanical stress in bones cannot be mea-sured in a living subject without the use of invasive surgical procedures, due to obvious ethical concerns. Indirect alternatives can be found in finite element mod-elling generated from medical imaging [12]. Previous studies [13-15] reported results on deformations of the cancellous bone of the tibial proximal epiphysis (CBTPE)
in static conditions evaluating the mechanical character-istics of different extracted bone portion in compression, traction and/or torsion. This paper proposes an in-vitro method to study the CBTPE deformations using
embedded strain gages during continuous knee motions. Embedded strain gages were used previously by some authors to measure hip prosthesis cement deformation [16] or investigate the stress in the cement layer under-lying tibial plateau [17]. The utilisation of embedded strain gages is complex and difficult.
This study did not aim at analyzing the force transmis-sion in the femoro-tibial joint compartment and did not allow absolute CBTPE. The aim was the quantification the
indirect reflect in the CBTPEof tibial plateau loading
reported by the presented measurement method before and after various kinds of osteotomies. With such data, it will be possible to analyze the relative variations of the local deformation and to increase our understanding of the relationship between constraint patterns and overall joint motion. Indeed, the real 3D impact of osteotomies on tibial plateau loading is poorly reported in the litera-ture [7]. The direct method presented here should pro-vide innovative data on that particular topic.
Methods
Specimens and setting
Six fresh-frozen lower limbs (average age: 84 ± 9 years; 4 males, 2 females) were obtained from the ULB Body
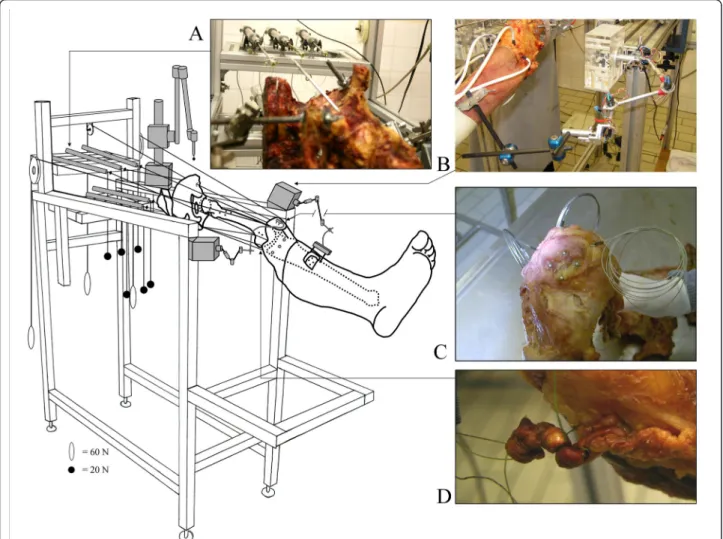
Donation program. Thawing occurred at room tempera-ture 24 hours before specimen preparation and experi-ment. Each specimen included a full lower limb with its hemi-pelvis. The pelvis and femur were rigidly mounted on the experimental jig in an anatomical position (Figure 1). The distal tendon of 8 muscles of interest was carefully dissected and cut at their distal musculos-keletal junction. Distal muscle attachments were left intact. Muscles dissected were the rectus femoris (RF), vastus lateralis (VL), vastus intermedius (VI), vastus medialis (VM), biceps femoris (BF), semitendinosus (ST), semimembranosus (SM), gracilis (Grac) and tensor fasciae latae (TFL). All other muscles were kept intact. Special care was given to respect the integrity of hip and knee joint capsule and ligaments. One fishing wire (Sur-flon®, Nylon coated, American Fishing Wire, 90 Lb., USA) was attached to each dissected tendon (Figure 1D) by an orthopaedic surgeon according to Bull’s method [18,19]. Each fishing wire ran proximally through tun-nels drilled into the bone at the level of the related mus-cle origin to allow joint loading following the physiological muscle lines of action. Total loading was 300 N (RF + VM = 80 N; VL and VI = 60 N each; BF, ST, SM, Grac, and TFL = 20 N each). Muscle loading was selected to respect the forces that each muscle could generate; this was determined from muscle volume and muscle pennation angle [20]. The fishing wire of selected muscles (RF, BF, ST, SM, Grac and TFL) were attached to the mobile axis of six Linear Variable Displacement Transductors (LVDT, Solartron Metrology®, West Sussex, UK) to measure tendon excursion during flexion-extension movement (Figure 1A). Two electrogoniometers [21-23] were used to col-lect continuous femoro-patellar and femoro-tibial 3D kinematics (Figure 1B). The results of tendon excursion and full joint kinematics are not presented here.
Measurement Element (ME)
Six MEs were used in this study. Each ME included two components: a strain gage (SG) and an epoxy resin cylin-der. The strain gage was made from cupronickel alloy (60/ 40) (Rosette unidirectional®, FLA-1-17, length: 3 mm, 120 Ω, TML, Tokyo, Japan) and was embedded in an epoxy resin solution (LX 112®, Ladd Research Industries, Willis-ton, USA) (Figure 2A). The resin was selected for its low shrinkage properties during polymerisation to avoid damage of the SG. Small polypropylene tubes (Ø: 4.7 mm) were used as moulds to encapsulate the SG in the resin. After polymerisation (1 day at 30°C and 1 day at 60°C), the MEs were cooled down at room temperature.
Determination of epoxy resin Young’s modulus
Young’s modulus of the epoxy resin was determined to define the influence of the epoxy resin on further
Figure 2 Representation and location of measurement element. Schematic view and location of MEs. A1 and A2: Schematic view of the ME. A3: ME used in this study including a Strain Gage. B and C: 3D representation (obtained from medical imaging) of ME locations in the proximal epiphysis of the tibia. ME1 and ME6: most anterior edge of the medial and lateral condyles, respectively; ME2: most medial point of the medial condyle, ME3 and ME4 = most posterior edge of the medial and lateral condyles, respectively. M5: most lateral point of the lateral condyle (tunnels were drilled 10 mm below these landmarks, see text for further details).
Figure 1 Schematic view of the experimental setting. Schematic view of the experimental setting showing a specimen mounted rigidly on the experimental jig in anatomical position. A: representation of the LVDT placed in the prolongation of the action line of different muscles. B: tibial 3D electrogoniometer. C: illustration of the loading muscles, RF, VL and VM by cerclage with metallic wires. D: representation of the fixation of the other muscles according to the bull’s method.
measurement. Ten resin cylinders (L: 12 mm, H: 30 mm) were processed. Cylinders were placed in a servo-hydraulic test system (MTS 858 Mini Bionix, 10-kN loading head, Eden Prairie, Minnesota, USA). Compres-sion force was applied along the longitudinal axis of the cylinders and was released at the yield point (i.e., corre-sponding to the limit of the cylinder elastic range). Young’s modulus was then calculated in the elastic part of the cylinder deformation [24]. The epoxy resin Young’s modulus (E) was obtained by equation 1. The average value was 2.09 ± 0. 03 GPa.
E F S
L L = ( / )
( / 0) (1)
Where:
E = Young’s modulus (Pa) F = Force applied (N).
S = cross-sectional area of cylinder (m2). ΔL = Length variation (m).
L0 = Initial length (m).
Data acquisition
A custom-made device including six amplifying modules was developed to collect the output from the 6 SGs (Figure 2B). Each module included a Wheatstone bridge which allowed the measurement of tension imbalance in the bridge. These modules were supplied in differential current (DC) with a floating power supply of 9V. Each Wheatstone bridge was adjusted using an offset correc-tion and the parasite noise related to external interfer-ences were eliminated (common mode rejection). The ratio between the signal power and the parasite noise power (i.e., S/N ratio) was equal to 66 db. All modules were connected to an acquisition board (DAP3200a, Microstar Laboratories). The acquisition frequency was 208 Hz.
Definition of the strain gage deformation
The deformation (ε) was obtained by equation 2 [25]. This equation shows the relation between the resistance variation (ΔR/R0) and the gage factor (GF). The gage
factor defines the SG deformation in a well-defined direction. GFwas given by the gage manufacturer and
was equal to 2.15 ± 1%. This value was constant and independent from the load applied.
= ΔR Ro GF / (2) Where: ε = Deformation ΔR = Resistance variation. Ro = Nominal resistance of SG (120Ω). GF= Gage factor Calibration
A custom-made device was built to measure the SG length variation (ΔL) and to perform SG calibration. A SG was embedded into a LX 112 epoxy resin plate (L = 30 mm, l = 12 mm, d = 3 mm) linked to a mechanism (Figure 2E). The latter mechanism allowed stretching of both resin plate and SG in a controlled way. The elon-gation range was from 1 μm to 50 μm. Deformation results were expressed in resistance variation to obtain a calibration equation (Eq. 3) after Analog-to-Digital Con-version (ADC). The final deformation ε was given by equation 4. Note that this calibration was dependent on the above-determined epoxy resin Young’s modulus (see Eq. 1). f r xΔ ( ) (= 3e−6x−0 0002. ) (3) e= − − (3e 6 0 0002. ) / F x Ro G (4) Where: ε = Deformation x = ADC variations Ro = Nominal resistance of SG (120Ω). GF= Gage factor Location of MEs
ME location was standardized using computed tomogra-phy (CT, Siemens SOMATRON, helical mode, slice thickness = 0.5 mm, inter-slice spacing = 0.5 mm, image format = DICOM 2.0) on each specimen before con-straint experiments took place. CT data segmentation and 3D-model reconstruction of bones were performed using a dedicated software interface (Amira®, Visage Imaging, Inc., San Diego, USA). Six tunnels (Ø: 4.2 mm) were drilled into the cancellous bone underlying the tibial plateau at 10 mm below the joint line. Tunnel depths were 13 mm and strain gauges were placed 10 mm from the cortical bone (Figure 2 A1). ME loca-tions were standardized using strict definiloca-tions describ-ing anatomical landmark locations on the available 3D models (Figure 2C). Tunnel orientation was parallel to the cartilaginous surface of the tibia. Tunnel diameter size was slightly smaller than the ME diameter to ensure a tight fit with and a maximal contact between the MEs and the cancellous bone. One ME was introduced into each tunnel (Figure 2D), and no glue was used.
Experimental protocol
For each specimen, three repetitions of two cycles of flex-ion-extension movement were performed. Measurement
started with the specimen knee in full extension main-tained by the muscle loading. Flexion was then per-formed manually by pushing with an open hand on the distal part of anterior face of the leg. Once knee flexion was obtained, the manual pressure was released and the knee passively moved back by the muscle loading of the quadricipital tendon. All above-mentioned muscle load-ing was kept in place durload-ing the entire measurement ses-sion. Intra- and inter-observer reproducibility was analysed on one specimen (specimen 1). To allow repro-ducibility analysis, three operators independently per-formed the above data collection (three trials of three repetitions including two motion cycles) on the same specimen within a three-hour interval. Valgum and Varum procedure were realised on another specimen. These angular corrections (6° and 12°) were applied using a specially-built control system. Before processing each repetition for further analysis, the extension of the first cycle and the flexion of the second cycle were selected to avoid experimental noise (i.e., system oscillations) usually observable at the beginning and end of movement. Data were then normalized to flexion-extension range of motion.
Statistical analysis
Inter- and intra-observer reproducibility was analyzed by coefficients of multiple correlation (CMC) and mean coefficient of variation (MCV). Intra-observer reproduci-bility was obtained by comparing the mean of the 3 repetitions of the three trials for one operator. Inter-observer reproducibility was performed by comparison of the mean of the 3 repetitions performed by each operator at 3 different times. For intra-specimen repeat-ability we calculated the mean RMS difference between the three repetitions for each ME. An ICC (3.1 Two-Way Mixed) was also calculated. These were then aver-aged across MEs and subjects. Pearson’s correlation coefficients were calculated to analyse if the RMS was dependent of data amplitude during movement. For val-gum and varum deviations comparison, a faithful analy-sis of the different patterns of curve was carried out.
Results
Intra-observer reproducibility
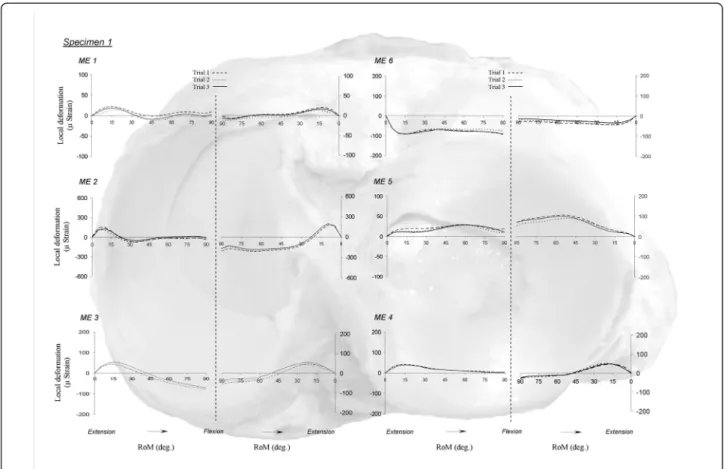
Good superposition of different repetitions was obtained for all MEs (Figure 3). The CMC showed a mean value of 0.93 for flexion (range: 0.83-0.99) and of 0.96 for extension
Figure 3 Intra-operator reproducibility. Intra-operator variability during flexion and extension motion. ME 1: antero-medial strain gage; ME 2: medial strain gage; ME 3: postero-medial strain gage; ME 4: postero-lateral strain gage; ME 5: lateral strain gage; ME 6: antero-lateral strain gage.
(range: 0.96-0.99). Mean MCV values were obtained dur-ing knee extension (8%, range: 4-13%) and flexion (9%, range: 6- 12%) (Table 1). Deformation patterns were simi-lar between repetitions performed by the same operator.
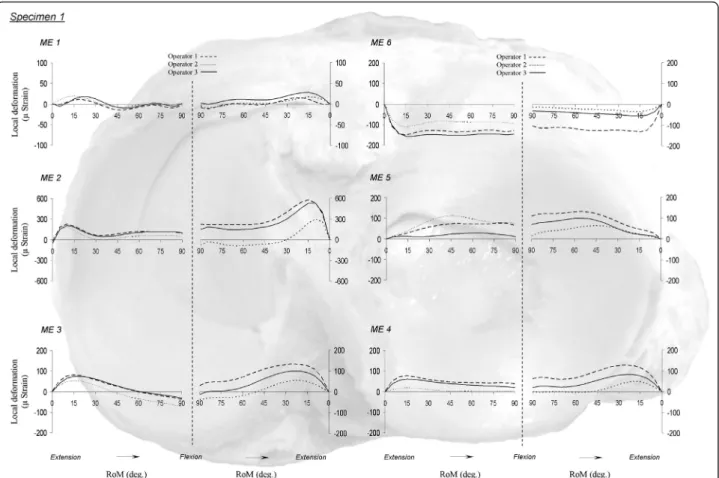
Inter-observer reproducibility
MCV for all MEs averaged 23% (range: 12-43%) and 28% (range: 15-55%) during flexion and extension, respec-tively. Mean CMC were 0.87 (range: 0.70-0.98) and 0.82 (range: 0.63-0.99) (Table 1). The deformation magnitudes (Figure 4) differed between operators, but the shape of the curves showed similar deformation patterns.
Intra-specimen repeatability
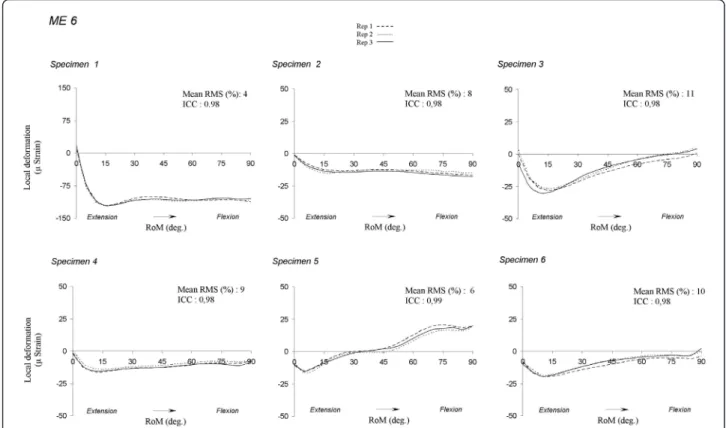
As intra-observer reproducibility data was not statisti-cally different, this analysis was carried out for the flex-ion movement. Figure 5 presents graphically the phenomenon on ME6. For all MEs and specimens, the mean RMS differences (%) ranged from 3 to 15% and the mean ICC ranged from 0.95 to 0.99 (Table 2). The average mean RMS difference of the sample ranged from 7 and 10%. The mean correlation coefficient was ranged from -0.22 and 0.55. These values imply that the RMS differences were independent of signal intensity.
Frontal distal femoral osteotomy
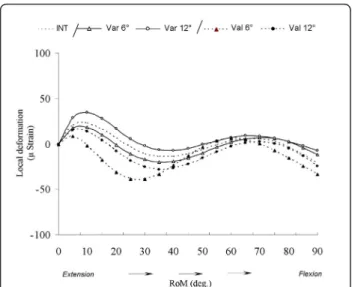
Figure 6 shows after varum and valgum deviation the cancellous bone deformation variability of the medial measurement element (ME2). We could divide the flex-ion motflex-ion in three phases: the first from 0° until 30°, the second from 30° until 65° and the third from 65° until 90°. During the first phase, the valgum deviations induce a decrease of CBTPEcompared to the intact
con-dition. These decreases were not proportional of the degrees of deviation. For varum deviations, only the condition of 12° increases the CBTPE. During the second
phase, the curve patterns of valgum 6° condition increase until similar values of varum 12° condition. During the third phase, the varum deformations increase
the CBTPE compared to the intact condition and
inver-sely for valgum deformations.
Discussion
These results show that the developed method allows reproducible in-vitro measurements of the indirect reflect of deformation variations occurring in the CBTPE
during knee flexion-extension. We are conscious that the strain gages are designed for being bonded onto the surface of structure but previous study [16,17] used strain gages into structure. The cancellous bone is not homogenous and anisotropic and the orientation and location of the trabecula are very important to loading transfer. The strain field in structure point is three dimensional. There are three normal strains and three shear strains. In our study we decided consider the mea-surement of vertical strain. Note that data was depen-dent of the epoxy resin deformation. The data obtained were the indirect reflect of the cancellous bone load transfer. Nevertheless, the introduction of different structure in the cancellous bone could create a local reinforcement and modify the cancellous bone mechanics. During dynamics of gait, ground reaction force is of primary importance to explain joint loading. In our experimental setting, an open kinematic chain was studied. It would be therefore interesting to repro-duce this study in a closed kinematic chain setting to take into account the contribution of ground reaction force, that might affect cancellous bone deformation dif-ferently as compared to loading along muscle lines of actions.
Intra-observer reproducibility was satisfactory for both MCV (not exceeding 10%) and CMC (above 0.93). Inter-observer reproducibility indicated that similar measured deformation patterns could be found for all operators at all ME locations (CMC mean: 0.82 to 0.87), although these patterns showed different ranges. It could have been advanced that this range difference could be related to the different velocities applied by the
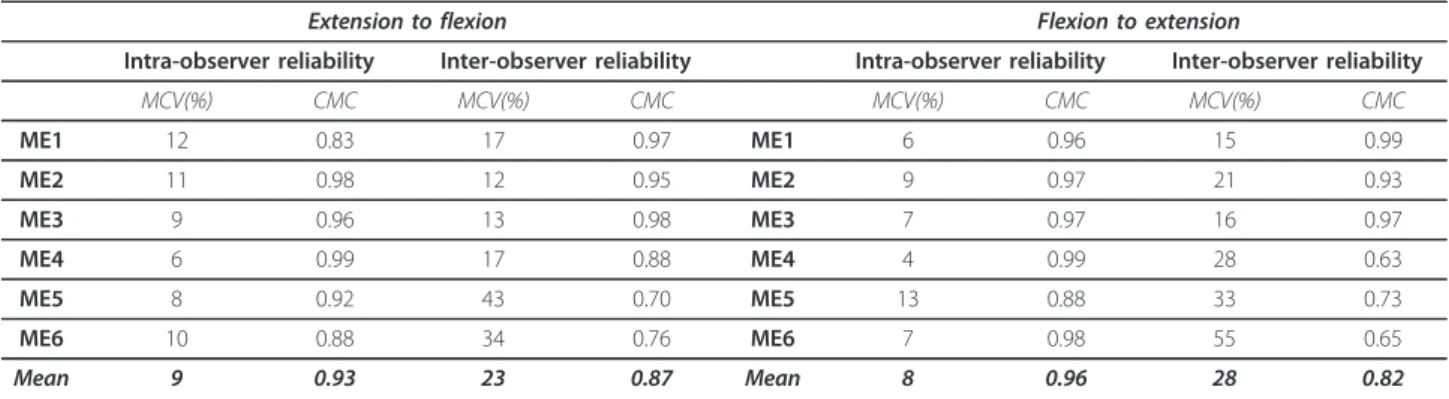
Table 1 Intra- and inter-observer reliability
Extension to flexion Flexion to extension
Intra-observer reliability Inter-observer reliability Intra-observer reliability Inter-observer reliability
MCV(%) CMC MCV(%) CMC MCV(%) CMC MCV(%) CMC ME1 12 0.83 17 0.97 ME1 6 0.96 15 0.99 ME2 11 0.98 12 0.95 ME2 9 0.97 21 0.93 ME3 9 0.96 13 0.98 ME3 7 0.97 16 0.97 ME4 6 0.99 17 0.88 ME4 4 0.99 28 0.63 ME5 8 0.92 43 0.70 ME5 13 0.88 33 0.73 ME6 10 0.88 34 0.76 ME6 7 0.98 55 0.65 Mean 9 0.93 23 0.87 Mean 8 0.96 28 0.82
Inter- and intra-observer mean coefficient of variation (in %) and coefficient of multiple correlation. ME1: antero-medial Strain gage; ME2: medial Strain gage; ME3: postero-medial Strain gage; ME4: postero-lateral Strain gage; ME5: lateral Strain gage; ME6: antero-lateral Strain gage.
operator to flex the knee joint. We studied the correla-tion between the mean RMS values and mean and maxi-mal primary motion velocities. The coefficients of determination (r2) between RMS and motion velocity and were 0.32 and 0.39, respectively for mean and maxi-mal velocities. These results do thus not support that velocity was a factor influencing local bone deformation. For intra-specimen repeatability we chose to analyse the flexion movement. Indeed, no difference between flexion and extension intra-observer reproducibility was observed. Moreover, it seems more logical to express our data according to flexion movement. Indeed, knee joint kinematics and muscular moment arms that are pertinent to interpret deformation data are generally expressed during this movement. The average mean RMS differences (7 to 10%) and the Mean ICC (0.95 to 0.99) showed that maximum variability did not exceed 10% and that a great similarity of the curves was observed. The mean correlation coefficient was ranged from -0.22 and 0.55, indicating that RMS differences were independent of the signal intensity. This implies that the measurement error is constant and does not exceed 10%
The curve pattern of ME6 in all specimens (Figure 5) suggests individual variability of knee deformations. The intensity variability may be due to some discrepancies in gage placement even if this was standardized, to the quality of cancellous bone, especially in elderly people [13,26]. Indeed, this is approximately 654 (± 304) MPa in young subjects, 829 (± 422) MPa in adults and 613 (± 319) MPa in elderly people [13]. The variability could also be due to individual anatomical and/or kinematical variations (e.g. joint geometry, presence or absence of inconstant ligaments, motion patterns).
Compression tests of the resin cylinders indicated that the average value of the resin Young’s modulus was 2.09 (± 0.03) GPa. In comparison to the CBTPEYoung’s
mod-ulus [14], the resin Young’s modmod-ulus is 2.4 to 66 times larger than the CBTPE. This means that the epoxy resin
deformation is smaller than the cancellous bone’s and that the data obtained via the MEs underestimated the real deformation of the cancellous bone. However, this system is satisfactory to answer the main aim of this study, which was developing a method to compare bone deformation variations between two conditions (i.e., before and after osteotomies). For example, Figure 6
Figure 4 Inter-operator reproducibility. Inter-operator variability during flexion and extension motion. ME 1: antero-medial strain gage; ME 2: medial strain gage; ME 3: postero-medial strain gage; ME 4: postero-lateral strain gage; ME 5: lateral strain gage; ME 6: antero-lateral strain gage.
Figure 5 Deformation repeatability for ME 6. Repeatability measurement for all specimens to the ME 6. ME 1: antero-medial strain gage; ME 2: medial strain gage; ME 3: postero-medial strain gage; ME 4: postero-lateral strain gage; ME 5: lateral strain gage; ME 6: antero-lateral strain gage.
Table 2 Intra-specimen repeatability
Mean
Range RangeMean RangeMean
Specimen Max (mS) Min (mS) Mean RMS (mS) Mean RMS (%) ICC r Max (mS) Min (mS) Mean RMS (mS) Mean RMS (%) ICC r Max (mS) Min (mS) Mean RMS (mS) Mean RMS (%) ICC r
ME1 ME2 ME3
S1 13 -10 2 7 0.98 * 0.10 288 27 28 9 0.98 * -0.35 71 -44 3 3 0.99 * 0.13 S2 7 -11 2 12 0.95 * -0.35 96 -6 10 10 0.99 * -0,20 162 -19 18 10 0.97 * 0.27 S3 -14 -49 3 5 0.98 * 0.36 72 -147 25 11 0.99 * 0.59 35 6 3 6 0.99 * -0.20 S4 14 -18 2 5 0.97 * 0.23 33 -62 6 6 0.98 * 0.65 77 -4 8 10 0.99 * 0.41 S5 35 -68 5 5 0.99 * 0.78 -3 -26 1 5 0.99 * 0.32 15 -1 1 9 0.98 * -0.16 S6 -3 -39 4 9 0.98 * -0.46 148 20 10 6 0.95 * 0.07 40 -4 4 10 0.98 * 0.04 Average 9 -33 3 7 0.98 0.11 106 -32 13 8 0.98 0.41 67 -11 6 8 0.98 0.08
ME4 ME5 ME6
S1 74 5 3 4 0.99 * -0.54 36 -3 5 13 0.99 * -0.60 10 -121 4 3 0.98 * 0.70 S2 23 -81 9 8 0.99 * -0.06 -2 -45 5 11 0.97 * 0.53 -1 -16 1 8 0.98 * 0.49 S3 11 -46 7 12 0.99 * 0.42 -4 -33 4 11 0.95 * 0.74 4 -28 3 11 0.98 * 0.45 S4 29 -42 11 15 0.98 * -0.68 -3 -10 1 5 0.97 * 0.38 -1 -15 1 9 0.98 * 0.55 S5 -4 -57 5 7 0.98 * -0.76 23 -24 5 10 0.99 * 0.43 19 -15 2 6 0.99 * 0.60 S6 0 -49 4 9 0.96 * 0.30 52 -14 6 10 0.98 * 0.30 -1 -19 2 10 0.98 * 0.49 Average 22 -45 6 9 0.98 -0.22 17 -21 4 10 0.98 0.48 5 -36 2 8 0.98 0.55
Intra-specimen repeatability for all MEs in flexion. ME1: antero-medial Strain gage; ME2: medial Strain gage; ME3: postero-medial Strain gage; ME4: postero-lateral Strain gage; ME5: lateral Strain gage; ME6: antero-lateral Strain gage. *:P < 0.0001.
showed the CBTPE deformation for ME2 after varum
and valgum deviation for another specimen. The data showed that the deformation patterns seems to be in agree with the frontal deviation theory [1,2] were varum deformity induce a medial shift of the mechanical axis of the lower limb, increasing medial tibial plateau con-straint and inversely for valgum deformity. We showed that before 65°, the varum 6° condition decrease CBTPE.
After 65° the varum 6° condition increase CBTPE
com-pared to the intact condition. The valgum conditions were not proportional to the degree of frontal deforma-tion. This fact could be due to the modification of mus-cles and ligaments tensions. But this hypothesis should be still confirmed thanks to confrontation with kine-matics and moment arm data. Even if the introduction of a rigid element into the cancellous bone can induce a modification of its mechanic behavior, these preliminary results showed that our methodology allows objective measurement of this problematic.
The tunnel size has been selected after several trials to optimize the contact surface between cancellous bone and ME. The MEs were only introduce on CBTPE and
no glue was used. No sliding and movement of the ME in the tunnel were observed. There is currently no other direct method which allows validation of ME output data. To the authors’ knowledge, no other ‘direct’ method is available to record cancellous bone deforma-tions during motion. Only indirect methods exist [12,13] and these deal with static positions and therefore are not suitable to validate the protocol presented in this study. The latter is the first method which allows to
analyze directly in-situ the variations of cancellous bone during a joint movement. The deformation pattern for each individual specimen in some well-defined condi-tions (e.g., osteotomy) can therefore be compared to each other. Unfortunately, the method does not allow the absolute strain values to be obtained since there is no other direct method is available from the literature for validation.
Conclusions
The presented method allows the reproducible relative quantification of deformation variations measured in-situ at the cancellous bone of the tibial proximal epiphy-sis. The method has been used in this paper on the tibial plateau. Intra-observer reproducibility was very good and the measurement error did not exceed 10% in average. Inter-observer reproducibility was less accepta-ble. Different behaviours were observed among speci-mens. These were probably due to individual variations in bone quality as previously reported in the literature [13]. The method can now be used for the first time to quantify relative bone deformations before and after dis-tal femoral osteotomies if applied by the same operator. The preliminary results of valgum and varum condition seem in agree with frontal misalignment theory. CBTPE
deformation measurements could be confronted to knee kinematics analysis and thigh muscular moment arms [7]. This will allow a better understanding of the mechanism of lateralized gonarthrosis, and contribute to the development of more appropriate treatments in the future.
Abbreviations
CBTPE: cancellous bone of the tibial proximal epiphysis; MCV: mean
coefficient of variation; CMC: coefficient of multiple correlations, RMS: Root Mean Square; Strain gage: SG: Measure Element: ME; RF: rectus femoris; VL: vastus lateralis; VI: vastus intermedius; VM: vastus medialis; BF: biceps femoris; ST: semitendinosus; SM: semimembranosus; Grac: gracilis; TFL: tensor fasciae latae; LVDT: Linear Variable Displacement Transductors.
Acknowledgements
The authors would like to thank B. Gilbert, B. Baillon, F. Dupuis, J.L. Sterckx, M. Authele, T. Chapman and the Professor J.P. Ryckaert for their help. Special thanks to the Service of Waves and Signals (ULB) for building the amplifier modules.
Author details
1Laboratory of Anatomy, Biomechanics and Organogenesis (LABO) (CP 619),
Faculty of Medicine, Université Libre de Bruxelles (ULB), Bruxelles, Belgium.
2Laboratory for Functional Anatomy, Institute for Motor Sciences, Université
Libre de Bruxelles (ULB), Bruxelles, Belgium.3Department of Orthopedics and Traumatology, Cliniques Universitaires de Bruxelles, Hôpital Erasme, Brussels, Belgium.
Authors’ contributions
SS: designed the study, carried out the experiments, analysed the result and drafted the manuscript. PS: designed the study, collected and analysed the data. PMD and PL: carried out the experiments. VF, SVSJ and MR: read and approved the final manuscript. All authors read and approved the final manuscript
Figure 6 Valgum and varum deviation on the cancellous bone deformation for ME 2. Representation of cancellous bone deformation for ME2 after varum and valgum procedure during knee flexion. INT: intact; Var 6°: varum 6°; Var 12°: varum 12°; Val 6°: valgum 6°; Val 12°: valgum 12°.
Competing interests
The authors declare that they have no competing interests.
Received: 9 June 2010 Accepted: 3 March 2011 Published: 3 March 2011 References
1. Pauwels F: Biomecanique de l’appareil moteur: contribution à l’étude de l’anatomie fonctionnelle.Edited by: Springer-Verlag. Berlin; , 1 1979. 2. Maquet P: The biomechanics of the knee and surgical possibilities of
healing osteoarthritic knee joints. Clin Orthop Relat Res 1980, 149:102-10. 3. Edgerton BC, Mariani EM, Morrey BF: Distal femoral varus osteotomy for
painful genu valgum: A five-to-11-year follow-up study. Clin Orthop Relat Res 1993, 288:263-9.
4. Li G, Papannagari R, Most E, Park SE, Johnson T, Tanamal L, Rubash HE: Anterior tibial post impingement in a posterior stabilized total knee arthroplasty. J Orthop Research 2005, 23:536-41.
5. Aglietti P, Menchetti PP: Distal femoral varus osteotomy in the valgus osteoarthritic knee. Am J Knee Surg 2000, 13:89-95.
6. Goutallier D, Garabedian JM, Allain J, Bernageau J: Influence of lower limb torsionnal deformities on the development of femoro-tibial
degenerative arthritis. Rev Chir Orthop 1997, 83:613-21.
7. Baillon B, Salvia P, Feipel V, Rooze M: Modifications de la cinématique du genou et des bras de levier du quadriceps et des ischio-jambiers après ostéotomie tibiale haute“ curviplane “ de valgisation ou de varisation. RCO 2006, 92:464-72.
8. Coughlin KM, Peura GD, Fleming BC, Hallock S, Beynnon BD: In vivo loads in the medial compartment of the rabbit knee. Clin Biomech (Bristol, Avon) 2005, 20:1007-9.
9. Fukubayashi T, Kurusawa H: The contact area and pressure distribution pattern of the knee. Acta Orthop Scand 1980, 51:871-9.
10. Liu ZJ, Herring SW: Bone surface strains and internal bony pressures at the jaw joint of the miniature pig during masticatory muscle contraction. Arch Oral Biol 2000, 42:95-112.
11. Wretenberg P, Ramsey DK, Németh G: Tibiofemoral contact points relative to flexion angle measured with MRI. Clin Biomech 2002, 17:477-85. 12. Taddei F, Cristofolini L, Martelli S, Gill HS, Viceconti M: Subject-specific
finite element models of long bones: An in vitro evaluation of the overall accuracy. J. Biomech 2006, 39:2457-67.
13. Ding M, Dalstra M, Danielsen CC, Kabel J, Hvid I, Linde F: Age variations in the properties of human tibial trabecular bone. J bone Joint Surg (br) 1997, 79-b:995-1002.
14. Goldstein SA, Wilson DL, Sonstegard DA, Matthews LS: The mechanical properties of human tibial trabecular bone as a function of metaphyseal location. J biomech 1983, 16:965-69.
15. Lancianese SL, Kwok E, Beck CA, Lerner AL: Predicting variations in trabecular bone mechanical properties within the human proximal tibia using MR imaging. Bone 2008, 43:1039-46.
16. Cristofolini L, Viceconti M: Development and validation of a technique for strain measurement inside polymethyl methacrylate. J Strain Analysis 2000, 35:21-33.
17. Little EG, O’Keefe D: An experimental technique for the investigation of three-dimensional stress in bone cement underlying a tibial plateau. Proc Instn Mech Engrs Part H 1989, 203:35-41.
18. Amis AA, Oguz C, Bull AMJ, Senavongse W, Dejour D: The effect of trochleoplasty on patellar stability and kinematics: A biomechanical study in vitro. J bone Joint Surg (br) 2008, 90(7):864-9.
19. Bull AMJ, Berkshire FH, Amis AA: Accuracy of an electromagnetic measurement device and application to the measurement and description of knee joint motion. Proc Instn Mech Engrs Part H 1998, 212:347-55.
20. Klein Horsman MD, Koopman H, Van der Helm F, Poliacu Prosé L, Veeger H: Morphological muscle and joint parameters for musculoskeletal modelling of the lower extremity. Clin Biomech (Bristol, Avon) 2007, 22:239-47.
21. Salvia P: Développement et application de l’électrogoniométrie tridimensionnelle à l’étude expérimentale et clinique de la cinématique articulaire. PhD thesis. Université Libre de Bruxelles, Department of Anatomy; 2004.
22. Sholukha V, Salvia P, Hilal I, Feipel V, Rooze M, Van Sint Jan S: Calibration and validation of 6 DOFs instrumented spatial linkage for biomechanics applications: A practical approach. Med Eng & phys 2004, 26:251-60.
23. Van Sint Jan S, Salvia P, Hilal I, Sholukha V, Rooze M, Clapworthy G: Registration of 6-DOFs electrogoniometry and CT medical imaging for 3D joint modelling. J Biomech 2002, 35:1475-84.
24. Beaupied H, Lespessailles E, Benhamou CL: Evaluation of macrostructural bone biomechanics. Rev Rhum 2007, 74:447-454.
25. Murray WM, Miller WR: The Bonded Electrical Resistance Strain Gage: an introduction. Oxford University Press. New York;, 1 1992.
26. Khodadadyan-Klostermann C, Von Seebach M, Taylor WR, Duda GN, Haas NP: Distribution of bone mineral density with age and gender in the proximal tibia. Clin Biomech 2004, 19:370-376.
doi:10.1186/1749-799X-6-12
Cite this article as: Sobczak et al.: Use of embedded strain gages for the in-vitro study of proximal tibial cancellous bone deformation during knee flexion-extension movement: development, reproducibility and preliminary results of feasibility after frontal low femoral osteotomy. Journal of Orthopaedic Surgery and Research 2011 6:12.
Submit your next manuscript to BioMed Central and take full advantage of:
• Convenient online submission • Thorough peer review
• No space constraints or color figure charges • Immediate publication on acceptance
• Inclusion in PubMed, CAS, Scopus and Google Scholar • Research which is freely available for redistribution
Submit your manuscript at www.biomedcentral.com/submit