HAL Id: hal-00985062
https://hal.archives-ouvertes.fr/hal-00985062
Submitted on 29 Apr 2014
HAL is a multi-disciplinary open access
archive for the deposit and dissemination of
sci-entific research documents, whether they are
pub-lished or not. The documents may come from
teaching and research institutions in France or
abroad, or from public or private research centers.
L’archive ouverte pluridisciplinaire HAL, est
destinée au dépôt et à la diffusion de documents
scientifiques de niveau recherche, publiés ou non,
émanant des établissements d’enseignement et de
recherche français ou étrangers, des laboratoires
publics ou privés.
Calorimetric study of melted DNA glass
Jessica Valle-Orero, Jean-Luc Garden, Jacques Richard, Andrew Wildes,
Michel Peyrard
To cite this version:
Jessica Valle-Orero, Jean-Luc Garden, Jacques Richard, Andrew Wildes, Michel Peyrard. Calorimetric
study of melted DNA glass. AIP Conference Proceedings, American Institute of Physics, 2013, 1518,
pp.766-771. �10.1063/1.4794676�. �hal-00985062�
Calorimetric study of melted DNA glass
Jessica Valle-Orero
∗, Jean-Luc Garden
†, Jacques Richard
†, Andrew Wildes
∗and
Michel Peyrard
∗∗∗Institut Laue Langevin,BP 156, 6, rue Jules Horowitz 38042 Grenoble Cedex 9, France
†Institut Néel, CNRS - Université Joseph Fourier, 25 rue des Martyrs, BP 166, 38042 Grenoble cedex 9, France ∗∗Laboratoire de Physique, Ecole Normale Supérieure de Lyon, 46 allée d’Italie, 69364 Lyon Cedex 07, France
Abstract.
In this work we report a detailed calorimetric study using differential scanning calorimetry (DSC) of the glassy behaviour of films made from DNA fibers. We show that after the first irreversible thermal denaturation of the molecules when the sample is reiteratively heated, it reaches a disordered state in which it presents a typical glass behaviour during successive cooling and heating scans. Furthermore, we have investigated the properties of these DNA films in two series of experiments, a slow cooling at different rates followed by a DSC scan upon heating, and ageing at a temperature below the glass transition. Introducing the fictive temperature to characterise the glass allows us to derive quantitative information on the relaxations of the DNA films, in particular to evaluate their enthalpy barrier. A comparison with similar ageing studies on PVAc highlights some specificities of the DNA samples.
Keywords: Enthalpy Relaxation; Structural Relaxation; Deoxyribonucleic Acid; Amorphous Material; Polyvinyl Acetate;Differential Scan-ning Calorimetry
PACS: 65.60.+a
INTRODUCTION
The loss of the double helical structure of DNA as a consequence of thermal denaturation has a strong effect of the whole structure of the fibres and films. While DNA is fairly rigid in its double helix form, when the two single strands dissociate after denaturation they become very flexible, and at high temperature this leads to a sample in which the strands are fully disordered and entangled, in a quasi-liquid state.
A glass transition is a transformation in which an amorphous system on cooling undergoes a transforma-tion from liquid (equilibrium) to glass (non-equilibrium) without being able to crystalise. As the temperature of an homogeneous vitreous system in a liquid state is lowered their inter and intramolecular motions become too slow to be detectable experimentally. The liquid is impeded from reaching equilibrium which can only be attained by structural relaxation or ageing at very long timescales.
For DNA films, even though the stacking of the base pairs is broken, the intermolecular confinement is still present and influences the relaxations in the glassy state. During ageing or slow cooling the system evolves to-wards states with lower and lower enthalpy. Conversely, when the system is heated up after ageing, it can absorb the corresponding enthalpy at high temperature, which shows up as a peak in the heat capacity. The rate of tem-perature variation defines the timescales at which the sys-tem is allowed to change. The dependence of the glass structure on the cooling rate can be described by the
lim-iting fictive temperature, Tf′[1].
The glass character of DNA has been studied previ-ously. Tsereteli’s group [2] presented many published re-ports on the glass character of DNA in solution. Observa-tions of the glassy behaviour in fibres were made [3] but the relaxation character of these glass-like systems was never quantitatively analysed.
In this paper, we report a detailed calorimetric study of the glassy behaviour of melted films made from DNA fibres. We compare glassy DNA melt properties with PVAc, a classical polymeric glass former. The same ex-perimental protocols (different cooling and ageing times) are used to assess the glassy properties of the two sys-tems. For ageing experiments, we use two different approaches concerning the evolution of the relaxation times, which lead to the same conclusion. One is based on the Tool–Narayanaswamy–Moynihan (TNM) [1] ex-pression of the relaxation time, while the other uses an Arrhenius expression. For both approaches, the concept of limiting fictive temperature is used. It is however not usual to calculate limiting fictive temperatures after age-ing experiments, it is why we focalise on this point in this paper.
EXPERIMENTAL SECTION
Sample Preparation
The samples consisted of Oriented Fibres of DNA prepared using the “wet spinning technique” which has been meticulously described elsewhere [4]. Once the oriented fibres are prepared they go through a process of cleaning, drying and humidification. For the purpose of our experiments the films were humidified to 56% RH for several weeks.
A Setaram Micro DSC III was used to perform the measurements. For each of the DSC experiments one or several hydrated films with a mass between 80 and 100 mg were rolled up and sealed inside an hastelloy tube. The sample was then placed in the DSC at 293 K and left for 10 minutes for stabilisation. For the reference tube, 345 mg of VESPEL was used, as it does not exhibit a glass transition within the region of our study.
Experimental Protocol
During the first raise in temperature from 268 K to 368 K at a rate of 1.2 K/min, the sample goes through a dena-turing transition as it is observed in DNA solution. It was then cooled down to 268 K at the same rate. The cool-ing scan showed a glass transition at around 298 K. The sample was kept inside the DSC throughout the differ-ent measuremdiffer-ents. Before each experimdiffer-ent, the sample was exposed to a series of cooling-heating temperature cycles and finally heated to 363 K during 20 mins, this is referred as “pre-experiment”. This was done to erase any annealing thermal history. The data presented in specific heat△C as a function of temperature were first corrected from instrumental resolution and then the VESPEL con-tribution was isolated in order to obtain only the heat ca-pacity of DNA. The resulting data and the protocol have been presented in detail in a recent publication [5].
Two series of experiments were carried out with the same sample to study the structural relaxation behaviour of the glassy system obtained by heating a film of ori-ented DNA fibers up to denaturation temperature and cooling it down to room temperature.
1. Different cooling rates. This consisted of a succes-sion of temperature ramps. Starting from the initial state at 363 K, the sample was cooled down at a rate
β from 363 to 268 K; left for 5 mins for equilibra-tion; and heated to 363 K at 1.2 K/min. It was then stabilised for 20 min at this highest temperature be-fore the next cooling ramp, which was recorded as a DSC scan. The cooling rate was modified at each ramp in the following order,β= 1.2, 0.4, 0.2, 0.1, 0.05, 0.033, 0.01 and back to 1.2 K/min. The
heat-ing rate was kept fixed.
2. Annealing at different ageing times. The proce-dure consisted in cooling at 1.2 K/min from 363 K to the ageing temperature Tabelow the glass
transi-tion temperature, annealing the sample for a period of time ta, and then cooling down to 268 K before
recording the DSC signal on heating from 268 K to 363 K. All temperature ramps were programmed at a rate of 1.2 K/min. The relaxation of the system was studied at fifteen different ageing times, ta= 84,
78, 72, 66, 60, 54, 48, 42, 32, 20, 10, 6, 3, 1 and 0 hours. The last corresponds to an experiment with-out annealing. However by simply taking into ac-count the minimal response time of the calorimeter one can consider that the effective minimal ageing time is actually equal to 10 min.
RESULTS
Cooling at different temperature rates
An enthalpic response was obtained for each of the DSC heating ramps at 1.2 K/min after cooling at the dif-ferent ratesβ. The data expressed as normalised heat ca-pacity as a function of temperature was published else-where [5]. For each of the normalised curves the limiting fictive temperature Tf′ was calculated using Equation 1 given by Moynihan [1]. The same experimental proce-dure and analysis was carried out for PVAc.
∫ Tl
T∗(Cp −Cpg)dT =
∫ Tl
Tf′ (Cpl−Cpg)dT, (1)
where C p is the specific heat, C pg and C pl are the
specific heat for the glassy and liquid state respectively, and Tland T∗are arbitrary temperatures in the liquid and
glass region further away from the transition region. The Arrhenius law,
τ∝ 1 β ∝ exp ( △h Tf′ ) , (2)
was applied to the data in order to obtain the activation energy△h in units of temperature (in K :△h = △H∗/R,
where△H∗ is the activation enthalpy in J/mol, and R is the ideal gas constant in J/(mol·K) for both systems. These gave activation energies of 79 kK and 99 kK for DNA glass and PVAc respectively. These values are of the same order of magnitude. See Table 1.
Annealing at different ageing times
The samples were annealed at a temperature Tawhich
is 15 K below the inflection point of their respective specific heat curve measured during the cooling run at 1.2 K/min, i.e., Ta,DNA = 293 K and Ta,PVAc = 297 K
for DNA and PVAc. As stated before, we investigated a series of ageing times (relaxing times) tavarying from 84
h to 1 h, and even no ageing at all. In our previous work we proved that both samples behave in a qualitatively similar way [5]. However, for PVAc a peak is visible during reheating even without ageing, while for DNA there is no peak in the absence of ageing. This suggests that underlying relaxation mechanisms for the two glass-formers do not obey the same laws.
The DSC heating scans for melted DNA annealed with different annealing times ta, as described in the
experi-mental method, showed a progressive growth of an en-dothermic peak with the increase of ta[5]. The first step
in understanding the state of the sample after anneal-ing is to calculate the area under the endothermic peak, also called “enthalpy recovery”△H. This property cor-responds to an enthalpy decrease during the annealing process, which is again absorbed by the system to reach the equilibrium state at high temperature. It characterises the annealed glassy state from the energetic viewpoint. Furthermore, the annealed system can also be charac-terised by another property, its limiting fictive temper-ature, the same way we used it in the previous section to characterise glassy states obtained at different cool-ing rates. Owcool-ing to our experimental protocol in which we freeze the system to low temperature (268 K) before recording the DSC signal with increasing temperature, we apply Equation 1 to the specific heat curves. This pro-vides a value of Tf′, which describes the instantaneous state obtained after ageing that has been frozen at lower temperature.
Once this was calculated, the data were analysed using two different expressions of the relaxation time. In both cases, the limiting fictive temperature was used for the characterisation of ageing experiments. The first method consists in a treatment based on the TNM expression of the relaxation time, in which a type of ageing time shift factor R(Ta,ta) is used to compare the evolution during
ageing of the typical relaxation times ta, between DNA
and PVAc, at the ageing temperature Ta[6]. The second
treatment considers an Arrhenius law for the expression of the relaxation time, in which contrary to the former method, the ageing time shift factor is defined differently in order to follow the evolution of the relaxation times on the equilibrium liquid line for the two systems. Both treatments will be explained further in the following sections.
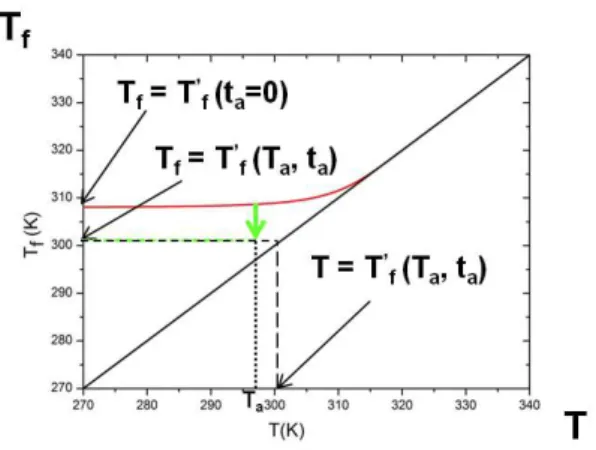
Figure 1 gives a graphical description of the concept of fictive temperature Tf as a function of temperature.
FIGURE 1. Evolution of the fictive temperature versus tem-perature after annealing; see text for details.
The graph shows how after annealing, the limiting fictive temperatures can be obtained. The continuous red curve corresponds to a cooling ramp at 1.2 K/min, where the ending point of the cooling measurement is Tf = Tf′(ta=
0), when no ageing is applied. The two characterisations of the ageing described above have been represented, the differences lie within the ending point. In the first method, the system is cooled down at the same rate, annealed at Ta(marked by the arrow), and finally cooled
down to a temperature lower than Ta; the relaxation time
is therefore calculated at the ageing temperatureτ(Ta,ta)
where the fictive temperature at that position Tf can be
assumed to equal Tf′(Ta,ta). In the second treatment,
the experimental method is the same but the relaxation time is considered to be a function of the limiting fictive temperature, where T= Tf′(Ta,ta).
First treatment: Ratio of the relaxation times at the ageing temperature
In order to characterise the behaviour of a glass former after ageing experiments, it is usual to represent the age-ing time shift factor ata =τ(Ta,ta)/τ(Ta,ta,r) as a
func-tion of the ageing time [6]. Whereτ(Ta,ta) is the
relax-ation time at the ageing temperature Taand at the
age-ing time ta, and ta,r is a reference ageing time. Here we
present the same type of ratio using the TNM expression of the typical relaxation time:
τ=τ0exp ( x△h T + (1 − x) △h Tf ) . (3)
In this expression, τ0 is related to the typical
relax-ation time of molecular vibrrelax-ations,△h is the activation enthalpy obtained by means of the different cooling rates experiments, T and Tf are the temperature and the fictive
temperature respectively, and x is the non-linearity pa-rameter pertaining to the glass structure dependence of the typical relaxation time. In this case, the ageing time shift factor could be written as:
R(Ta,ta) = τ0exp ( x△hT a + (1 − x) △h Tf ) τ0exp ( △h Tf′ ) . (4)
The fictive temperature appearing in the numerator is a function of the ageing temperature and the ageing time Tf = Tf(Ta,ta). From here onwards, we will assume that
this fictive temperature is the same that the limiting fic-tive temperature calculated using Equation 1. This as-sumption is valid because just after the ageing time the system is cooled again to the lowest temperature before reheating. Therefore, we suppose that during this second cooling the fictive temperature of the system had no time to relax and remained in the state reached after ageing at Ta. This assumption becomes more accurate as the
age-ing time increases. Indeed, for long ageage-ing time the real fictive temperature of the system at Tadoes not have time
to evolve significantly within the time interval of the sec-ond cooling. The reference relaxation time in the denom-inator was defined by using the limiting fictive tempera-ture Tf′calculated for the DSC heating ramp obtained af-ter cooling at 1, 2 K/min. In other words, the reference ageing time is chosen for an experiment without age-ing or for a reference ageage-ing time ta,requal to zero. The
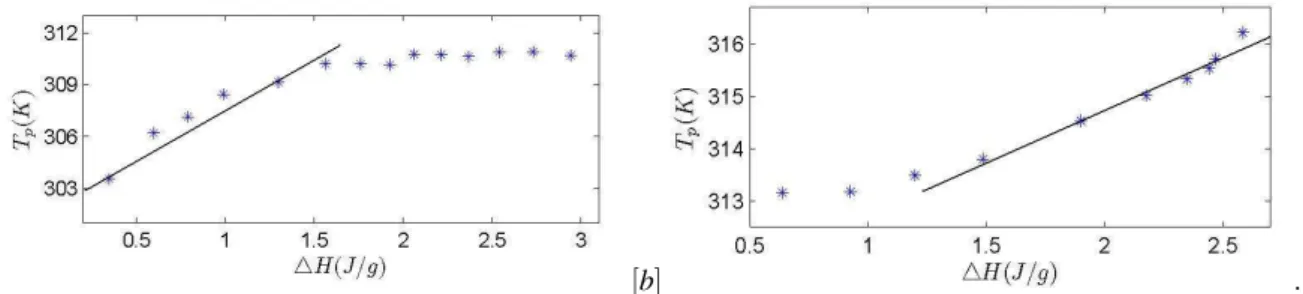
non-linearity parameter x is calculated by means of the Kovacs–Aklonis–Hutchinson–Ramos (KAHR) approach [7]. From each of the DSC heating curves obtained at the different ageing times, the enthalpy recovery (△H) and the temperature of the maximum of the peak Tpwere
de-termined. Figure 2 shows Tpas a function of△H for each
ageing time.
The outside-saturation range shows a straight line with a rate dTp/d(△H) of about 4.03 gK/J and 1.8 gK/J for
DNA and PVAc respectively. From the measurements carried out at the reference cooling rateβ = 1.2 K/min, the step-like descent exhibited by the specific heat at the glass temperature△Cp(T = Tg) was estimated to 0.505
J/gK for DNA and 0.52 J/gK for PVAc. Henceforth, using KHAR’s method the parameter x was calculated to 0.3 for DNA and 0.48 for PVAc. Table 1 gives a summary of the characteristic values defined using the first method for both DNA and PVAc.
The data for DNA glass and PVAc was analysed using the first treatment for the ratio of the relaxation times at the ageing temperature ta. Figure 3 shows the ageing
time shift factor determined as a function of the ageing temperature.
While the ageing time shift factor seems to behave similarly for DNA and PVAc for the points comprised within the 33 first hours of measurements (with only a
difference in amplitude), a clear change occurs in the variation rate for the longest ageing times. The factor seems to undergo a saturation for PVAc while for DNA it increases dramatically.
Second treatment: Ratio of the relaxation times at different limiting fictive temperatures
A different analysis was carried out with the same data for both systems [5]. This differs from the one described above as it is based on a different expression for the re-laxation time. It aims, this time, to study the ageing de-pendence of the relaxation times at Tf′, and thus to define the ageing time shift factor on the basis of the Arrhenius law. Indeed, by definition, the non-equilibrium state of a frozen system at a given temperature (in our case Ta) can
be described by the corresponding equilibrium state (liq-uid), but taken at the temperature defined by the limiting fictive temperature. Making Tf = Tf′ and T = Tf′ in the
TNM expression of the relaxation time leads to an Ar-rhenius law. As already said, the state of the sample after annealing can also be characterised by the limiting fictive temperature. This is also consistent with the previous as-sumption that the fictive temperature after ageing can be frozen by the second cooling at the lowest temperature. Within this scenario, a type of ageing time shift factor can be defined such as follows:
R′(Ta,ta) = τ0exp ( △h Tf′(Ta,ta) ) τ0exp ( △h Tf′(ta=0) ) = exp ( △h Tf′(Ta,ta) − Tf′(ta= 0) ) . (5) Where Tf′(ta= 0) is the limiting fictive temperature
calculated for the reference cooling experiment with a temperature rate of 1,2 K/min (the same than for the previous treatment).
Figure 4 shows the ageing time shift factor R′ deter-mined as a function of the limiting fictive temperature.
In this treatment, one has to bear in mind that the evo-lution of the relaxation time is characteristic of the corre-sponding equilibrium liquid taken at different decreasing temperatures (limiting fictive temperatures), the temper-ature limit being the real tempertemper-ature of ageing of the system. The major advantage of such a treatment is that it does not involve a complex phenomenological KAHR model.
As one can notice the ratios R and R′ are different, but this is not surprising since they measure different quantities. R takes into account the KHAR’s parameter x, while R′ does not. And thus, the differences are not due to experimental errors. It is difficult to give a physical meaning to the absolute values of these numbers but what
[a] [b] .
FIGURE 2. Dependence of the recovery enthalpy△H on the temperature of the enthalpic peak Tpfor DNA (a) and PVAc (b).
The straight lines corresponds to linear fits of the measurements outside the saturation range, which slope was estimated to 4.03 gK/J and 1.8 gK/J for DNA and PVAc respectively
TABLE 1. Summary of the calculated values relevant for the analysis of the relaxation behaviour of both systems, DNA and PVAc. The first two, dTp
△H and△Cp, were necessary in order to obtain the
non-linearity parameter x. Ta(K) Tg(K) d△HdTp (gK/J) △Cp(J/gK) x △h (kK) Molecular weight DNA 293 308 4.03 0.51 0.30 79 1.3 x10⁷ PVAc 297 312 1.80 0.52 0.48 99 1.6 x 10⁵ 8 9 10 11 12 13 0 1 2 3 4 5 PVAc DNA l n R ( T a , t a ) lnt a
FIGURE 3. Evolution of the ageing time shift factor R(Ta,ta)
versus the logarithm of the ageing time ln(ta) for DNA (open
circles) and PVAc (filled circles). The data was analysed using the first treatment, in which the relaxation time is defined at the ageing temperature.
it is important is their evolution with ageing time. Both figures show that for PVAc R and R′vary almost linearly with ln(ta), while for DNA glass there is a significant
raise of the two ratios for long ageing times. We come back to this point in the discussion section.
DISCUSSION
Our calorimetric study of a DNA film has shown that, after the thermal denaturation of the double helix, this
8 9 10 11 12 13 0 1 2 3 4 5 6 7 DNA PVAc l n R ( T a , t a ) lnt a
FIGURE 4. Evolution of the ageing time shift factor R′(Ta,ta) versus the logarithm of the ageing time ln(ta) for
DNA (open circles) and PVAc (filled circles). The data was analysed using the second treatment, in which the relaxation time is defined at the limiting fictive temperature Tf′.
system has properties which are very similar to those of a polymer glass, such as PVAc, with however noticeable differences
1. The activation energies for DNA (80kK) and PVAc (100kK) are slightly different, but are on the same order of magnitude.
2. While DNA glass and PVAc seem to behave simi-larly for short ageing times at Tg− 15 K, they
be-have differently for ageing times larger than about 30 hours. The increase of the relaxation time for
DNA seems to indicate that ageing occurs in two stages. In a first stage the system can relax rapidly to finally reach a state in which relaxation becomes very slow in the second stage. This second stage only concerns very long ageing times.
The activation energies△h for PVAc and DNA glass are measuring the energies needed to break the chemical bonds to allow the motion of the systems. For both, PVAc and DNA glass, these are weak bonds between organic elements, and thus from an energetic point of view these two compounds are not very different. This is the reason why we measure comparable activation energies (point 1). On the contrary, in point 2, we show that DNA glass relaxes slower at longer ageing times than PVAc. This difference in the relaxation times could be related to kinetic effects. For DNA, the sliding of the chains is hindered by their particular structure: they have bases dangling on the side, so that, due to the confinement of the environment, the large amplitude motions of the structure as a whole will certainly be a very slow process. From a methodology point of view, we have shown that it is relevant to describe the ageing character of a system by the limiting fictive temperature Tf′and hence quantify the relaxation time as a function of this property
τ(T′ f).
Similar experiments at different ageing temperatures in the glassy region could complete this study. This could bring insights into the time evolution of the typical re-laxation times as a function of temperature for PVAc and DNA glass.
REFERENCES
1. C. T. Moynihan, P. B. Macedo, C. J. Montrose, P. K. Gupta, M. Debolt, J. Dill, B. Dom, P. Drake, A. Easteal, P. Elterman, R. Moeller, H. Sasabe, and J. Wilder, Annals of the New York Academy of Sciences 279, 15–35 (1976). 2. G. I. Tsereteli, T. Belopolskaya, N. Grunina, and
O. Vaveliouk, Journal of Thermal Analysis and Calorimetry 62, 89–99 (2000).
3. S. Lee, P. Debenedetti, J. Errington, B. Pethica, and D. Moore, J. Phys. Chem. B 108, 3098–3106 (2004). 4. A. Rupprecht, Biochimica et Biophysica Acta 199, 277–280
(1970).
5. J. Valle-Orero, J.-L. Garden, J. Richard, A. Wildes, and M. Peyrard, Journal of Physical Chemistry B 116, 4394–4402 (2012).
6. J. Zhao, and G. B. McKenna, J. Chem. Phys 136, 154901 (2012).
7. J. M. Hutchinson, and P. Kumar, Thermochimica. Acta. 391, 197–217 (2002).