HAL Id: tel-02605252
https://hal.inrae.fr/tel-02605252
Submitted on 16 May 2020HAL is a multi-disciplinary open access archive for the deposit and dissemination of sci-entific research documents, whether they are pub-lished or not. The documents may come from teaching and research institutions in France or abroad, or from public or private research centers.
L’archive ouverte pluridisciplinaire HAL, est destinée au dépôt et à la diffusion de documents scientifiques de niveau recherche, publiés ou non, émanant des établissements d’enseignement et de recherche français ou étrangers, des laboratoires publics ou privés.
Mining and learning from spatio-temporal data:
examples and perspectives
Dino Ienco
To cite this version:
Dino Ienco. Mining and learning from spatio-temporal data: examples and perspectives. Environ-mental Sciences. HDR en Informatique, Université de Montpellier, 2016. �tel-02605252�
H
ABILITATION Á
D
IRIGER DES
R
ECHERCHES
U
NIV. M
ONTPELLIER, E
COLE DOCTORALEI2S,
I
NFORMATIQUEMining and Learning from
Spatio-Temporal Data: Examples and
Perspectives
With a major emphasis on Remote Sensing Satellite Images
Dino Ienco
IRSTEA
UMR TETIS
Montpellier, France November 9, 2016 JURYDennis SHASHA Professeur, NYU CS Dept., USA Rapporteur Dino PEDRESCHI Professeur, Universitá di Pisa, Italy Rapporteur Patrick GALLINARI Professeur, Univ. Pierre et Marie Curie, LIP6, Paris Rapporteur Jean-François BOULICAUT Professeur, Insa, Lyon Examinateur Bruno CREMILLEUX Professeur, Univ. de Caen Normandie, Caen Examinateur Maguelonne TEISSEIRE Directeur de Recherche, IRSTEA, Montpellier Examinateur
iii
Acknowledgements
First of all, I would thank my colleagues at the UMR TETIS and at LIRMM for their fruitful discussion and exchanges. I thank the members of the Advanse team for their positive influence on my researches and on the person who I am now. During these years, I had also the possibility and the privilege to collaborate with many researchers outside France. These collaborations teach me a lot and help me to grow both professionally and personally. I would also thank the members of the jury to have accepted to review my HDR. Last but not least, I thank all my family for their educa-tion, support and love they gave me.
v
Contents
Acknowledgements iii 1 Introduction 1 1.1 Abstract . . . 1 1.2 Context . . . 1 1.3 Thesis Organization . . . 42 Contributions in Spatio-Temporal Analysis 5 2.1 Introduction . . . 5
2.2 Moving Object Data: Efficiently extract New, Useful and Non Redundant Trajectory Patterns . . . 5
2.2.1 Mine different patterns under a unique approach . . 6
2.2.2 Flexible Moving Object Patterns . . . 6
2.2.3 Mining Representative Moving Object Patterns . . . 7
2.3 Spatial Interaction: One more piece of the puzzle . . . 7
2.3.1 Understanding Temporal Evolutions . . . 8
2.3.2 Manage Rich Relational Structure . . . 9
2.4 Remote Sensing Classification: Application to Satellite Images 11 2.4.1 Combine Active and Transductive Learning . . . 11
2.4.2 Time Series . . . 11
2.5 Data Stream Classification: Deciding when update the model 12 2.5.1 Active Learning . . . 12
2.5.2 Categorical Change Detection . . . 13
2.6 Other Research Activities in Data Science . . . 13
2.6.1 Clustering and Co-Clustering Unstructured data . . . 14
2.6.2 Semi-Supervised Learning in Categorical Data . . . . 14
2.7 Conclusion . . . 15
3 Perspectives 17 3.1 Research Objectives . . . 17
3.2 Graph-based approaches to analyze spatial information . . . 18
3.2.1 Select Interesting Multigraph Patterns . . . 18
3.2.2 Multigraph Rules . . . 20
3.2.3 Approximate Multigraph Mining . . . 20
3.2.4 Applications on other domains . . . 21
3.3 Summarize Temporal Evolutions in RS Time Series . . . 21
3.3.1 Summarize evolutions in RS Time Series . . . 21
3.3.2 Mining Episodes in Evolution Graphs . . . 22
3.4 Exploit Spatial Autocorrelation in remote sensing analysis . 23 3.4.1 Deep Learning in Heterogeneous and Incomplete Data 23 3.4.2 Deep Learning for image data archives . . . 24
3.4.3 Mixing Convolutional and Recurrent Neural Networks 25 3.5 Conclusion . . . 26
vi
A Mining Representative Moving Object Patterns 27
B Data Stream Classification: Active Learning 41
C Combining Active and Transductive Learning 59
Bibliography 65
1
Chapter 1
Introduction
1.1
Abstract
My research activities are related to the fields of Data Mining, Data Base and Machine Learning. The main goal of my work is the development of new techniques and algorithms to manage and analyze large amounts of heterogeneous data with a major emphasis on data involving spatial and temporal characteristics (i.e. satellite images, environmental data, sensor data, etc...).
1.2
Context
During my PhD (2007-2010) I focused my attention on the study of methods and techniques to manage and mine large amounts of information to auto-matically extract hierarchical representations of the data. More precisely, I designed, developed and implemented clustering techniques to manage and mine textual and categorical data. The results of my researches were: i) methods to evaluate the distance between the data described by categorical variables and ii) techniques to extract hierarchical representations from tex-tual data [44]. In the same period, I also investigated the field of associative classification proposing new classification methods based on local features extracted through itemset mining approaches [66].
During my PhD training period, I also had the opportunity to perform an internship at the Yahoo Research Laboratory in Barcelona for a period of three months where I worked on the analysis of information propagation on social network data [13].
From February 2011 to September 2011, I turned my attention to the analysis of spatio-temporal data. Indeed, data with a strong geographic component are now becoming more widespread and they are a real source of information that poses new challenges to data mining approaches. To improve my skills in this field I applied for a post-doctoral fellowship at Cemagref Institute in Montpellier (now IRSTEA). The topic of the post-doc fellowship was related to the analysis of spatio-temporal data and classifi-cation of remote sensing satellite images. The scholarship allowed me to develop skills and propose new innovative approaches to deal with classi-fication issue in the context of time series of remote sensing satellite images. During this period, I have also started a collaboration with the LIRMM lab that is formally described by my association to the TATOO team before and, now, to the recently created ADVANSE team.
2 Chapter 1. Introduction
Activities after 2011
In September 2011, I was recruited at IRSTEA on the subject of data anal-ysis and knowledge extraction from spatial and temporal data. In particu-lar, my main activities are devoted to study, formalize and develop new data mining and machine learning techniques for spatio-temporal data. From a methodological point of view, I investigated new methods (super-vised/unsupervised classification and pattern mining) especially tailored for such kind of data. Most of the techniques I developed model the data through a network (or graph) structure to explicitly represent the spatial interactions among the data. As a privileged field of application, the de-veloped methods are employed for the analysis of remote sensing images where both spatial and temporal components play a crucial role in the knowledge extraction process.
Main Research Activities
In 2012 I co-supervised the PhD thesis of Phan Nhat Hai on moving object data mining with Dr. Maguelonne Teisseire (IRSTEA) and Prof. Pascal Pon-celet (LIRMM). The objectives of this thesis were to find new approaches and methods to efficiently mine different kinds of trajectory patterns at the same time [35,37]. This thesis also contributed to develop new strategies to summarize interesting and useful patterns from the extracted results [36]. Reducing the output size of pattern mining algorithms is an important is-sue since, sometimes, the size of outputted patterns can be bigger than the original data size. Supplying a method to filter out the most interesting trajectories can thus increase the understandability and the usefulness of the extracted knowledge. The thesis was defended in October 2013 and Dr. Phan Nhat Hai is currently post-doc at the University of Oregon (USA).
In the same year, between February and April 2013, I spent three months as a visiting researcher at the University of Waikato, New Zealand, where I collaborated with Prof. Bernhard Pfahringer to new data mining algorithms for data streams. The main challenge in data stream mining is the severe computational constraint imposed by the high speed at which data arrives. This data velocity can drastically affect the whole mining process [49,48].
Still in 2013 I started a collaboration with Dr. Andrea Tagarelli (Univer-sity of Calabria, Italy). He had previously been the reviewer of my PhD thesis. In conjunction with Dr. Andrea Tagarelli, we supervised the PhD thesis of Salvatore Romeo on the use of matrix and tensor decomposition methods for document clustering [79,78]. Dr. Salvatore Romeo defended his thesis in April 2015 and, since October 2015, he is post-doc researcher at QCRI (Qatar Computer Research Institute, Doha, Qatar) working on In-formation Retrieval and Natural Language Processing. With Dr. Tagarelli, we are currently collaborating on the development of new data mining ap-proaches for the study of complex and heterogeneous data with a major emphasis on multilingual corpora.
Between 2013 and 2015, I co-supervised Dr. Fabio Güttler, post-doc re-searcher at UMR TETIS, with Dr. Maguelonne Teisseire and Prof. Pascal Poncelet on the topic of Change Detection analysis of time series of satel-lite images. The fellowship had a duration of 18 months and it was funded
1.2. Context 3
by the EQUIPEX GEOSUD1. This supervision gave me the opportunity to open new research activities in the field of spatio-temporal data analysis [31,32]. In this work, we proposed new approaches (validated by experts) to better characterize evolution and/or changes in time series of satellite images by proposing a compact and efficient description to depict how nat-ural phenomena evolve over time.. The fellowship ended in March 2015 and Dr. Fabio Güttler is now post-doc at the University of Strasbourg.
In 2014, I started the co-supervision of the PhD thesis of Vijay Ingalalli with Prof. Pascal Poncelet. This thesis is founded half by the Labex Numev and half by a grant that I have obtained from IRSTEA. This thesis focuses on the development of new graph management and mining techniques with applications on remote sensing data. More in detail, the work of Vijay In-galalli focuses on mulitgraph data. A multigraph is a graph where pairs of nodes can be linked to each other via different types of edges. The multi-graph representation is particularly useful to describe and reason about en-tities that interact with each other through different dimensions. In the case of spatio-temporal data, graph (or multigraph) models are well suited to describe spatial correlations among data. Firstly, we started to work on ef-ficient algorithms to deal with the iso/homomorphism problems in multi-graph structures [90,91]. Now, we are investigating new efficient methods to extract frequent patterns from multigraph data.
In June 2014, I visited the CNR Institute (Milano, Italy) hosted by Dr. Gloria Bordogna with whom I started a collaboration on spatio-temporal data clustering [16, 7]. In the autumn of the same year I was invited by Prof. André Carvalho (USP Sao Carlos, Brazil) as an invited lecturer at the Brazilian doctoral school on Machine Learning and Data Analysis2. The topic of the lecture was about advanced Machine Learning approaches (Ac-tive Learning).
In autumn 2015 I started the co-supervision of two new PhD thesis on the analysis of remote sensing images.
The thesis of Lynda Khiali, co-supervised with Dr. Maguelonne Teis-seire, is founded by an AVERROES scholarship (Algerian government). The main goal is to investigate the analysis of long time series of satellite im-ages. The work is devoted to analyze the image archive Spot World Her-itage provided by the CNES institute. This archive contains time series of satellite images that span over a period of more than twenty years. The temporal richness of this source of data can pave the way to better under-stand complex phenomena such as climate change behaviors, development of wetlands, ecological changes in the study area, etc...
The thesis of Lionel Pibrel, co-supervised with Dr. Marc Chaumont (LIRMM) and Dr. Gerard Subsol (LIRMM) is founded by an ANR CIFRE fellowship in collaboration with the company Berger Levrault. The work focuses on the use of deep learning techniques on heterogeneous remote sensing data for the object detection task in urban areas. Standard classi-fication algorithms need a training phase before being employed on new unseen examples (test data). The goal of this thesis is to develop new deep learning architectures to manage heterogeneous data coming from different sensors (optical sensor, satellite images, drone images, radar images, etc.)
1http://ids.equipex-geosud.fr/(accessed April 5th, 2016) 2http://www.amda.icmc.usp.br/mlkdd2014/
4 Chapter 1. Introduction
in a setting where training and test data cannot fit the same format and, commonly, the test set is poorer (in terms of information) than the training set.
1.3
Thesis Organization
I choose to present the research activities I did in the past five years in the TETIS and LIRMM laboratories by means of a collection of publications. Each paper covers one of the different aspects I have dealt with in the anal-ysis of spatio-temporal data. In addition to these representative publica-tions, I develop three chapters to explain from where I come from, what I have done and what I would like to do in the near future.
More in detail, the first chapter has quickly introduced my career, the research activities I developed during my PhD and the researches I investi-gated in the last five year once I have joined my current team in Montpellier. In the second chapter of this manuscript I draw, with a particular em-phasis on scientific contributions, a picture about my activities in the field of data mining and machine learning. The second chapter is especially ded-icated to my activities in the field of spatio-temporal data analysis, but it also supplies an overview of my skills and background in the general field of data science. It also points out the national/international collaborations I grew in the last years. All these collaborations, I think, heavily highlight that research is not a solitary process but needs exchanges and partnerships in order to benefit from different points of view with the goal of creating new knowledge.
In the third and last chapter, I draw the conclusion of my manuscript with a list of perspectives directly related to my research but, also, to the field of spatio-temporal data analysis. This chapter summarizes a part of my ideas about possible future researches and, possible interesting trends that are currently investigated by the research community. In some sense, it paves the way to future subjects tightly related to my on-going projects that I will be glad to investigate.
5
Chapter 2
Contributions in
Spatio-Temporal Analysis
2.1
Introduction
As the world becomes interconnected, spatio-temporal data are more ubiq-uitous and are getting more and more attention. Moving object (e.g., taxi, bird) trajectories recorded by GPS devices, social event (e.g., microblogs, crime) with location tag and time stamps, and environment monitoring (e.g., remote sensing images) are typical spatio-temporal data that we meet every day1. These emerging spatio-temporal data also bring new chal-lenges and opportunities to data mining and machine learning researchers. This chapter introduces some of the contributions we realized in the past years regarding spatio-temporal data analysis. It is organized in five parts: the first two sections are more related to works on pattern mining and pat-tern extraction we developed during the researches conducted in Montpel-lier. The first section is related to the analysis of Moving Object data realized during the PhD Thesis of Dr. Phan Nhat Hai while the second one intro-duces my recent experiences related to manage spatial interaction through graph-based approaches.
On the other hand, the third and fourth sections are more focused on classification techniques (supervised and semi-supervised) we conceived in partnerships with other colleagues. The third section involves the work on data stream analysis we developed in collaboration with Prof. Bernhard Pfahringer during my visit at the University of Waikato, New Zealand. The fourth section describes some applications of my research in the field of remote sensing image analysis.
Finally, the fifth section gives a quick overview of my research collabo-rations in the general field of data mining and machine learning.
As a general guideline to read this chapter, the contributions we pro-posed in the different domains are highlighted in bold face.
2.2
Moving Object Data: Efficiently extract New,
Use-ful and Non Redundant Trajectory Patterns
Techniques able to summarize the behavior of groups of objects moving together are getting more and more attention due to the rapid development
1http://researcher.watson.ibm.com/researcher/view_group.php?id=
6 Chapter 2. Contributions in Spatio-Temporal Analysis
of positioning technologies (smartphones, GPS tracking systems, location-based services, etc..) that constantly record and store position information.
Analyzing data generated from these systems can be useful for:
+ Understanding animal migrations to support public policies in order to preserve biodiversity;
+ Studying and monitor traffic on road networks to better design future transportation systems;
+ Detecting suspicious or anomaly movement patterns behaviors. This is why during the PhD Thesis of Phan Nhat Hai, co-supervised with Prof. Pascal Poncelet and Dr. Maguelonne Teisseire we studied, con-ceived and developed new data mining algorithm to extract and summa-rize collections of trajectory patterns from moving object dataset.
2.2.1 Mine different patterns under a unique approach
A lot of research was done to analyze such datasets with the goal to ex-tract meaningful patterns [38] and, at the same time, many algorithms have been proposed such as CuT S∗ [51] (convoy mining), ObjectGrowth [57] (closed swarm mining), V G-Growth [96] (group pattern mining), etc... Each of the different proposed methods has its own characteristics and it only extracts one type of pattern. This means that if we want to compare dif-ferent moving object patterns extracted from the same dataset, we need to re-implement each of the different methods and then run each of the algo-rithm independently.
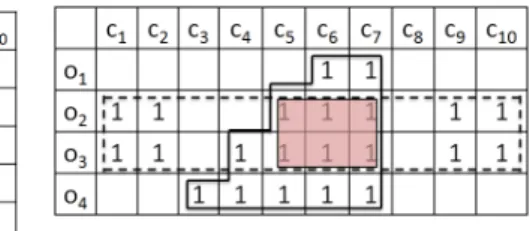
This issue was addressed by theGET_MOVEapproach [34]. This
frame-work represents the moving object database by a cluster matrix in which a row is an object and a column is a cluster of objects at a certain time stamps. The matrix representation is successively employed to extract fre-quent closed itemsets from which movement patterns can be mined.
2.2.2 Flexible Moving Object Patterns
One issue shared by all the previous proposed moving object pattern meth-ods regards the way parameters are set. Defining a unique strict threshold, i.e. the maximum time gap between pair of object clusters, without some degree of flexibility can negatively impact the extraction process due to the imposed tight bound. Another issue that affects many moving object pat-tern definitions is the constraint related to the object to monitor. Most of the previous approaches [38] consider that a pattern is defined over the same set of objects but, if we for instance consider animal migration, different ob-jects can join (or leave) a group of obob-jects that is moving towards a certain direction. Also in this case the data mining method needs to model some degrees of flexibility to manage such a situation.
As the data can contain noise or the user has approximate knowledge about the data itself, allowing to soften certain constraints or manage grad-uality in the objects that belong to a pattern can alleviate such problems.
In [35] we design and develop a fuzzy pattern mining approach to soften the time gap constraint in the field of moving object data min-ing. This pattern definition allows the user to define an interval time gap
2.3. Spatial Interaction: One more piece of the puzzle 7
(minimum/maximum) and fuzzy logic operators are introduced to retrieve patterns that match the fuzzy constraints. From an algorithm point of view, we still exploit an itemset-based representation so that GET_MOVEcan be employed to gather all the fuzzy moving object patterns.
The issue related to analyze and extract object trajectories in which individuals can join (or leave) the backbone of the pattern is addressed by [37]. The proposed algorithm manages gradual moving object patterns which satisfy the graduality constraint during at least mint timestamps. As state before, the graduality constraint allows the number of objects to increase (or decrease) while the set of remaining objects shared should be the same among the clusters.
2.2.3 Mining Representative Moving Object Patterns
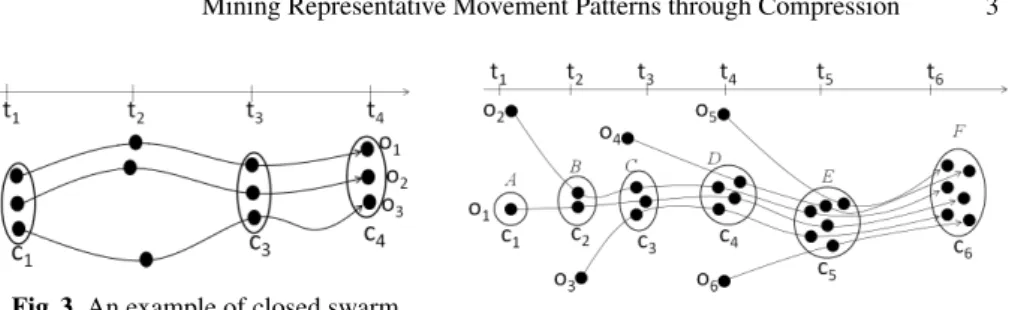
Most of the researches in moving object mining are focused to extract spe-cific trajectory patterns that differ in their characteristics with the goal to capture various aspects of the data [51,57,96,37]. All these methods extract thousand of patterns resulting in a huge amount of redundant knowledge that is difficult to exploit. Spatio-Temporal databases involve complex in-formation. Due to this complexity, studying a spatio-temporal database by employing only a single type of pattern is not enough to depict an informa-tive picture of the data.
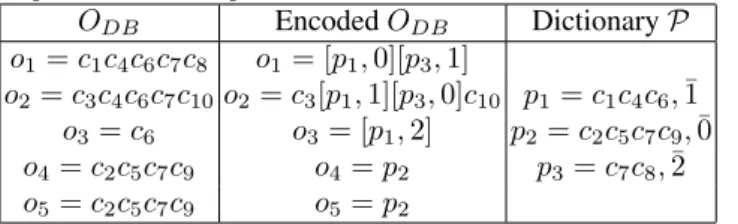
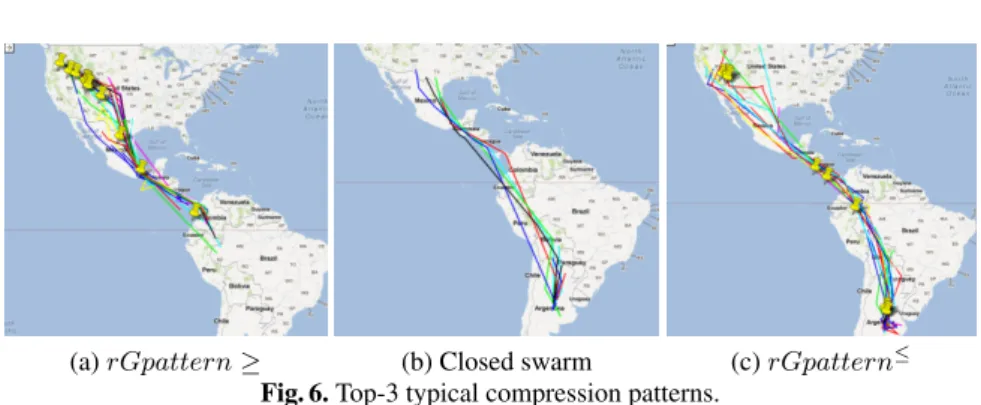
Motivated by these issues, we develop a Minimum Description Length (MDL)-based approach that compress spatio-temporal data leveraging different kinds of moving object patterns [36].
The proposed approach introduces a way to evaluate to which extent each extracted pattern is useful and not redundant to summarize the orig-inal spatio-temporal dataset. The MDL criterion allows to rank the set of heterogeneous patterns selecting only those that best compress the data and discarding all the useless ones.
2.3
Spatial Interaction: One more piece of the puzzle
During the last years, I moved more and more my attention towards the analysis of remote sensing data. Such source of information still belongs to the category of spatio-temporal data but, differently from the informa-tion I worked on before, it has some peculiarities: i) the spatial dimension plays a role at least as important as the temporal aspect; ii) data are mainly represented through images; iii) in most cases images are multi-bands (or hyperspectral) and they can be enriched by additional spatial information (Digital Terrain Model, etc.). Classical data mining and machine learning approaches cannot be directly applied on such data without an important pre-processing and transformation step and, such operation needs to be adapted to the particular task we would deal with.In the field of spatio-temporal data analysis, modeling the data via graph-based representation can be beneficial to analyze information from both spatial [89] and temporal [17] point of views. From a spatial point of view, the graph structure can supply many information about how the objects
8 Chapter 2. Contributions in Spatio-Temporal Analysis
of the database are arranged while, from a temporal perspective, explic-itly state the links (or relationships) among objects in a graph can help to describe and/or simulate a temporal process.
Graphs, in computer science, are an ubiquitous structure that can be easily employed to model real world information. This tool is particularly suitable to represent interactions between data [3]. Examples of graph data are social networks, gene-gene interaction networks, linked open data, doc-ument networks, knowledge graphs, etc... On the other hand, the flexibility of such a structure also allows to model data that does not naturally fit the network paradigm. The graph representation helps to highlight the inter-action among the objects of the data and this interinter-action can be leveraged by specialized data mining and machine learning methods. For example, a textual collection can be represented as a graph where documents are nodes and a link exists between two nodes (documents) if their similari-ties is above a certain threshold [78]. Another similar example is supplied by the analysis of remote sensing images. After a first pre-processing seg-mentation step, the image segments can be represented by nodes and a link exists between two nodes if their corresponding segments spatially over-laps [32] or they have similar spectral signature [31].
2.3.1 Understanding Temporal Evolutions
During the last period I gave more and more attention, as an application domain, to the analysis of Remote Sensing data. In particular, thanks to the collaboration with experts in remote sensing analysis, we developed new data mining and machine learning approaches especially tailored for this kind of data. Recently, during the post-doctoral period of Dr. Fabio Gut-tler, we have started to employ graph-based analysis to model and describe temporal evolutions from time series of satellite images [32,33]. A sketch of the process is illustrated in Figure 2.1.
Given a time series of satellite images the method performs the follow-ing steps: i) segments all the images by collectfollow-ing together all the segments; ii) among the segment set, it chooses a set of reference objects maximizing the covering of the study area and minimizing the overlapping between the chosen reference objects. A reference object can come from any image of the time series; iii) For each reference object, it builds a DAG (Directed Acyclic Graph) that connects all the segments that intersect the reference object over all the images of the time series. The obtained DAG is a K-partite graph where K is equal to the number of images in the time series [32]. A direct edge exists in the DAG if the segment at level K− 1 (segment of the image K − 1) spatially intersects the segment at level K (segment of the image K). Figure 2.2 shows an example of an evolution graph (DAG) with the corresponding segments ordered by time stamps.
A graph can be easily exploited to describe the evolution of a zone. Given a study area (represented by a time series of satellite images), a collec-tion of evolucollec-tion graphs can be extracted. Such a set of graphs can describe the different phenomena present in the data. Most of the previous proposed methods mainly contemplate an analysis at pixel level for a reduced num-ber of images (two or three) [42] while the novelty of our proposal lies in the use of objects instead of pixels to describe spatio-temporal evolutions.
2.3. Spatial Interaction: One more piece of the puzzle 9
FIGURE2.1: (Guttler et al. - to appear) The framework to
extract evolution graphs from a time series of Remote Sens-ing Satellite Images.
FIGURE2.2: (Guttler et al. - to appear) An example of evo-lution graphs (K-partite DAG) from a time series of six
im-ages.
2.3.2 Manage Rich Relational Structure
Simple graph structures, sometimes, are not enough to well describe the richness of real world data. Nowadays many types of data exhibit com-plex relational structures where additional information in the form of mul-tiple edges between nodes exist. Such kinds of network structures can be defined as multigraphs or multilayer graphs [71, 76, 91, 75]. They allow different types of edges in order to represent different types of relations between vertices [10, 84, 14, 52]. Many real world scenarios can be mod-eled as multigraphs. For instance, by considering different social networks spanning over the same set of people, but with different life aspects (e.g.
10 Chapter 2. Contributions in Spatio-Temporal Analysis
social relationships such as Facebook, Twitter, LinkedIn, etc.), we can get as many edge types as different aspects. In biology, protein-protein interac-tion multigraphs can be created considering the pairs of proteins that have direct interaction, physical association or they are co-localised [14]. In ad-dition to these examples, Resource Description Framework (RDF) graphs can be naturally represented as multigraphs where the same subject/object node pair is connected by different predicates (properties) that describe dif-ferent types of relationships [58].
Recently, I focused my attention to the study of such particular struc-tures [71,76,91,75] not only because multigraphs can model a wide range of application scenarios but, they can be extremely useful to model, min-ing and analyze spatio-temporal data. More in detail, in the context of the PhD Thesis of Mr. Vijay Ingalalli, we have designed and developed efficient methods to deal with the problem of subMultigraph iso and ho-momorphism [90,91]. Both problems are known to be NP-Complete and, to some extent, the homomorphism problem is more general than the iso-morphism one.
In the case of the multigraph structure the sub isomorphism test needs to take into account the topological structure but also the containment re-lationships between the edge set linking a pair of nodes. An example is given in Figure 2.3. In this example, we can observe two graphs: G1 and G2. The table in Figure 2.3 reports the set of embeddings of graph G1 in graph G2 with the corresponding mapping. If we consider the embedding Emb 1 the edge (u1,u2) of G1 matches the edge (v2,v3) because the red edge between (u1,u2) is contained among the edges (red, green) between (v2,v3). The same consideration applies for the Emb 2.
Emb 1 Emb 2 Emb 3
u1 v2 v1 v5 u2 v3 v3 v6 u3 v1 v2 v4 u1 u2 u3 v2 v1 v3 v4 v6 v5
G1
G2
FIGURE2.3: Sub Isomorphism on Multigraph: Embeddings of G1 in G2. The table list the possible matching between
nodes in G1 and vertex in G2.
Efficiently performing subgraph matching is useful for image analy-sis [28] as it can be used as a flexible query mechanism to answer spatial queries. The original image can be represented by a graph structure and the goal is to detect and retrieve all the portions of the images that match a certain geospatial pattern.
2.4. Remote Sensing Classification: Application to Satellite Images 11
2.4
Remote Sensing Classification: Application to
Satel-lite Images
Remote sensing images are an useful source of information to monitor spatio-temporal phenonmena [99]. The increasing number of projects and re-searches about remote sensing supplies huge amounts of data that are pro-duced almost every day. For instance, the SENTINEL project2 promises to capture high-resolution images every five/ten days producing a huge volume of images to process. Studying and developing suitable machine learning and data mining techniques to efficiently manage such kinds of data can be crucial for different purposes such as: food monitoring in re-mote regions, climate change understanding, land cover and land use clas-sification, complex landscape description [68,88].
2.4.1 Combine Active and Transductive Learning
Data labels are usually difficult and expensive to obtain. Standard classifi-cation techniques heavily rely on the hypothesis that a big quantity of la-beled examples (training set) is available to build a predictive model. Con-sidering the remote sensing domain the label acquisition constitutes a time and effort consuming task for the expert [23]. Classical supervised induc-tive classification approaches (i.e. SVM, Naive Bayes, Random Forest, etc.) require many labeled data to train the model. Also, they assume that train-ing and test data are not available at the same time since the model they have learnt needs to be general enough to classify new unseen examples available in a near future [92]. However, in the case of remote sensing image classification, training examples are limited and all the examples (training and test) are available at the same time. Most of the time, a predictive model is learnt on a portion of the image and it is successively employed to clas-sify the rest of the same image. To tackle these two characteristics in land cover classification: i) data labels acquisition and ii) training and test data available at the same times, we propose in [31] a new active/transductive learning framework to cope with object-based remote sensing classifica-tion. Transductive learning [83] belongs to the family of semi-supervised approaches. The goal of this kind of methods is to propagate information from the labeled data to the unlabeled one leveraging the availability of training and test data at the same time. These kinds of techniques offer an effective approach to supply contextual classification of unlabeled ones by using a relatively small set of labeled examples. To deal with both label scarcity and quality of training set, we couple the transductive strategy with active learning with the goal to improve accuracy performance and supply a valid alternative to standard classification techniques usually employed in remote sensing domain such as Support Vector Machines and Random Forest [41].
2.4.2 Time Series
Although data from satellite images are very useful for monitoring land surface, the large quantity of spatio-spectro-temporal measurements stored
12 Chapter 2. Contributions in Spatio-Temporal Analysis
by the instruments limits the usefulness as sources of information. In recent years, research on spatio-temporal databases has consequently increased alongside research on mining such data [11]. In [74] we deal with the clas-sification of remote sensing time series data with the purpose to charac-terize land use in the northern fringe of sub-Saharan Africa. In this work we put a major stress on the temporal dimension. More in detail, we devel-oped a data mining methodology to extract multidimensional sequential patterns to characterize temporal behaviors. In the same spirit as [66], we used the extracted multidimensional sequences to build an associative clas-sifier, and show how the patterns help to discriminate among the classes. We evaluated our technique using a real-world dataset with the purpose to automatically recognize the land use of a certain area.
2.5
Data Stream Classification: Deciding when update
the model
Many real world applications continuously generate huge amounts of data, such as web logs, sensor networks, business transactions, etc. These data streams [2], due to the big volumes of information they contain, pose serious issues for the research community in order to extract useful and up-to-date knowledge in real-time. Due to its intrinsic temporal dimension, the infor-mation available in data streams can change and evolve over time. More precisely, this phenomenon impacts on the performance of any supervised (or unsupervised) model learnt over these evolving data: previous mod-els may not be suitable for newly incoming data [2]. Therefore we need to adapt models both quickly and accurately.
2.5.1 Active Learning
Learning predictive models on streaming data implies having continuous access to the true values of the target variable (the true class labels) of every incoming example. This labeling phase is usually an expensive and tedious task for human experts. Consider, for example, textual news arriving as a data stream. The goal is to predict if a news item will be interesting for a given user at a given time. The interests and preferences of the user may change over time. To obtain training data, news items need to be labeled as interesting or not. This requires human labor, which is time consuming and costly. For instance, Amazon Mechanical Turk3 offers a marketplace for intelligent human labeling. Labeling can also be costly or practically unfeasible because it may require expensive, intrusive or destructive labo-ratory tests. The labeling problem in standard machine learning scenario is well known [87] and it is mainly addressed through techniques that guide the construction of the training set by the needs of the predictive models. Such kinds of techniques belong to the family of active learning [26]. To address this important issue in the context of data streams, during the pe-riod spent at the University of Waikato, in collaboration with Prof. Bern-hard Pfahringer and other colleagues, we developed new active learning strategies especially tailored to efficiently learning predictive models on evolving data streams [49,47]. All the proposals we developed are based
2.6. Other Research Activities in Data Science 13
on the idea that important instances to sample lie in a high density partition of the data space. In [49] we instantiate this idea by exploiting clustering approaches in order to estimate the density around each point while in [47] we estimate the density in an online manner, a sliding window mechanism allows to quantify the importance of a point considering the density of its nearest neighbors.
2.5.2 Categorical Change Detection
Due to its intrinsic temporal dimension, the information available in data streams changes and evolves over time. In particular, different types of changes may happen in the stream. For instance, classes or concepts that can be underrepresented during a short period can become overrepresented after a longer period. Most of the time, a common assumption made by many research works is to consider only the aposteriori probability of the class given the data [27,9]. This formulation of the change detection task does not exploit information coming from the underlying data distribution. Another issue is that, in real world applications, data is heterogeneous and often can be represented over set of categorical attributes as well as numeri-cal ones. In the last decade, lots of approaches have been defined to monitor classification accuracy as evidence or an indication for change in streams of numerical data [9] but, few approaches dealing with the same problem for categorical evolving data streams [19]. In [48], we tackle this issue and we propose a new change detection approach devoted to retrieve changes in categorical evolving data streams. The proposed approach detects and highlights changes in categorical data streams in a fully unsupervised set-ting. It works in the batch scenario: when a new batch arrives, firstly the algorithm summarizes the block through some statistics and successively performs a statistical test to evaluate if a change happens in the data distri-bution, or not. The developed algorithm supplies a segmentation approach that can also work with other statistics. This means that it can be coupled with any other measure we want to monitor.
2.6
Other Research Activities in Data Science
During the last years, I devoted a major part of my researches to analyze spatio-temporal data but, in order to enrich my methodological background in the field of data mining and machine learning, we studied, conceived and developed, in partnerships with other colleagues, approaches to manage different kind of data such as textual, categorical and linked open data. The motivation related to these researches is that, a methodology we can apply on textual data (i.e. supervised classification, clustering algorithm, etc.) can be adapted and reused, to some extent, for spatio-temporal data analysis. As example, in the field of multilingual document classification we exper-imented and apply transductive based methods [78] and, successively, we extend and adapt the same strategy to perform active transductive classifi-cation in the context of object oriented Remote Sensing analysis [31]. Study and design general data mining and machine learning methods allows me acquire a good knowledge on how customize each of such strategy w.r.t. the particular domain to investigate.
14 Chapter 2. Contributions in Spatio-Temporal Analysis
2.6.1 Clustering and Co-Clustering Unstructured data
Most of the techniques developed during my PhD training were devoted to unsupervised analysis and in particular to cluster data. During the last years, we continue, with the colleagues I am working with, to conceive and propose new clustering techniques . Most of the proposed techniques were devoted to analyse textual information.
The choice of this source of information as type of data is due to its ubiq-uitous nature and to the fact that it is generally not so difficult to retrieve annotated document collections. The availability of labeled data facilitates the evaluation of the different methods.
As a direct extension of my PhD work, we have developed new co-clustering techniques for dynamic textual sources of information [73] and co-clustering techniques for heterogeneous data [50].In the domain of dy-namic textual data we developed approaches able to incrementally cluster streams of text supplying a hierarchical organisation of such documents. The hierarchical organisation allows to easily explore and browse the con-tent of the evolving document collections. In the same period, we also fo-cused our attention to develop clustering methods that allow the grouping of entities that have an heterogeneous representation. For instance, in [50] we show how entities that can be described, at the same time, by both vi-sual (images) and textual (captions) information can be jointly analysed in an unsupervised way.
Data heterogeneity is an important characteristic of modern sources of information. The same information can be described by different represen-tations or by different media. An example of such heterogeneity, in the field of text analysis, is supplied by multilingual document collections [79] in which the same information can be available in different languages. Dur-ing the co-supervision (with Dr. Andrea Tagarelli) of the PhD Thesis of Dr. Salvatore Romeo, we designed and developed on unsupervised and semi-supervised machine learning framework to analyse multilin-gual document collections [79,78]. To tackle the issue of language hetero-geneity, we leverage knowledge-based resources [69] to obtain a common representation for collection of multilingual documents. Once the new rep-resentation was obtained, we have developed new data mining techniques to automatically categorise multilingual textual information [79]. In the context of multilingual textual clustering we modeled the documents by a tensor representation and we successively factorized such tensor to find a low dimensional embedding of the original data that helps the cluster-ing process. In the context of semi-supervised textual categorization [78] we have employed a graph-based transductive learner to propagate label information from labeled documents (written in a certain language) to un-labaled ones (written in the same or another language). The propagation process supplies the final classification result.
2.6.2 Semi-Supervised Learning in Categorical Data
Supervised and Unsupervised settings, from a machine learning perspec-tive, are two extreme cases in which, from one side, we have labels for all the training data and, from the other side, we do not have class informa-tion for any of the objects we would analyse. In many real world tasks the
2.7. Conclusion 15
situation is less strict and, we can have situation in which only a portion of the data has associated labels. We can image a scenario in which we need to classify home pages vs. non home pages. In this context we have a good knowledge about what is an home page but, strictly define what is not an home page can be difficult. Examples of such scenario are semi-supervised anomaly detection [20] and positive and unlabeled learning [56]. Due to the variety of contexts in which semi-supervised analysis can appear, this is also valid in the context of remote sensing image analysis [31]. More in detail, in [46] we recently proposed a semi-supervised anomaly detec-tion for categorical data where a model is learnt on "normal" data and then the learnt model is employed to rank anomalies entities. For the problem of positive and unlabeled learning, we propose in [45] an ap-proach that firstly computes a model for the positive class, secondly a set of representative examples for the negative class is detected and finally a discriminative model is built considering both positive and negative instances.
The peculiarity of the strategies we proposed is related to the data they manage: all the examples are represented by only categorical variables (any numerical variable can be discretized to obtain a categorical one). The prob-lem to employ distance-based machine learning methods on categorical dataset is related to the notion of distance measure [20]. Unlike numeri-cal attributes, it is difficult to define a distance between pairs of values of a categorical attribute, since the values are not ordered. This underlines the fact that adapt distance-based machine learning methods to manage cate-gorical information is challenging.
2.7
Conclusion
This chapter resumes the major researches I developed in the last years in collaborations with my colleagues. Most of the themes we addressed are related to the design of general data mining and machine learning tech-niques that can be applied on spatio-temporal or complex data. Each of the addressed topic can supply ideas or hints for possible follow-ups. For instance, regarding the study of moving object data, a deeper investigation can be made on how moving object patterns can be summarized and how such results can be presented. In the data stream scenario, a possible point to address could be the study of how coupling active learning and semi-supervised learning or how unsemi-supervised change detection techniques can help unsupervised learning (such as clustering) to extract useful informa-tion from evolving data. Any of the previous macro topics can supply ideas and point out possible research tracks in the domain of spatio-temporal, textual or categorical data analysis.
In the next chapter I will try to sketch some of the research directions I would investigate that are deeply connected to my current research in spatio-temporal data analysis.
17
Chapter 3
Perspectives
This chapter draws perspectives related to my on-going research on spatio-temporal data mining. I would discuss in which direction my research ac-tivities can evolve in the next four, five years. All the perspectives presented in this chapter are related to students I am co-supervising and projects I am involved in.
3.1
Research Objectives
In the last years, from the time I joined the TETIS laboratory, I concentrated my research efforts toward the analysis of dynamic data in which the tem-poral dimension plays a major role. As I discussed in the previous chapter, I studied, designed and developed, with researchers I worked with, new approaches in both pattern mining and machine learning fields to manage, in particular, the temporal dimension present in spatio-temporal databases. The complexity of such data is given by the temporal but also by the spa-tial information it contains. This is why, my next research objectives will focus on increasing my knowledge through the study and the development of methods that explicitly deal with spatial autocorrelation inside the data. My research background ranges from supervised and semi-supervised machine learning methods to cluster analysis, to the design of pattern min-ing approaches to mine and extract knowledge from databases. In the cur-rent data science literature, many methods to manage spatial information already exist [11]. My main objective is to design, develop and implement new approaches development of new approaches to deal with the particu-lar kind of data I am focusing on: Time Series of Remote Sensing Data. To pursue this goal, in the future, the next PhD fellowships I will supervised, they will be focused on the analysis of general spatio-temporal data mining techniques considering the Remote Sensing field as privilegiate domain of application.
The PhD students I am currently co-supervising, are mainly focusing on methods to mine and learn from Remote Sensing (RS) Data. Particularly, the different on-going thesis in which I am involved, they also reflect my differ-ent research backgrounds (pattern mining, cluster analysis and supervised learning).
18 Chapter 3. Perspectives
3.2
Graph-based approaches to analyze spatial
infor-mation
General graph data mining approaches [101, 53, 24] traverse the search space of graph patterns and, once a pattern is generated, test its support. The algorithms can work in a transactional setting [101] (the database is constituted by a collection of graphs) or extract frequent graphs in a single graph setting [53,24] (the database is constituted by only one big graph). The most time consuming and crucial operation in such approaches is the subgraph isomorphism test [15] that allows to retrieve all the embeddings (occurrences) of a graph pattern in the graph database. Multigraph pattern mining seems similar to general graph mining but it has its peculiarity. The main difference relies in the subgraph isomorphism test [90]. During the on-going PhD Thesis of M. Vijay Ingalalli, co-supervised in collaboration with Prof. Pascal Poncelet (LIRMM), we have developed a method to per-form subgraph isomorphism test for multigraph [90]. The next step of this research involves the design and the implementation of a frequent multi-graph mining approach. The approach will leverage techniques and tricks already proposed in the general domain of graph mining but it will intro-duce specific pruning strategies tailored for the multigraph structure.
In the remote sensing context we can take, as a toy example, the ex-traction of complex landscape interactions. Given a satellite image we can easily model the image content as a multigraph. After image segmentation, for each segment we can compute a set of characteristics induced by its ra-diometric attributes. This results in a vector of numerical features. The set of segments is the set of the nodes of the multigraph and two nodes are linked each other if they are spatially adjacent. More in detail, we can have a different edge type for each of the segment’s feature. In this way, an edge of type ti exists between two objects if they are spatially adjacent and they have similar values w.r.t. feature fi. An example of this process is reported in Figure 3.1 where, for the sake of clarity, a geographical area is segmented, numerical features are computed and the mulitgraph is built following the previous strategy. Different edge types are represented by different colors.
Once the image is represented by a multigraph we can extract frequent sub(multi)graphs in order to study how segments spatially interact with each other. Frequent patterns can be used to highlight recurrent landscape interactions. Explicitly considering different type of edges can supply more fine information to experts about the physical phenomenon and what the study area contains. Frequent patterns can be employed directly or they can be used, for instance, to feed statistical simulation process. In environ-mental analysis it is common to design mathematical models to simulate physical and natural evolutions. Build such a model is a time consuming task if we do not know what happens in the area we would study. Frequent sub(multi)graphs patterns can be used to guide the construction of such models.
3.2.1 Select Interesting Multigraph Patterns
Pattern mining methods that only extract frequent patterns can potentially produce a huge number of patterns that can be hardly analyzed by human experts, hence limiting the usefulness of such tools. To cope with this issue,
3.2. Graph-based approaches to analyze spatial information 19
FIGURE 3.1: Example of multigraph representation for a segmented remote sensing image. The different colors
in-dicate different type of edges.
three different families of approaches can be found in literature to extract in-teresting patterns, during the mining algorithm or as post-processing step. This categorization only considers the big trends in the pattern mining field and it does not want to be exhaustive.
The first family of approaches relies on compression-based measures such as MDL [94] or entropy [85]. Such methods filter out only a subset of interesting patterns selecting those ones that better compress the original database or that are unexpected considering their constituents.
The second family of approaches leverages statistical models in order to represent the underlying distribution of the patterns. In this case a null-model is built and patterns that do not fit this null-null-model are selected as interesting due to their exceptionality [86,60].
The third family of approaches always exploit statistical theory but they extract frequent patterns through a stochastic process. More in detail a sam-pling algorithm (usually based on Markov Chain Monte Carlo Methods) is designed and patterns are sampled from the distribution. Sampled patterns are characterized as interesting [77,80,95,39].
In the graph mining field, most of the strategies to extract interesting patterns relie on the third family of approaches.
The first family of methods mainly selects interesting patterns as post-processing. First of all the frequent patterns are generated and then the relevant ones are selected as post-processing. In the case of graph patterns, conceiving and designing compression measures to post-process the set of mined patterns is challenging and more difficult w.r.t. equivalent measures for itemsets or sequences. On the other hand, compressing the original database (or considering if a superpattern is more interesting than a sub-pattern) involves an heavy use of the subgraph isomorphism procedure that can drastically increase the time of such methods.
The second family of methods to filter out interesting patterns needs the construction of a null-model of the data distribution and the null-model is exploited in order to prune the search space. Till now, from the best of my
20 Chapter 3. Perspectives
knowledge, no approaches for graph mining towards this direction exist and, for sure, it will be interesting to understand the feasibility of this strat-egy in the context of multigraph pattern mining. The challenge related to this point are i) the construction of a null-model to represent the topolog-ical structure of the multigraph ii) the design of an efficient algorithm to navigate the search space according to the proposed null-model.
The third family, until now, seems to be more pertinent in the graph mining domain [39]. Probably, it is due to the fact that sampling patterns instead of exhaustively traverse the whole search space drastically decrease the running time and allows graph mining approaches to scale up on big-ger datasets producing a restricted amount of patterns that can be easily investigated by a domain expert.
Concerning the extraction of interesting multigraph patterns, the re-search can address the study of already proposed strategies coming from the last two families of approaches and how to generalize such groups of methods to address the selection of interesting multigraph patterns.
Orthogonally to the selection of interesting patterns, another research direction can be devoted to introducing and designing constrained based pattern mining algorithm especially tailored for multigraph data. More the structure becomes complex (itemset, sequence, graph, multigraph) more constraints we can define in order to filter out patterns that meet such re-quirements [104]. Designing efficient algorithm to manage constraints in multigraph is challenging and it can constitute another fruitful research di-rection.
3.2.2 Multigraph Rules
Another possible research direction can be represented by the study of tech-niques to extract multigraph rules. Similar to association rule mining [21], extract rules on multigraph databases can help to better characterize the information contained in the database and to understand cause-effect re-lationships leveraging frequent patterns. Preliminary works were done in the context of graph mining for evolving graphs [17] and recently, some works suggest to relax the constraints about the topology and, successively, mining node labels that frequently occur near each other [40]. Such rules could also be useful from a database point of view to extract conditional dependencies to summarize and describe multigraph databases.
3.2.3 Approximate Multigraph Mining
Most of the previous follow-ups assume that the sub(multi)graph isomor-phism task performs exact matching. Many times, in real world scenario approximation is necessary in order to deal with possible noise or uncer-tainty present in the data [67,6,82]. Approximation can be performed at in-formation level [6,18] (label of the nodes) or a topological level [103 ](mod-ify the sub isomorphism algorithm to find approximate embeddings). In the multigraph context, one more piece of information to manage will be the presence of multiple edge types that can be modeled as an edge with an associated itemset as label. Depending on which level of approxima-tion we want to deal with, we need to redefine primitive operaapproxima-tions or only data mining algorithms. Logically, redefining primitive operations will take
3.3. Summarize Temporal Evolutions in RS Time Series 21
more time than modifying the graph mining algorithms but, it will allow to acquire more knowledge about the whole graph mining process.
3.2.4 Applications on other domains
The design and the development of multigraph pattern mining approaches is primarily motivated by the abundance of spatio-temporal data that can be modeled as graphs and also by multigraphs. The toy example I sup-plied in Section 3.2 about image analysis through multigraph pattern min-ing is only one example but another example can be the extraction of colo-cation patterns [102] (commonly employed in spatial data mining) from a multigraph that represents how objects are spatially arranged with a more fine-grain description about how they are interconnected. Due to the wide range of databases that can be represented as multigraphs, the proposed perspectives are not only limited to the analysis of spatio-temporal data but they can be beneficial to mine information coming from other domains. Among all the possible domains the previous proposals could affect, the analysis of knowledge graphs seems to be one popular example [70, 100,
59]. Knowledge graphs are structures that supply a network representation of knowledge where the nodes are objects and links between objects rep-resent some kind of relationships. In knowledge graphs, the same pair of nodes can be linked by different edge types resulting in a multigraph struc-ture. Examples of such knowledge graphs are Yago [64], DBPedia [55] and FreeBase [12]. Data Management and Mining techniques able to efficiently deal with multigraph data can be useful to extract information that could be reused by high-level approaches to reason [25] about the underlining knowledge. The same approaches can be employed over other domains in which the multigraph structure can appear such as bioinformatics and social network analysis [10,14].
3.3
Summarize Temporal Evolutions in RS Time
Se-ries
Among the different researches I would pursue, the analysis of time series of remote sensing data still plays an important role supplying interesting scenarios to develop new data mining and machine learning techniques. Due to the new research programs that promise, in the next years, to dras-tically increase the volume of data acquired by satellite sensors, the field of remote sensing time series analysis will probably get more and more at-tention from the research community. Practically, this huge volume of data will pose new challenges in order to be analyzed efficiently [62,63]. This re-search track is currently related to the thesis subject of Mme Lynda Khiali, a PhD student I am co-supervising with Dr. Maguelonne Teisseire (IRSTEA).
3.3.1 Summarize evolutions in RS Time Series
During these researches we would design and implement new methods to study how the entity evolves in remote sensing time series leveraging the graph representation we previously introduced. The work we previ-ously did was related to the analysis of time series of images spanning over
22 Chapter 3. Perspectives
only one year and it was limited to extract as many evolution graphs as the selected reference objects. One extension we would work towards is the summarization of such set of graphs. Among the possible extracted graphs, many of them can represent the same (or similar) information pro-ducing some kinds of redundancy. To address this issue a solution can be the use of clustering techniques [43] with the purpose to summarize the collection of graphs. In order to cluster (and summarize) such kind of in-formation we need to understand how to evaluate the distance between such graphs [81]. This is a fundamental operation in any distance-based data mining approach (i.e. clustering). How to define a suitable distance between graphs is still challenging [81] as it depends from i) the charac-teristics of the graph structure we analyze (labeled vs unlabeled, DAGs vs general graphs, weighted vs unweighted, etc..) and ii) the task we would accomplish (summarization, diversity, indexing, etc...).
Once the distance measure and clustering algorithm are available, some efforts can be made in order to introduce more supervision in the summa-rization process via end-user interactions. Due to my previous experiences, a way to introduce a limited amount of user feedback in the mining process could be the combination of clustering [43,73,79] and active learning [26]. Until now, active learning was mainly exploited in supervised scenarios (classification tasks) but few works start to appear in the literature about how to combine clustering approaches and active learning [26]. Due to the peculiarity of remote sensing data in which spatial and temporal informa-tion plays a crucial role, clustering such kinds of data requires appropriate methods [16] and the active clustering approaches recently proposed [72,
1,98] completely ignore the spatial and temporal dimensions in their sam-pling process. The research track related to active clustering methods for spatio-temporal data is still challenging and it can constitutes, from my point of view, a valuable field of research to investigate in order to supply user-oriented data summarization.
3.3.2 Mining Episodes in Evolution Graphs
During the work we did in [32,33] we worked on time series of remote sens-ing data that spans over one year in order to describe the phenology of the studied area. In the context of climate changes we are interested in follow-ing natural phenomena over ten, twenty years or more. To this purpose, we need to analyze multi-annual time series of remote sensing images. Con-sidering the seasonality of natural phenomena, if we only consider yearly time series, most of the phenomenon appear only once and the technique we have proposed is easily applicable to such scenarios. When the time series involves long periods our approach can have some issues due to the preliminary assumptions it made [32]. In the case of multi-annual time se-ries what we can expect is to find recurrent signals that can reproduce them-selves with some approximation. In the pattern mining field, the study of recurrent events that can appear in a (possibly infinite) sequence of data goes under the name of episode mining [97]. The goal of such techniques is to extract patterns of evolution that can be recurrent along the whole se-quence of data. While in the context of general episode mining, the data arrives sequentially and the stream is produced somewhere else, in the context of multi-annual remote sensing images we can imagine a scenario
3.4. Exploit Spatial Autocorrelation in remote sensing analysis 23
in which, applying the same process we already did in [32], we can build evolution graphs that cover multi-annual time series. Once the evolution graphs are built, successively (or during the construction of graphs), we can identify recurrent substructures that can allow, for instance, to segment the whole sequence of data or summarize again the whole dataset. Applying the graph extraction step on a time series of satellite images results in a set of evolution graphs. Such collections of graphs can be seen as a database to be mined itself. Defining data mining algorithms in order to extract frequent and/or interesting episodes from a database of graph sequences is challenging and needs to consider the particular information that such structures represent (recurrent events, spatial covering, anomaly behavior, etc...).
3.4
Exploit Spatial Autocorrelation in remote sensing
analysis
Another point I am interesting in is related to supervised and semi-supervised learning approaches devoted to classification purposes [66, 45, 46]. In the last period, I started to develop such methods in the context of satellite image classification [74,31]. Automatic classification methods (supervised and semi-supervised ones) are important in the context of remote sensing analysis where an image can contain thousands of pixels and/or thousands of objects to process. Examples are satellite image classification that consid-ers land use or land cover soil classes [74]. Recently, in the field of machine learning, Deep Learning methods stand up from the crowd of classification methods underlining that such strategies are able to heavily outperform state-of-the-art approaches [54]. Among this family of methods, Deep Con-volutional Neural Networks (CNN) show impressive performance in the field of image classification [54] thank to the Convolutional layer that al-lows to capture, to some extent, spatial autocorrelation among the pixels of the image. A classical CNN architecture is reported in Figure 3.2. We can observe different types of layers, the first one represents the input data, then we can note the portion of the network dedicated to the convolutional op-eration and, finally, the last layers represent a fully connected Multi Layer Perceptron that produces the final classification.
3.4.1 Deep Learning in Heterogeneous and Incomplete Data
In 2015 I started to investigate Deep Learning methods and, still in the same year, I started the co-supervision with Dr. Marc Chaumont (LIRMM) and Dr. Gerard Subsol (LIRMM) of the PhD Thesis of M. Lionel Pibre on the "Detection of urban objects from heterogenous remote sensing data sources". This work will be devoted to the use of deep learning techniques on heterogeneous remote sensing data to detect objects ( i.e. trees) in urban areas. As an objective, we would overpass some limitations of standard supervised approaches on heterogenous multi source data.
Standard classification algorithms need a training phase before being employed on new unseen examples (test data). A challenge in this field can be the development of new deep learning architectures to manage heteroge-neous data coming from different sensors (optical sensor, satellite images,
24 Chapter 3. Perspectives image 256 256 F(0) Kernel Filtered image 252 252 Layer 1 64 kernels 7x7 Label=0/1 64 feature maps 127 x 127 R e L U R e L U Layer 2 16 kernels 5x5 16 feature maps 127 x 127 Fully connected layers R e L U R e L U Softmax
Convolutional layers Classification
1000 neurons
1000 neurons
stride 2
FIGURE 3.2: An example of Convolutional Neural Net-work (CNN) architecture with a first fixed Kernel to pre-processing the input image, two convolutional layers to manage image autocorrelation, two fully connected layers to prepare the prediction step and, finally, a SoftMax layer
to perform the final classification.
drone images, Radar images, etc...) in a setting where training and test data cannot fit the same format and, commonly, the test set is poorer (in terms of information) than the training set. In this case we can exploit previous approaches proposed in the field of deep and representational learning [54,
8] in order to obtain some intermediate representation coping with partial information. Such intermediate representation can be obtained employing some kind of autoencoder tool [93]. Successively, the deep learning system can be trained on such intermediate representation and, once a new unseen example is available, first of all it will be transformed employing an autoen-coder and then the transformed instance can be the input of the predictive model to get the final classification.
During the preliminary experiments we conducted, we observed that the results are heavily influenced by the type of activation function em-ployed in a particular layer of the CNN. Studying some kind of adaptive way to choose which activation function could be used in which layer can be useful in general. For instance, instead to use a single activation func-tions [8] (ReLU, eLU, etc...) for each layer, maybe a weighted linear (or not linear) combination of such functions can allow the network to automati-cally learn which one is more suitable at which point of the architecture. All these perspectives can be developed considering as an application scenario the analysis of remote sensing images where, only in the last two years, deep learning approaches started getting increasing attention [61,65].
3.4.2 Deep Learning for image data archives
As well underlined by [54], one of the possible future directions of deep learning is the use of such models in an unsupervised way. Recently, due to the rapid evolution of satellite system, large-scale remote sensing image data archives are more and more available and they need practical tools to organize and retrieve such information. An exhaustive search through linear scan over such archives is really time-consuming and not practically reasonable in real world applications. Recently, [22] proposes an hashing-based scalable remote sensing image search systems to overcome this prob-lem employing kernel methods to hash such images. An interesting point