HAL Id: tel-01668588
https://tel.archives-ouvertes.fr/tel-01668588
Submitted on 20 Dec 2017HAL is a multi-disciplinary open access archive for the deposit and dissemination of sci-entific research documents, whether they are pub-lished or not. The documents may come from teaching and research institutions in France or abroad, or from public or private research centers.
L’archive ouverte pluridisciplinaire HAL, est destinée au dépôt et à la diffusion de documents scientifiques de niveau recherche, publiés ou non, émanant des établissements d’enseignement et de recherche français ou étrangers, des laboratoires publics ou privés.
Alexandru Ciocan
To cite this version:
Alexandru Ciocan. Contributions to energy storage using hybrid systems from alternative energy sources. Thermics [physics.class-ph]. Ecole nationale supérieure Mines-Télécom Atlantique, 2017. English. �NNT : 2017IMTA0028�. �tel-01668588�
Alexandru CIOCAN
Mémoire présenté en vue de l’obtention du
grade de Docteur de L'Ecole nationale supérieure Mines-Télécom Atlantique Bretagne-Pays de la Loire - IMT Atlantique
sous le sceau de l’Université Bretagne Loire École doctorale : Sciences pour l'ingénieur (SPI) Discipline : Energétique, thermique
Spécialité : Génie des procédés
Unité de recherche : Génie des Procédés-Environnement-Agroalimentaire (GEPEA) Soutenue le 17 octobre 2017
Thèse N° : 2017IMTA0028
Mémoire présenté en vue de l’obtention du
sous le sceau de l’Université Bretagne Loire
Contributions aux systèmes de stockage
d’énergie en utilisant des systèmes hybrides à
partir de sources d’énergie alternatives
age d’énergie en
sources d’énergie alternatives
JURY
Rapporteurs : M. Liviu DRUGHEAN, Professeur d’Université Technique de Génie Civil Bucarest M. Said ABBOUDI, Professeur d’Université de Technologie de Belfort-Montbéliard Examinateurs : M. Jean – Felix DURASTANTI, Professeur d’Université Paris Est Créteil
Mme Mariana-Florentina STEFANESCU, Professeur d’Université Politehnica de Bucarest
Invité(s) : M. Valentin APOSTOL, Lecteur d’Université Politehnica de Bucarest Directeur de Thèse : M. Tudor PRISECARU, Professeur d’Université Politehnica de Bucarest Co-directeur de Thèse : M. Mohand TAZEROUT, Professeur d’Ecole des Mines de Nantes
Acknowledgment
There have been many people who have walked alongside me during all these last years. All of them had a special contribution in helping me to complete this Ph.D. thesis, so I would like to express the acknowledgment and to thank those who bear and support me in all this time. First and foremost, I want to give a special thanks to prof. Tudor Prisecaru, from University Politehnica of Bucharest and to prof. Mohand Tazerout, from Ecole des Mines de Nantes, for accepting to be my scientific advisors, for guidance and encouragement all the time and give me a positive attitude and the right direction, without their suggestions and undertaking this project would not have been possible and for all of this, I am deeply grateful.
Next, I would like to express all my consideration to professors: Mariana Stefanescu, Liviu Drughean, Said Abboudi, Valentin Apostol and Jean-Felix Durastanti for having accepted to be members of the jury for the validation of my Ph.D. thesis and for all the remarks they did both in writing and during the presentation itself and a well for all the beautiful words said at the end.
I further extend my gratitude to all professors from the both University Politehnica of Bucharest and Ecole des Mines de Nantes with which I came into contact and helped me with suggestions during my formation. More than that I am hugely indebted to the staff of GEPEA Lab. from Ecole des Mines de Nantes / IMT Atlantique for receiving me in their laboratory and for the constant support that I received in the realization of the experimental part of my work.
My thankfulness goes also to The Embassy of French in Romania who offered the financial support and has done all their best that my internship in France to be in the best conditions. Finally, I want to thank everyone from The National R&D Institute for Cryogenics and Isotopic Technologies - ICSI Ramnicu Valcea for believing in me and for the great work environment and as well for all the support that I have got.
Thank you all! Alexandru
Work’s Summary
The thesis entitled «Contributions to energy storage using hybrid systems from alternative energy sources» proposes a study of the energy storage technologies knowing the fact that these are considered one of the options that can facilitate a high penetration of renewable sources. In this context, the presented work aims to understand challenges in terms of energy storage and to develop a general studying model using compressed air as an energy storage medium. The thesis is structured in ten chapters from which the first four are dedicated to the presentation of the renewable energy sources potential, to the energy sector evolution in the last decades and to the energy storage technologies, especially in the form of compressed air. The other six chapters are dealing with the theoretical thermodynamic calculations as far as that goes in investigating the performances of a hybrid energy storage system and presenting a mathematical model containing the steps taken into account in the renewable energy conversion into mechanical energy, stored in a form of compressed air and later reconverted into electricity. In addition these chapters present experimental data obtained on a laboratory installation which helped in validating the theoretical results obtained following a Matlab simulation, and finally a case study for a small scale application, 30 kWh of energy stored, where is aiming to find an optimal configuration of the whole system in terms of air working pressure, being analyzed from two points of view, technical and economic. The thesis ends with a chapter of general conclusions and indicates that there are still challenges that must be overcome in order to make the energy storage in a form of compressed air a feasible solution from an economic perspective.
Keywords:
Contents
Acknowledgment _________________________________________________________________ 2 Work’s Summary __________________________________________________________________ 3 List of figures _____________________________________________________________________ 8 List of tables ____________________________________________________________________ 12 List of abbreviation _______________________________________________________________ 13 1. Introduction ________________________________________________________________ 14 1.1. Thesis context ___________________________________________________________ 14 1.2. Climate changes _________________________________________________________ 15 1.3. Problematic of the thesis __________________________________________________ 16 1.4. Aims and objectives ______________________________________________________ 17 2. Renewable Energy Sources overview _____________________________________________ 20 2.1. Hydroelectric Power ______________________________________________________ 20 2.2. Solar Power _____________________________________________________________ 21 a. Advantages of solar energy _________________________________________________ 23 b. Disadvantages of solar energy ______________________________________________ 24 2.3. Biomass ________________________________________________________________ 24 2.4. Geothermal Power _______________________________________________________ 24 2.5. Wave and tidal energy ____________________________________________________ 25 2.6. Wind Power _____________________________________________________________ 25 a. Advantages of wind energy_________________________________________________ 27 b. Disadvantages of wind energy ______________________________________________ 27 3. The energy sector evolution ____________________________________________________ 29 3.1. The energy sector evolution by country from 2002 to 2012 _______________________ 29 3.2. France energy context ____________________________________________________ 31 3.3. Romanian energy context __________________________________________________ 33 3.4. Requests needed for a larger integration of RES ________________________________ 34 3.6. Weather conditions ______________________________________________________ 36 3.7. Discussions and Perspectives _______________________________________________ 42 4. Energy storage solutions overview _______________________________________________ 44 4.1. Energy storage solutions ___________________________________________________ 44 4.1.1. Introduction ________________________________________________________ 44 4.2. Compressed air storage ___________________________________________________ 464.2.1. CAES technology _____________________________________________________ 46 4.2.2. Storage vessel characteristics and selections _______________________________ 47
4.2.2.1. A sensitivity study in calculating the material required for an aboveground storage vessel, depending on the volume for certain storage pressure values ___________ 48 4.2.3. Existing power plants _________________________________________________ 52 4.2.4. Other projects in different stages of developing ____________________________ 54 4.3. The principle of Compressed Air Energy Storage ________________________________ 55 4.4. CAES process description __________________________________________________ 56 4.4.1. Isothermal compression/expansion ______________________________________ 57 4.4.2. Adiabatic compression/expansion _______________________________________ 57 4.4.3. Polytropic compression/expansion_______________________________________ 57 4.5. Atmospheric air and its characteristic parameters _______________________________ 58 a. Temperature ____________________________________________________________ 58 b. Density ________________________________________________________________ 59 c. Humidity _______________________________________________________________ 59 d. Specific heat ____________________________________________________________ 60 5. Mathematical modeling of a compressed air energy storage system ____________________ 61 5.1. CAES operating scenarios __________________________________________________ 61 5.1.1. The charging process _________________________________________________ 62 5.1.1.1. Compressor operation for a single stage compression ___________________ 63 5.1.1.2. The work consumed by an air compressor during compression process ______ 64 5.1.1.3. One stage isothermal compression __________________________________ 66 5.1.1.4. One stage adiabatic compression ____________________________________ 67 5.1.1.5. One stage polytropic compression ___________________________________ 68 5.1.1.6. Multi-stage compression __________________________________________ 70 5.1.1.7. Isothermal multi-stage compression _________________________________ 71 5.1.1.8. Adiabatic multi-stage compression ___________________________________ 71 5.1.1.9. Polytropic multi-stage compression __________________________________ 72 5.1.1.10. Compressor features ______________________________________________ 72 5.1.2. The storage process __________________________________________________ 76 5.1.3. The discharging process _______________________________________________ 77 5.1.3.1. Isothermal a single stage expansion __________________________________ 79 5.1.3.2. Adiabatic a single stage expansion ___________________________________ 79 5.1.3.3. Polytropic single stage expansion ____________________________________ 79 5.1.4. Thermal energy storage _______________________________________________ 81
5.1.4.1. Thermal energy storage systems ____________________________________ 83 5.1.4.1.1. Two – Tanks direct storage _________________________________________ 83 5.1.4.1.2. Two – Tanks indirect storage _______________________________________ 83 5.1.4.2. System efficiency ________________________________________________ 84 6. CAES system - simulation in Matlab ______________________________________________ 87 6.1. Simulation and optimization of a CAES system using Matlab tools __________________ 87 7. Experimental set-up representation _____________________________________________ 102 7.1. The air compressor characteristics __________________________________________ 106 7.2. Charging//Discharging valve _______________________________________________ 109 7.3. Pressure regulator _______________________________________________________ 109 7.4. Air engine description ____________________________________________________ 110 7.5. The electric generator ____________________________________________________ 111 7.6. Mass flow meter ________________________________________________________ 112 7.7. Consumers ____________________________________________________________ 112 7.8. Pressure, temperature and humidity sensors _________________________________ 112 7.9. Power meter ProWatt-3 __________________________________________________ 112 7.10. Power AC analyzer Pm 1200 Voltech ______________________________________ 112 7.11. Experimental results ___________________________________________________ 114 8. A case study _______________________________________________________________ 125 8.1. CAES system pre-dimensioning_____________________________________________ 125 8.2. Chapter Conclusions _____________________________________________________ 145 8.3. Storage vessel simulation in ANSYS _________________________________________ 147 9. Energy price and consumption for householders ___________________________________ 151 9.1. Energy market __________________________________________________________ 151 9.2. Cost analysis ___________________________________________________________ 153 9.3. The optimization cost of production ________________________________________ 154 9.4. Determining the objective function _________________________________________ 155 10. Thesis conclusions and perspectives __________________________________________ 175 Limitations of the thesis __________________________________________________________ 178 Original contributions ____________________________________________________________ 179 Bibliography ___________________________________________________________________ 180 List of relevant papers ___________________________________________________________ 189 International and national conferences participation ___________________________________ 191 Annex 1 _______________________________________________________________________ 192
Annex 2 _______________________________________________________________________ 193 Annex 3 _______________________________________________________________________ 194
List of figures
Figure 1 – Illustration of a pumped hydro energy storage system [13] ... 21
Figure 2 – CSP [Source: Concentrating Systems] ... 22
Figure 3 – Vertical axis wind turbine [22] ... 26
Figure 4 – Horizontal axis wind turbine [23]... 26
Figure 5 – A snapshot for the share of energy from renewable sources for the year 2002 [26] ... 29
Figure 6 – A snapshot for the share of energy from renewable sources for the year 2012 [26] ... 30
Figure 7 – Electricity production from all energy sources: France case ... 32
Figure 8 – France interconnection energy sector [28] ... 32
Figure 9 – Electricity production from all energy sources: Romanian case ... 34
Figure 10 – Solar radiation and wind speed map illustration for France and Romania [34], [35] ... 37
Figure 11 – Wind speed illustration during the month of July 2015 ... 38
Figure 12 – Wind speed illustration during the month of February 2015 ... 38
Figure 13 – Solar radiation illustration during the month of July 2015 ... 39
Figure 14 – Solar radiation illustration during the month of February 2015 ... 39
Figure 15 – Wind speed illustration for the first day of July 2015 ... 40
Figure 16 – Wind speed illustration for the first day of February 2015 ... 40
Figure 17 – Solar radiation illustration for the first day of July 2015 ... 41
Figure 18 – Solar radiation illustration for the first day of February 2015... 41
Figure 19 – EST [12] ... 44
Figure 20 – Overview of electricity storage systems [12] ... 45
Figure 21 – Storage tank pre-dimensioning [42] ... 49
Figure 22 – Storage vessel wall thickness ... 50
Figure 23 – Storage vessel raw material required ... 50
Figure 24 – CAES Huntorf power plant with main components 1) compressor, 2) motor/generator, 3) turbine, 4) storage caverns [43], [44] ... 52
Figure 25 – CAES McIntosh power plant [47] ... 53
Figure 26 – Chart of compressor type... 62
Figure 27 – P-V diagram for a theoretical compressor ... 63
Figure 28 – Ideal compression cycle ... 65
Figure 29 – Multi-stage compression with intercoolers P – V diagram ... 70
Figure 30 – Multi-stage compression with intercoolers T – S diagram ... 70
Figure 31 – A counter-flow heat exchanger illustration ... 76
Figure 32 – A single stage expansion process ... 78
Figure 33 – Multi-stage expansion process ... 78
Figure 34 – Thermal energy storage solutions [90]. ... 83
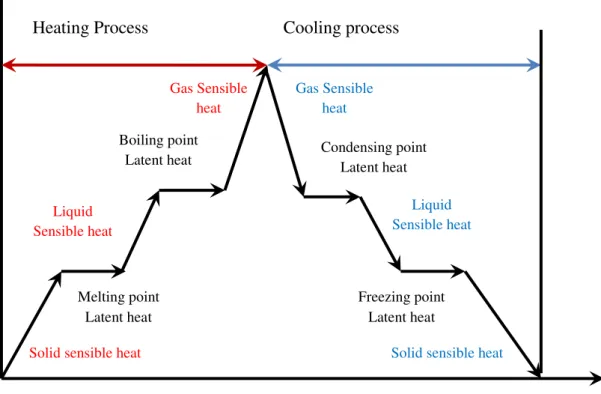
Figure 35 – Sensible and latent representation for different phase transition ... 84
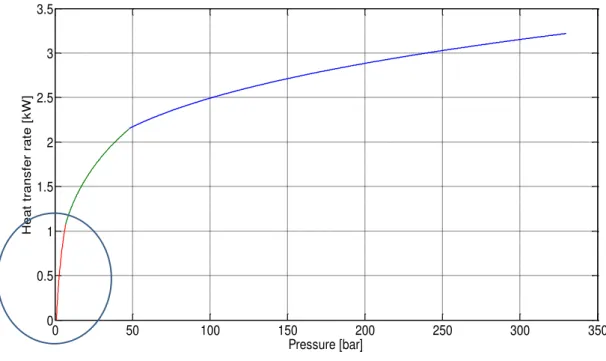
Figure 37 – Diagram for the heat transfer rate variation during a single stage compression -
adiabatic process ... 89
Figure 38 – The total heat variation during a multi-stage compression for an adiabatic process ... 90
Figure 39 – The heat variation during a single stage adiabatic compression for a compressor with three identical stage compression ... 90
Figure 40 – Temperature variation for a multi-stage compression process ... 91
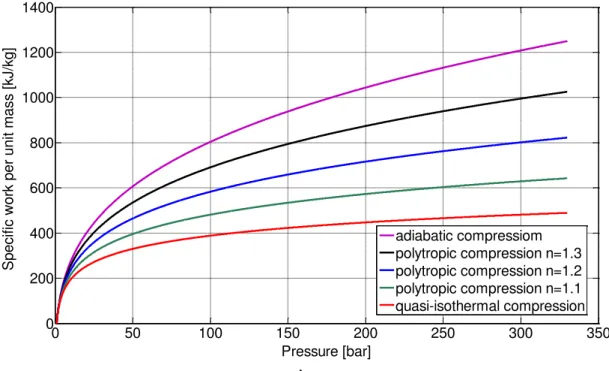
Figure 41 – Representation of specific work per unit mass function of pressure for a single stage compression ... 92
Figure 42 – Representation of specific work per unit mass function of pressure for multi-stage compression ... 92
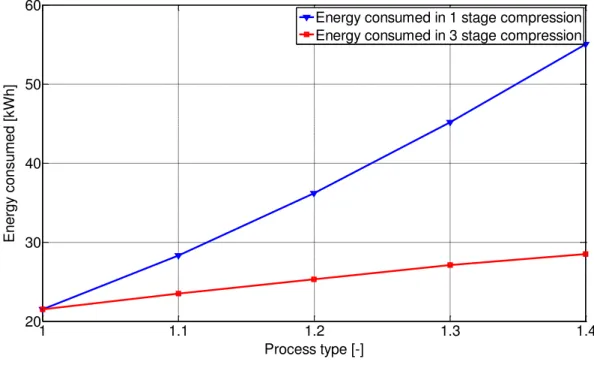
Figure 43 – Energy required to fulfill the storage bootless in 1 and 3 stage compression ... 93
Figure 44 – Diagram for a single stages expansion ... 94
Figure 45 – Temperature variation for a single stage expansion ... 95
Figure 46 – Temperature variation for three-stage expansion ... 96
Figure 47 – Graphical representation of efficiency function of input expander pressure - adiabatic process ... 97
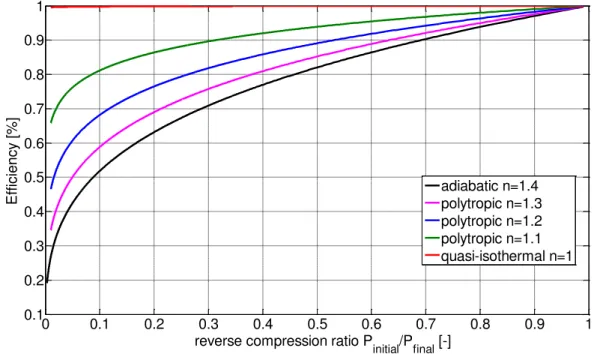
Figure 48 – The addiction of the cycle efficiency by the compression ratio and the polytropic index ... 98
Figure 49 – Thermal energy storage system ... 99
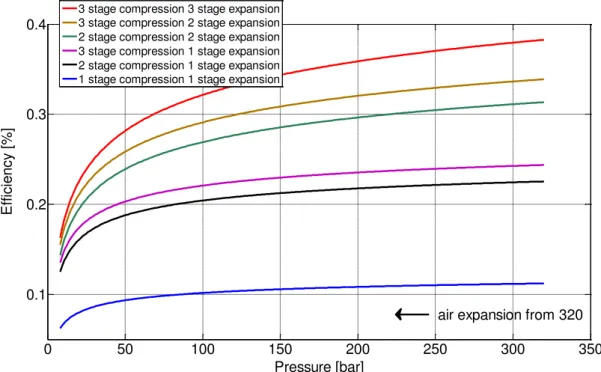
Figure 50 – System efficiency for different scenarios ... 100
Figure 51 – The time required for charging the tank depending by the thermodynamic compression process ... 100
Figure 52 – Compression phase experimental set-up ... 102
Figure 53 – Expansion phase theoretical set-up ... 103
Figure 54 – Expansion phase experimental set-up ... 103
Figure 55 – The graphics interface in LabVIEW for the automatization part ... 104
Figure 56 – Compressor side view ... 105
Figure 57 – Storage vessel side view ... 105
Figure 58 – Air engine side view ... 105
Figure 59 – Compressor block IK120, front view [Source: user manual manufacturer] ... 106
Figure 60 – Pressure and temperature cylinder monitoring ... 108
Figure 61 – Compressor schematic representation [Scubaengineer.com] ... 108
Figure 62 – Illustration of a pressure regulator showing forces acting on the individual elements [93] ... 109
Figure 63 – The RM 110 air engine performance [Source GLOBE Airmotors] ... 111
Figure 64 –The air temperature into the tank variation during the charging process ... 114
Figure 65 – The air mass flow succeed variation during compression process ... 114
Figure 66 – The air pressure evolution after each stage of compression ... 115
Figure 67 – Experimental measurements of temperature before and after each stage of compression ... 115
Figure 68 –The power consumed by compressor during compression process... 116
Figure 70 – Theoretical value for the energy unused by using the throttled valve in the case in
which the air is not pre-heated before expansion process... 118
Figure 71 – Theoretical value for the energy unused by using the throttled valve in the case in which the air is pre-heated before expansion process ... 118
Figure 72 – Specific work per unit mass variation during a single stage expansion ... 119
Figure 73 – Theoretical value for the energy unused by using the throttled valve in the case of Huntorf Power Plant ... 120
Figure 74 – The air temperature variation before and after the control valve ... 120
Figure 75 – The air temperature values at the output of the control valve and at the input air engine ... 121
Figure 76 – The air temperature before and after the air engine ... 122
Figure 77 – Pressure value before and after the air engine during expansion process ... 122
Figure 78 – Pressure and mass flow rate evolution during discharging process ... 123
Figure 79 – Power and pressure evolution in time during discharging process ... 123
Figure 80 – The value of the power generated and the cold resulted ... 124
Figure 81 – Figure representing a hybrid energy storage system from RES with the capabilities to supply energy in cogeneration ... 126
Figure 82 – Figure representing a hybrid energy storage system from RES with the capabilities to supply three types of energy ... 127
Figure 83 – Storage vessel volume required function of pressure: 1 stage compression – 1 stage expansion without preheated air ... 131
Figure 84 – Storage vessel volume required function of pressure: 2 stage compression – 1 stage expansion without preheated air ... 132
Figure 85 – Storage vessel volume required function of pressure: 1 stage compression – 1 stage expansion with preheated air ... 133
Figure 86 – The mass of air required to be stored function of the air engine inlet temperature ... 134
Figure 87 – The storage vessel volume required function of pressure: 2 stage compression – 1 stage expansion with preheated air ... 135
Figure 88 – The mass of air required to be stored function of the air engine inlet temperature ... 136
Figure 89 – The storage vessel volume required function of pressure: 2 stage compression – 2 stage expansion with preheated air ... 137
Figure 90 – The mass of air required to be stored function of air engine inlet temperature .. 137
Figure 91 – The storage vessel volume required function of pressure 1 stage compression – 1 stage expansion without preheated air ... 139
Figure 92 – The storage vessel volume required function of pressure: 2 stage compression – 1 stage expansion without preheated air ... 140
Figure 93 – The storage vessel volume required function of pressure 1 stage compression – 1 stage expansion with preheated air ... 140
Figure 94 – The mass of air required to be stored function of air engine inlet temperature .. 141
Figure 95 – The storage vessel volume required function of pressure: 2 stage compression – 1 stage expansion without preheated air ... 142
Figure 97 – The storage vessel volume required function of pressure: 2 stage compression – 2
stage expansion without preheated air ... 143
Figure 98 – The storage vessel volume required function of pressure ... 144
Figure 99 – Storage vessel ANSYS simulation ... 149
Figure 100 – Average electricity consumption per electrified households, data processed from [95] ... 151
Figure 101 – Electricity price households, data processed from [96]... 152
Figure 102 – Price per kWh for natural gas, data processed from [96] ... 152
Figure 103 – Equipment costs in percentage for the pilot installation ... 154
Figure 104 – System primary efficiency ... 160
Figure 105 – Energy required from renewable sources ... 160
Figure 106 – Air temperature resulted after compression ... 161
Figure 107 – Heat resulted during air compression ... 161
Figure 108 – Outlet air engine temperature variation function of number of stages and the inlet air engine pressure ... 162
Figure 109 – Cold resulted during air expansion ... 162
Figure 110 – Cost for the equipment which converts renewable energy into electricity ... 163
Figure 111 – Compressors cost ... 163
Figure 112 – Storage vessel cost ... 164
Figure 113 – Storage vessel volume ... 164
Figure 114 – Expanders cost ... 165
Figure 115 – System capital cost ... 165
Figure 116 – Objective function determination to obtain 30 kWh energy with air stored a 300 bar and expanded from 30 bar function of number of stages ... 172
Figure 117 – Objective function determination to obtain 30 kWh energy with air stored a 300 bar and expanded from 60 bar function of number of stages ... 172
Figure 118 – Objective function determination to obtain 30 kWh energy with air stored a 60 bar and expanded from 30 bar function of number of stages ... 173
Figure 119 – Objective function determination to obtain 30 kWh energy with air stored a 120 bar and expanded from 60 bar function of number of stages ... 173
List of tables
Table 1 – List of the largest energy storage project at the level of 2015 [centralized data from
Wikipedia]... 45
Table 2 – Data summarizing table with existing power plants [43], [48]... 54
Table 3 – Gaseous Composition of dry air [75]. ... 58
Table 4 – A list of solid and liquid materials used for sensible heat storage [88]. ... 82
Table 5 – Summary of processes for perfect gas ... 86
Table 6 – Initial conditions ... 87
Table 7 – Results obtained for polytropic experimental compression ... 89
Table 8 – The amount of energy consumed for a complete charge of the tank ... 93
Table 9 – Results obtained for isentropic expansion ... 94
Table 10 – Storage parameters function of the operating conditions ... 128
Table 11 – Storage parameters function of the operating conditions ... 129
Table 12 – Storage parameters function of the operating conditions ... 130
Table 13 – Comparison between CAES and AA-CAES system ... 153
Table 14 – Storage vessel dimension ... 156
Table 15 – System efficiency ... 156
Table 16 – Price for the equipment which convert into electricity renewable energy ... 157
Table 17 – Price for the air compressor ... 157
Table 18 – Price for the storage vessel ... 158
Table 19 – Price for the air expander ... 158
Table 20 – System capital cost... 159
Table 21 – The objective function determination to obtain 30 kWh energy with 300 bar storage pressure and 30 bar air expanded inlet pressure ... 168
Table 22 – The objective function determination to obtain 30 kWh energy with 60 bar storage pressure and 30 bar air expanded inlet pressure ... 169
Table 23 – The objective function determination to obtain 30 kWh energy with 300 bar storage pressure and 60 bar air expanded inlet pressure ... 170
Table 24 – The objective function determination to obtain 30 kWh energy with 120 bar storage pressure and 60 bar air expanded inlet pressure ... 171
List of abbreviation
AA-CAES Adiabatic Advanced Compressed Air Energy Storage
ANRE Romanian Energy Regulatory Authority
CAES Compressed Air Energy Storage
CCGT Combined-Cycle Gas Turbine
COP21 The 21st Conference of Parties
CSP Concentrated Solar Power
DSM Demand Side Management
EU European Union
EST Electricity Storage Technologies
GHG Greenhouse Gas Emissions
GW Gigawatt
HE Heat Exchanger
HP High Pressure
IEA International Energy Agency
kJ Kilojoule kg Kilogram K Kelvin kWh Kilowatt-hour LP Low Pressure MW Megawatt PV Photovoltaic Cells
PHES Pumped Hydroelectric Energy Storage
RES Renewable Energy Sources
1. Introduction
1.1. Thesis context
In the last two decades, major changes have been seen in the way in which scientific community and the decision factors have seen the future of the energy sector. Over the years there have been several scenarios prediction for the main fossil fuel as is going to run out somewhere to the end of this century, considering the known reserves and the fact that is just a matter of time when they run out, not if [1]. Even if some new reserves will be found, and help to extend the deadline those reserves that will be discovered will be significantly smaller than that discovered in the past. Obviously, it’s well known that fossil fuel doesn’t represent a viable option and will be less and less used, and the fact that renewable energy sources will get an increasingly higher attention.
The interest in energy storage is currently increasing, especially in order to integrate the renewable energy sources to the grid and to satisfy consumers’ demands directly. Renewable energy has great significance in the security of energy supply and can be used in the conservation of fuel, especially as raw materials in thermal power plants or for the road, rail, maritime and air transport.
The biggest challenge with renewable energy is represented by their intermittent nature. Referring only to solar and wind energy, those generate electric power only when the sun is shining or the wind is blowing. The ways of storing energy for use on windless or sunless periods must be found and must go up by the principle “you take when you can get it” [2]. How to manage the RES fluctuating problem is the key issue of the development and utilization of energy storage in the near future [3].
An important point underlying the integration and use of renewable sources is represented by the necessity of reducing greenhouse gas emissions, given the fact that an important part of contaminant released, represents the effect of the production processes of electricity and heat from the thermal power plants (SO2, NO2, CO2, dust, slag, ash and thermal pollution).
A number of initiatives were taken globally with time thus in March 2007 the European Union adopted a new policy regarding renewable energy target setting to obtain at least 20% of EU energy needs from renewable sources by 2020. To achieve this goal the European Union
Commission has developed a series of new directives for the energy industry and public constructions and private procedures. Among them we can include here: reducing greenhouse emission (GHG) by 20% until 2020 in comparison with years ’90, increasing the share of renewable energy (RES) to 20% of its energy sources by 2020, and reduction of the global primary consumption by 20% until 2020. Having these objectives summarized, the program was called 20-20-20% [4]. Later in 2012, a new directive comes to support the projection made in 2007 and to assume once more the targets for primary energy consumption by 2020 [5].
1.2. Climate changes
The global warming represents another starting point in which the renewable sources would be an ideal solution for reducing electricity consumption derived from fossil fuel. In literature, it was agreed that the greenhouse gas emission represents the main cause of the global warming. To meet all these needs and to prevent the global warming the European Union launched a series of projects aimed to define a new direction in research and innovations, among other with the scope of reducing the global warming. The last big project launched in 2014 is “Horizon 2020”, and once with it, the purpose assumed by European Union Commission in 2007 that the global average temperature can grow up to a limited value of 2°C compared with the average of the pre-industrial era was reinforced. This could happen by limiting the concentration of greenhouse gases in the atmosphere to approximately 450 parts per million of CO2 [6], [7], [8].
Later in 2015 European Union comes with a series of new policies to support the integration of RES, and at the same time to reduce the dependency of fossil fuel with the final target to reduce CO2 emissions. A large number of countries signed in December 2015 at COP21
Summit, held in Paris, a new document which gives new directions in climate and energy policies, having the goal to reduce the greenhouse gas emissions and consequently the climate warming with 1.5°C until the end of 2030. Another target has been to reduce the oil imports from the Middle East.
Although earlier in 2010 a first document called “Energy 2020: A strategy for competitive, sustainable and secure energy” strengthened the same objectives imposed in 2007 a reduction of 20% of GHG and an increasing with 20% of the renewable source in the share of the energy mix. At the level of 2016, the results are encouraging being countries that reached already the
assumptions for the year 2020. Anyway, the new target of European Commission was fixed for Energy Roadmap 2030 where it is wanted to reduce GHG with 40% compared with the years ’90, which means that renewable energy source has to represent at least 27% from the energy mix.
1.3. Problematic of the thesis
It is well known that the renewable energy presents two main characteristics which make them ideal as energy sources production, these are inexhaustible sources and are friendly with the environment as long as don’t produce waste materials and are not polluting.
However there are some inconveniences in terms of renewable energy, particularly solar and wind energy depends on the weather conditions, their behavior varies not only hourly, but seasonally as well, and in this conditions, they are not always available when are needed. Taking into consideration the fluctuating nature of the renewable energy, storages systems are required to adapt the supply and demand and to increase their economic value. As an example, there are periods when wind turbines connected directly to the grid often produce power at off-peak times and sometimes their operation has to be managed in such way that there should not be a surplus of energy in the grid when it’s not needed.
In the electricity systems, supply and demand have to be balanced in real time. To do that any electricity system requires enough power plants to meet the maximum electricity demand. Therefore the electricity demand has a fluctuating nature during a day, a week, or a year, and to avoid any difficulties that might appear for those periods then a flexible system with a faster response to the electricity system requires is mandatory. Pumped Hydroelectric Energy Storage (PHES), Compressed Air Energy Storage (CAES), the combined-cycle gas turbine (CCGT) have been used over the time to balance the electricity system, but once with the integration at a large scale and direct connection of the renewable sources to the electricity system these seem not being enough. A larger increase in the number of cycle starts-stops conducts in decreasing the efficiency of the conventional power plants and leads to a more rapid wear.
Why is energy storage important?
For valorization of excess renewable energy with their intermittent nature. To meet energy supply with demand.
To provide assured power capacity for difficult conditions of wind and sun. For non-optimal use of RES electricity and loss of value.
To increase the grid stability if the system is connected to it. To provide energy to remote areas.
From an economic perspective.
For the isolated locations of residence, energy storage may be easily obtained and could be more economical than grid extension, considering a long distance from the existing grid to the end users site.
Normally load leveling is initially based on the prediction of daily and seasonal needs, and the storage necessity appears when in any periods this production is not enough to satisfy the consumers’ necessity. It is recognized that renewable sources connected directly to the grid have a significant impact due to their fluctuating nature, increasing then the difficulty in stabilizing network and playing an important role in predictions that follow to be done.
1.4. Aims and objectives
Energy storage is one of the main challenges in order to meet renewable energy technologies due to their intermittent nature. So, the approach of the thesis is to realize contributions, to illustrate if the compressed air energy storage system can become a viable technical and economic solution or not in energy storage field.
It should be mentioned from the very beginning that the theme imposed in the thesis was to address to the applications that propose small-scale energy storage systems, mainly focusing the attention on the energy stored in a form of compressed air.
CAES is not a simple energy storage system like batteries or super-capacitors because it involves during the process of converting electrical energy into mechanical form an important heat transfer. The global analysis of these systems should be realized taking into consideration all these aspects referring to the heat transfer.
Objectives:
Developing a general model of study for a compressed air energy storage system. Understanding challenges in using compressed air as an energy storage medium. Achieving a comprehensive bibliographic study of the mathematical model in the
domain of energy storage, especially as compressed air.
Understanding the potential role of compressed air energy storage compared to other energy storage concepts.
Understanding theoretical and practical involves of the thermodynamics of compressed air system.
Finding of suitable heat storage solution.
Developing an operable, safe and economic system.
CAES systems is the second major bulk energy storage technology, after pumped hydro energy storage (PHES), where a gas is compressed (usually air) to high pressure (tens maybe hundreds of bars) and injected into an underground structure (cavern, aquifer, abandoned mine and so on) discussing to a large scale, or to above ground tanks considering a smaller scale. In a CAES system to generate electricity the air is mixed with additional fuel, usually, natural gas burned and expanded through a conventional gas turbine which runs a generator. Besides this conventional technology called “diabatic CAES” there exist other advanced CAES concepts called “advanced adiabatic CAES”. The AA-CAES concept differs from the conventional CAES in that it functions without the combustion of natural gas. This solution requires that the thermal energy resulted from the compression process to be stored in a thermal energy storage system (TES) and used later during expansion process to re-heat the air before entering in the gas turbine. If the heat resulted from compression is used in other purposes, and not to re-heat the air during expansion, then a significant amount of cold will result, and three types of energy: electricity, hot and cold obtained can be considered, and the system became a “trigeneration” one, satisfying at the same time several consumers’ needs [9]. In order to avoid the fuel consumption which is a basic element in conventional CAES, known been the dependency of that, an alternative storage system free-fuel is presented in this work. Two scenarios are analyzed, first when the heat is used for purposes as: domestically water heating, heating of the buildings and so on, and the second scenario considered is when the heat is used to re-heat the compressed air before being expanded through an expander.
The main interest in this work is focused on the newest CAES technology which involves an advanced adiabatic system. Three types of energy could be obtained and the best solution for optimization and management of primary energy will be sought.
2. Renewable Energy Sources overview
The renewable energy development as a global and clean energy is one of the main objectives of worldwide energy policy which in the context of sustainable development aims to reduce the fossil fuel consumption, to reduce the greenhouse emissions and to develop new viable technologies in energy production [10], [11].
2.1. Hydroelectric Power
The hydroelectric power plant is the most mature technology used in energy storage and production from renewable energy sources. The process is simple and consists in a dam which is built across to a river to retain water in order to be used during the peak-on hours. The capacity of a hydroelectric power plant is incomparable with the capacity of any other powers plant which uses any other form of renewable energy. The biggest Power Plant in our days is Three Gorges Dam in China with a capacity of 22,500 MW. The operating principle consists in the fact that the captured water of rivers by hydro plants is transformed into mechanical energy of rotation through an impeller. The rotation speed being the result of the mass flow rate and the water intake.
The state-of-the-art for this technology is by far the method where a large amount of water is stored in an upper reservoir for later use. During the off-peak hours, usually during the night periods when the price is low or when there is a surplus of energy in the grid, the water from the lower reservoir is pumped into the upper reservoir. This kind of technology is economically attractive, the only constraint which makes it difficult for use at a wide scale is represented by the geological conditions for both reservoirs. According to Zach et al [12] pumped hydro energy storage can be classified into three types of systems:
In a closed-loop when both reservoirs connected to the river are artificially built. In a semi open-loop when just one reservoir is artificially built, the other being built on
the natural flow of the river.
In an open system when both reservoirs are in the natural flow of the river.
Hydropower is the leading renewable electricity generation technology worldwide. In 2012 IEA presented a “Technology Roadmap: Hydropower” report where has been described that at
that moment of time Hydropower has the capacity to generate more electricity than all other renewables combined. Hydroelectricity’s many advantages include reliability, proven technology, large-scale capacity, low operating cost.
Figure 1 – Illustration of a pumped hydro energy storage system [13]
2.2. Solar Power
It is the power produced by collecting sunlight and converting into electricity. This thing can be done in two ways. By using solar panels made by many individual solar cells following the photoelectric effect or by using solar radiation to heat water capable of driving a steam turbine. It is well known that the sun provides enough energy in one minute to supply the world’s energy needs for one year [14].
The photovoltaic panels allow the conversion of 10-15% of the solar power into electricity. The energy produced by such a panels vary once with the increase or decrease of solar radiation.
Photovoltaic cells
Photovoltaic cells represent the most mature technology that converts solar energy into electricity. During the years The International Energy Agency has proposed several projects in order to understand the role of photovoltaic solar energy as a cornerstone in the transition to sustainable energy systems.
At the end of 2015 the global PV market measures at least 227.1 GW, 48.1 GW being installed all over the world only in 2015 compared to 38.7 GW in 2014 [15]. From this installed power just in 2015, China holds 15.2 GW, while Japan 11 GW and USA 7.3 GW, UK 3.51 GW, India 2 GW. Not less than 22 countries have passed at the end of 2015 over 1 GW of cumulative PV systems capacity. In the top 10 countries on the PV market, we can count countries like: China, Japan, India from Asia, Germany, Italy and France from Europe, the USA and Canada from North America, South Africa from Africa and Australia from Pacific zone [15].
Concentrated Solar Power
Figure 2 – CSP [Source: Concentrating Systems]
Concentrated solar power is one of the newest solutions used to convert solar energy first in thermal energy and later in electrical energy. Thermal energy generated by CSP produces no greenhouse gas emission, so it could be a key technology for minimizing climate changes. In 2014 only United States and India added facilities to their grids while in Northern Africa’s countries, Spain and South Africa have met stagnation. A year before, in 2013, the largest parabolic trough plant was committed in Arizona having the capacity to supply electricity for about 70,000 homes and use the equivalent of water for about 4,000 homes at a capacity of 280 MW. Also in the USA, it was committed in the same year, 2013, the largest solar Tower System – Ivanpah Plants in California with a capacity of 377 MW capable to supply enough energy to
140,000 homes during peak hours of the day. The project had the target to reduce carbon dioxide emissions by more than 400,000 tons annually [16].
Another technology used is dish Stirling Systems. These systems are using instead of water a small amount of gas to drive a piston of a Stirling engine to produce mechanical power. Until 2013 Infinia was one of the most important players on the market in the implementation of the solar concentrators [17], [18].
Anyway, during the course of the year 2014, the global capacity grew up with 27% to a value nearly 44 GW due to the implementation of four new projects.
There are several types of engines capable to transform thermal energy into mechanical energy. The most commune heat engines used are those with combustion, gas turbine, piston engines or installation based on Rankine cycle with steam water. Unfortunately, none of this engine is capable to valorize renewable energy sources (as solar or biomass). Meanwhile hot air engines, with external heat input, and engines which realize alternatively compression and expansion are capable to valorize renewable energy.
One of this hot air engines is Stirling engine invented by Robert Stirling and patented in 1816. In the sustainable development Stirling engine is considered a serious alternative and an efficient solution in the conversion of renewable energy into mechanical work, with a yield theoretic equal to that of Carnot cycle.
a. Advantages of solar energy
Like wind energy, solar energy is a clean and renewable source, which causes no pollution. However solar collectors and other additional equipment for solar systems are manufactured in factories that in change causes some pollution. Once a solar panel, a solar concentrator or a solar tower is installed, solar energy can be produced free of charge.
Solar systems are very attractive due to the fact that is needed a very little maintenance to keep them running and they don’t produce any noise while wind turbines do.
Solar energy can be used in a remote area where is too expensive to extend the electricity power grid. As a particular example could help in the development of countries from the so-called 3rd
Solar power technology is in a continuous improvement in the last years, and people have begun to understand all the benefits offered by this. The decline of oil reserve forces them to turn their attention to alternative energy sources.
b. Disadvantages of solar energy
The main disadvantage of solar power is that it cannot be produced during the night, and the power generated is reduced during the clouds cover too. Electricity generation depends entirely by location that has been chosen in such way to have maximum exposure to sunlight.
As compared with wind turbines that need just a small piece of land for installation, solar cells or solar towers even solar concentrators require an important area of land to capture sun’s energy.
From an economic point of view, the initial cost of purchasing a solar system is fairly high. Although many European countries have introduced some schemes for encouraging the adoption of renewable energy sources these still remain at a high price. Speaking only about photovoltaic cells these are in a constant development, so it is good to assume that the price will go down in the near future.
2.3. Biomass
It represents the fuel which is developed from organic materials as forest flow, certain crops, manure and some types of waste residues. The most used form to produce energy from biomass is by burning wood to produce steam which runs a turbine or it’s burned to provide heat. In the case of biomass should be mentioned that the renewable energy is not necessarily clean. By burning biomass, an important quantity of CO2 is released into the environment, but this is
significantly less than that produced by burning fossil fuel.
2.4. Geothermal Power
It represents the thermal energy contained in the earth. This heat can be used as an energy source in many ways, from large power stations to small pumping systems. In 2015 worldwide geothermal power capacity amounts 12.8 GW, of which 3.5 GW are installed in the United
States. At the end of 2020, the share of geothermal energy on the global market is expected to be somewhere between 14.5 GW and 17.6 GW. The value of 12.8 GW is spread across the world as 568 MW are installed in Asia, 563 MW in Central America, 15 MW in Caribbean, 563 MW in Central America, 2,178 MW in Europe, 611 MW in Middle East/Africa, 3,548 in North America, 364 MW in South America and 4,318 MW in South Pacific [19].
2.5. Wave and tidal energy
Wave energy is the power drawn by the waves. When the wind blows across the sea or the ocean surfaces its energy is transferred to the wave. The energy output is measured in function of wave speed, height, and length and water density. The ocean covers approximately 70% of Earth’s surface and for sure could have a major contribution to the world’s electricity needs. The same predictions say that once it becomes a mature technology, wave energy could meet 10% of the European Union power demand by 2050 [20]. Assessments of the global wave energy potential show that the most promising location for wave energy production is for countries like Australia, New Zeeland, South Africa, Chile, Great Britain, Ireland and the USA having an average power density of 40 - 60 kW/m [21].
2.6. Wind Power
Wind turbines work by converting the kinetic energy of the wind first in the rotational kinetic energy in the turbine and then in electrical energy that can be supplied based on the final purpose. The energy available for conversion depends on the wind speed and the swept area of the wind turbine. When a wind turbine follows to be installed is important to be known the expected power and some maps for the wind speed should be considered in order to design a turbine capable to deliver the expected power.
The wind turbine can have different orientations, horizontal axis design or vertical axis design, but the way how the power is calculated remains the same.
Figure 3 – Vertical axis wind turbine [22]
Figure 4 – Horizontal axis wind turbine [23]
The kinetic energy is the energy of motion, no matter, if it’s horizontal or vertical motion an object which has motion has kinetic energy.
Wind energy is one of the most rapidly growing renewable sources of energy due to the fact that hasn’t negatively impact on the environment. To meet an increasing demand wind turbines are being scaled up both in size and power rating. Over the years the size of wind turbines increases drastically from the level of watts at the beginning of 90’ years until the level of megawatts in our days. In terms of size wind turbines can be divided into two categories as: small and large wind turbines. Small wind turbines have rotor diameter ranging up to 8 meters, and the power is up to 100 kW. Large wind turbines range from 100 kW up to units of MW. The largest wind turbine at the level of the 2014 year is V164 with a power of 8 MW a prototype at the Danish National Test Center for Large Wind Turbines in Osterild, having a diameter of 164 meter and a tower height of 140 meters [24].
Functional characteristics of the wind turbines:
All the wind turbines, regardless their constructive mode, follow the same functional characteristics in terms of starting, rated and cut-out speed and as well cut power generation.
Starting speed (cut-in speed) – is the minimum speed of the wind at which the wind turbine starts to generate power. This value is usually located between 3 and 5 m/s. Rated speed – represents the minimum speed of the wind for which the wind turbine
generates his rated power. This value is usually located between 10 and 15 m/s. For any values between the starting and the rated speed, it’s generated a power proportional to
those values. Once the value of rated power is overrated the power cut is limited by its rated power.
Cut-out speed – At high values of wind speed usually higher than 22 m/s, most of the wind turbines stop producing energy. The speed at which this thing happens is called cut-out speed and its role is to protect the integrity of the wind turbine. There are several ways in which the wind turbine can stop by an automatic brake which is activated by a sensor that detect the wind speed, by bringing the blades into a position that prevent them longer move, or by using same flaps on the rotor which are activated when a fixed limit is exceeded at high speed and repositions the wind turbine so as not being in the flow of wind.a. Advantages of wind energy
The wind is a clean source of energy which has no impact on the air polluting. Wind turbines do not produce any atmospheric emissions, like power plants which consume fossil fuel and so emit a series of gasses with greenhouse emissions when producing electricity. The wind turbine construction can be very tall, and the land below can still be used, especially in the agricultural areas.
As well, represents a very good solution for remote areas that are not connected to the electrical power grid, and wind turbines can be used to produce their own supply. As long as wind turbines are available in a very large range of size starting from watts to megawatts making them usable for householders or businesses.
b. Disadvantages of wind energy
The main disadvantage is given by the intermittent nature of wind. The energy provided by a wind turbine depends by the wind blowing. The fact that the most of the time the wind turbine cannot generate energy when is needed, and in many other cases it generates energy when it’s not really needed then a storage system makes the wind energy more valuable.
From an economic point of view sometimes wind power can be expensive due to the fact that the higher power demand is in the big cities and wind farms producing an important amount of energy are difficult to be built in such locations. Therefore the site of wind turbines has to be
outside of the cities and an important investment follows to be done into the line transmission of electricity.
Another obstacle that stays in the front of the building of wind turbines in the cities is due to the noise that their rotor blades produce. Many times wind turbines are suitable only for a private region with coastal regions or hilly areas. The location of a wind power system is crucial because has to determine the best weather conditions, best transmission ways and to offer the greatest possible comfort to the people nearby.
Taking a look at what is happening in France and Romania in the last years could be seen that the wind power production increased in France from the level of 3,577MW in 2008 to 10,200MW in 2015 while in Romania increased from 3MW in 2008 to 3,020MW in 2014 [25].
3. The energy sector evolution
3.1. The energy sector evolution by country from 2002 to 2012
If at the end of the 20th century the energy sector was almost covered by fossil fuel, in the lastdecade renewable energy started to have an increasing impact at its level all over the world. A report of U.S Energy Information Administration shows the penetration rate of non-carbon source incensement in European Union countries and the USA at the level of 2012 reporting their level at the year 2002. The same report said that eighteen countries from the European Union generate at least one-third of their generation power from non-carbon sources in 2002. Even if the wind turbine and photovoltaic panels had a fast development in the last years especially in countries like Germany or in Nordic countries their impact still remain at low level. However, almost all countries make that the intakes of energy from renewable energy sources to be one in constantly increasing.
Figure 6 – A snapshot for the share of energy from renewable sources for the year 2012 [26]
Countries like Iceland, Switzerland, Norway, Sweden and France generate at least 90% of their net electricity from non-carbon source since 2002. Besides these Austria, Slovakia, Finland, Belgium, Slovenia, Denmark, Spain and Hungary accounted at least 50% of their generation. According to the graphs, if in 2002 the most share of the renewable energy is covered by nuclear and hydroelectric sources at the level of the year 2012 wind energy and biomass succeeded in creating important portfolios.
The EU commitment in reducing greenhouse gas emission to 80-90% below 1990 level by 2050, so, purpose new directions to be followed for investors, governments and citizens in realizing a roadmap which will allow the movement to a competitive low-carbon economy in 2050. The investments represent a necessity and take time to produce results and for sure will imply major changes in energy prices, carbon prices, in realizing of new technologies, and networks.
3.2. France energy context
The French electricity sector is characterized by its high specificity when is compared with any other from worldwide countries. As a consequence of the oil crises in 1974 France decide to invest massively into the nuclear sector due to the fact that this energy is less dependent on the economic events [27]. Since years 90’ nuclear energy in France represents more than 75% of the electricity consumption. Most of the investments have been driven from a political point of view in such way to encourage technologies based on this type of energy and leaving very little space to develop any other energy sources.
At present France is so addicted to the nuclear sector that the government decides that a new nuclear reactor will be started only when an old one will be shutting down. This decision comes immediately after Fukushima accident when the nuclear energy sector across the world was faced to reconsider its energy policy. Many countries decided to turn their faces towards the renewable energy sources and progressively to shut down their nuclear power plants. Germany was one of the countries who react immediately and by the voice of its canceler announced that all nuclear reactors would be closed until the end of 2022.
As well, the policies pursued by the European Union which imposed renewable energy targets to be reached by 2020 for each country finds France in a very difficult situation having at the end of 2014 only 9,100 MW power generation capacity from the wind and nearly 5,300 MW power generation capacity from photovoltaic panels [28].
As any market mechanism, the French power market is concentrated on: Electricity generation largely dominated by EDF which on its turn is controlled by the French state, Transmission and Distribution having as a system operator RTE and ERDF which are 100% owned by EDF. The retail market is liberalized since 1999 when industrial sites became eligible to choose their suppliers and in 2007 this option became possible as well for residential customers.
Figure 7 – Electricity production from all energy sources: France case
Figure 8 – France interconnection energy sector [28]
French energy sector is well interconnected with its neighbors. In figure 8 are presented exports and imports for the year 2014 in which France are involved. One can be noted that France exports electricity to Great Britain, Belgium, Switzerland Italy and Spain and mainly imports from Germany, Switzerland and Spain.
17 21 25 25 416 407 410 420 62 58 62 63 16 19 22 21 17 15 10 17 13 13 19 0 100 200 300 400 500 600 2014 2012 2010 2008 El e ct ri ci ty p rod u ct ion [ T W h ] Period others wind gas hydroelectric nuclear coal
3.3. Romanian energy context
At the moment Romania disposes by a wide range, but reduced quantitatively, of primary fossil sources and minerals: oil, natural gas, coal, uranium and a potentially usable of renewable sources. At the same time can be said that Romania is placed in a relatively low dependency of energy import comparing with other European countries. In Europe, only Denmark and Estonia are better placed from this point of view. In the whole European Union, the primary energy demand is provided only in the proportion of 47% from own production, the difference being imported.
Looking back to the years 80’ one can be seen that at the moment the primary energy demand has been almost halved due to the process of deindustrialization and due to the emergence of new technologies more effective from the energetic point of view.
The Romanian National Power Grid is a system both for production and distribution of electricity and it consists in all plants and distributions networks. Parts of Romanian National Grid are: Termoelectrica, Hidroelectrica, Nuclearelectrica, Electrica, Transelectrica. The first three companies have the role in energy production while Electrica has the role in energy distribution and supply and Transelectrica is a transport operator.
If we take a look at figure 9 easily can find that Romanian energy sector is much diversified being independent by one source of energy. For the year 2014, 27.5% of the total energy produced resulted from coal, 30% from hydro, 18% from the nuclear sector, 12.5% from natural gas and 12% from solar and wind. Relating to the year 2008 in 2014 energy coal production fell by almost 10%, the percentage covered by the renewable sources mostly by sun and wind energy.
At the end of 2015 in Romania, the installed power from renewable sources counts 4,662 MW according to ANRE [29] from which 2,931 MW from wind turbines, 1,296 from photovoltaic panels and 106.5 MW from biomass, biogas and waste fermentation gas and 327.8 MW from micro-hydro power plants with an installed power below 10 MW.
Figure 9 – Electricity production from all energy sources: Romanian case
3.4. Requests needed for a larger integration of RES
Taking into consideration all the constraints related to renewable sources and their fluctuating nature find that the actual energy system cannot integrate at a large scale these kinds of technologies without new investments into the transmission sector and definitely into the energy storage systems [30], [31], [32], [33].
Grid expansion – should represent a priority in electric power grid capable of absorbing a growing share of renewable energy. The required technology is commercially available with few things that have to be improved in the field of security and flexibility of supply. However another problem which appears here is given by the public acceptance, but if the people want renewable energy they have to accept more grids in their neighborhoods.
Energy storage – is by far the option which provides the highest level of flexibility for integration at a large scale renewable energy sources. Various technologies are presented by the scientific literature and most of them have been proven to be technically viable. Depending on the scale one can be mentioned: pumped hydro storage, compressed air, flywheels, batteries, fuel cell and supercapacitors. The problem
17.7 22.9 20.6 27.5 11.6 11.4 11.6 11.2 19.2 12.3 20.2 17.1 8 8.6 7 8.9 6.2 2.6 0.3 0.2 1.6 0.08 0 10 20 30 40 50 60 70 2014 2012 2010 2008 El e ct ri ci ty p rod u ct ion [ T W h ] Period solar wind gas hydroelectric nuclear coal
in the case of energy storage appears when we look at its costs, however, we take any storage technology is expensive at the moment. Anyway there are a lot of improvements regarding its efficiency and reliability and as well as if we look in their price which is in a constant decline, only if we consider Tesla which reports at the beginning of 2016 a price of 3500 USD for 10 kWh Li-Ion batteries, we can expect that in the future prices achieve an acceptable level.
Demand side management – also known as energy demand management represents the modification of consumer demand for energy. The goal of DSM is to encourage the consumer to use less energy during the on-peak hours and to focus the time of energy use on off-peak periods such as nighttime and weekends. DSM doesn’t have as objective to reduce the total energy consumption only the request at which the power grid is supposed. So, various beneficial effects are resulted, among this could be mentioned: mitigating electrical system emergencies, reducing the number of blackouts and increasing the system reliability, possible benefits could also include reducing the dependency on fossil fuel, reducing energy prices, reducing the investments in generation, transmission and distribution networks. A solution is to use energy storage units during off-peak periods and discharge them during on-peak periods. In DSM a significant role is played by the integration of communications technology with the power system and so in nowadays instead of DSM is more used the term of the smart grid. The aim of the smart grid is to lower energy costs and bring immediate benefits to the consumer.
3.6. Weather conditions
Not only for the experimental part of the work even in the theoretical part in order to have a better sizing of the system that follows to convert the renewable energy in usable energy it has been started from geographical conditions. As we already said in this work we are focused on renewable energy sources and particularly our attention turns to solar and wind energy. Solar radiation and wind data help us to size the entire system function of the user needs. Thus a random location has been chosen having the following GPS coordinate 45°02'09.2"N 24°17'08.6"E. which in this case coincides with the location of The National R&D Institute for Cryogenics and Isotopic Technologies – ICSI Ramnicu Valcea. The pictures below, figure10, illustrates, first, a roadmap with the direct normal irradiation, global horizontal irradiation and average wind speed for countries like France and Romania. The other pictures, from figures 11 to 18, present a series of measurements data for both solar radiation and wind speed for the months of February and July, chosen as representative months for an entire year. For a better understanding of a solar radiation and wind nature, it has been shown their behavior daily. All weather data has been measured with a weather station which involves a Solys2 Sun Tracker where is mounted a Pyrheliometer for measurements of direct beam solar radiation. The working principle of a Pyrheliometer is that the sunlight enters into the instrument through a window and is directed onto a stack of thermocouples which converts heat to an electrical signal. As well as a Pyranometer is mounted on the Sun Tracker and is used, like in many scientific applications, to measure sun’s diffused energy. In solar energy research sun’s diffused energy has a greater importance reason for which Pyranometer has greater significance than Pyrheliometer which measures direct energy from the sun instead of diffused energy. A WindSonic device is a wind sensor very robust used to measure wind speed and direction. This sensor measures the time taken for an ultrasonic pulse of sound to travel from the North transducer to the South transducer, and compare the resulted time with the time for another pulse required to travel from the South to the North transducer. The same principle is applied to measure the time between Western and Eastern transducers and vice-versa.
Figure 11 – Wind speed illustration during the month of July 2015
Figure 12 – Wind speed illustration during the month of February 2015
0 100 200 300 400 500 600 700 800 0 5 10 15 20 25 time [hour] w ind [m /s ]
Wind month July
0 100 200 300 400 500 600 700 0 2 4 6 8 10 12 14 time [hour] w ind [m /s ]
Figure 13 – Solar radiation illustration during the month of July 2015
Figure 14 – Solar radiation illustration during the month of February 2015
0 100 200 300 400 500 600 700 800 0 200 400 600 800 1000 1200 time [hour] s un [rad/ m p]
Sun month July
0 100 200 300 400 500 600 700 0 100 200 300 400 500 600 700 time [hour] s un[ rad/ m p]
Figure 15 – Wind speed illustration for the first day of July 2015
Figure 16 – Wind speed illustration for the first day of February 2015
0 4 8 12 16 20 24 0 1 2 3 4 5 6 7 time [hour] w ind [m /s ]
Wind 1st day of July
0 4 8 12 16 20 24 0 1 2 3 4 5 6 7 8 9 10 time [hour] w ind [m /s ]
Figure 17 – Solar radiation illustration for the first day of July 2015
Figure 18 – Solar radiation illustration for the first day of February 2015
0 4 8 12 16 20 24 0 200 400 600 800 1000 1200 time [hour] s un [rad/ m p]
Sun 1st day of July
0 4 8 12 16 20 24 0 20 40 60 80 100 120 time [hour] s un [rad/ m p]
![Figure 6 – A snapshot for the share of energy from renewable sources for the year 2012 [26]](https://thumb-eu.123doks.com/thumbv2/123doknet/14691439.745428/31.892.132.763.108.570/figure-snapshot-share-energy-renewable-sources-year.webp)
![Figure 10 – Solar radiation and wind speed map illustration for France and Romania [34], [35]](https://thumb-eu.123doks.com/thumbv2/123doknet/14691439.745428/38.892.110.787.103.1045/figure-solar-radiation-wind-speed-illustration-france-romania.webp)

![Figure 51 – The time required for charging the tank depending by the thermodynamic compression process 0.20.250.30.350.4 0.45 0.5 0.55 0.6 0.6520030040050060070080090010001100Temperature [K]Efficiency [-]](https://thumb-eu.123doks.com/thumbv2/123doknet/14691439.745428/101.892.147.747.685.1040/figure-required-charging-depending-thermodynamic-compression-temperature-efficiency.webp)