• Aucun résultat trouvé

A method for estimating dry forage intake by sheep using polyethylene glycol as a faecal marker measured with NIRS

N/A
N/A
Protected

Academic year: 2021

Partager "A method for estimating dry forage intake by sheep using polyethylene glycol as a faecal marker measured with NIRS"

Copied!
10
0
0

Texte intégral

(1)

HAL Id: hal-00939513

https://hal.archives-ouvertes.fr/hal-00939513v2

Submitted on 19 Aug 2015

HAL is a multi-disciplinary open access archive for the deposit and dissemination of sci-entific research documents, whether they are pub-lished or not. The documents may come from teaching and research institutions in France or abroad, or from public or private research centers.

L’archive ouverte pluridisciplinaire HAL, est destinée au dépôt et à la diffusion de documents scientifiques de niveau recherche, publiés ou non, émanant des établissements d’enseignement et de recherche français ou étrangers, des laboratoires publics ou privés.

A method for estimating dry forage intake by sheep

using polyethylene glycol as a faecal marker measured

with NIRS

Philippe Hassoun, Gilles Viudes, Paul Autran, Denis Bastianelli, Francois

Bocquier

To cite this version:

Philippe Hassoun, Gilles Viudes, Paul Autran, Denis Bastianelli, Francois Bocquier. A method for estimating dry forage intake by sheep using polyethylene glycol as a faecal marker measured with NIRS. animal, Published by Elsevier (since 2021) / Cambridge University Press (until 2020), 2013, 7 (8), pp.1280-1288. �10.1017/S1751731113000323�. �hal-00939513v2�

(2)

doi:10.1017/S1751731113000323

A method for estimating dry forage intake by sheep using

polyethylene glycol as a faecal marker measured with NIRS

P. Hassoun

1,2,3-

, G. Viudes

1,2,3

, P. Autran

4

, D. Bastianelli

1,2,3

and F. Bocquier

1,2,3

1INRA, UMR 868 SELMET, F-34000 Montpellier, France;2Montpellier SupAgro, UMR 868 SELMET, F-34000 Montpellier, France;3CIRAD, UMR 868 SELMET,

F-34000 Montpellier, France;4INRA, UE0321 Domaine de La Fage, F-12250 Saint Jean et Saint Paul, France

(Received 14 May 2012; Accepted 6 February 2013; First published online 21 March 2013)

In experiments based on ruminants’ individual dry matter intake (DMI) assessment, several external markers can be used to estimate faecal output when total faeces collection is not possible. However, preparation of the markers to be administered and analytical procedures used for marker content determination are time-consuming thus strongly limiting the number of animals involved in the experiments. In this paper, polyethylene glycol (PEG, molecular weight 6000 da) was tested as a faecal marker. Four trials were conducted on dry, non-lactating ewes kept in digestibility crates that allowed individual measurements. The overall experiment was designed to assess the major factors that could lessen the effectiveness of this method, assuming that the use of grab samples of faeces is sufficient. Trial 1 was designed to test two levels of PEG (20 and 40 g/day) administered in two equal amounts. Trial 2 was designed to test the effect of either a single morning (0800 h) dose (20 g/day) or a twice daily administration (0800 and 1600 h) of the same fractionated dose. Trial 3 was designed to test a 20 g/day dose of PEG administered once daily to ewes fed with hays of different qualities: medium (MH) and low (LH). In trial 4, a lower dose of PEG (10 g/day) was administered once a day to ewes fed with fresh oat–vetch forage. It was demonstrated that PEG could be precisely estimated (average prediction error 5 3.47 g/kg) with near-infrared reflectance spectroscopy (NIRS). On the basis of the four trials, it has been proved that PEG administration (20 and 40 g/day) did not significantly affect the DMI of ewes fed dry diets (trials 1, 2 and 3), whereas there was an unexpected increase of DMI for ewes fed exclusively with green feed (trial 4) without DM digestibility modification. Providing PEG as a single dose (0800 h) or split into two equal parts (0800 and 1600 h) did not alter the estimated DMI. Considering the interest of grab sampling, there were clear variations of PEG in faeces with higher concentrations observed at 0800 and 1600 h and lower concentrations at 1400 h. Consequently, with PEG (measured with NIRS) administered once and using the grab sampling procedure (morning collection), it is possible to estimate the DMI of dry feeds with good accuracy. For green feeds, more research is needed as the estimated results are still highly variable.

Keywords: polyethylene glycol, near-infrared spectroscopy, faecal marker, intake, sheep

Implications

Several external markers that can be recovered in faeces are used in ruminant studies to estimate dry matter intake (DMI). However, analytical procedures are tedious and time-consuming. Polyethylene glycol (PEG) has been successfully tested as a faecal marker determined with the near-infrared reflectance spectroscopy (NIRS) technique. The present study has confirmed that PEG is a valuable faecal marker to esti-mate DMI in sheep with good accuracy when measured with the NIRS method. Because it is easily administered and quickly measured with NIRS, PEG can be used to satisfactorily estimate DMI and allows to work on a greater number of animals than other markers.

Introduction

In ruminants studies based on individual dry matter intake (DMI) assessment, DMI is estimated from total faeces output and DM digestibility (DMD) assessments. The DMD can be estimated using in vitrotechniques and total faecal output by determining the dilution rate of external markers (Prigge

et al., 1981).

Polyethylene glycol (PEG) with high molecular weight (.3000) is generally used as a soluble marker to measure rumen fluid volume and output flow rate from the rumen (Baumanet al., 1971). It has also been used as an external faecal marker to estimate total faecal output (Corbettet al., 1958; Hopson and McCroskey, 1972). However, when PEG is measured with colorimetric or turbidimetric methods, its recovery in faeces has been found to be variable and low

(3)

(Corbettet al., 1958). These results have been attributed to diet composition (Clark et al., 1972), feed digestibility or methodological difficulties (Alexanderet al., 1969).

More recently, Landau et al. (2002) demonstrated that PEG could be determined in goat faeces with the near-infrared reflectance spectroscopy (NIRS) method with good accuracy. Furthermore, Jones and Palmer (2000) showed that PEG addition does not modifyin vitroDMD. However, they pointed out that PEG binds with condensed tannins (CTs) and may indirectly increase CP digestibility. Compared with other analytical methods, NIRS method only requires the samples to be dried and ground, before scanned, and con-sequently a high number of samples (a hundred) can be determined daily. The use of PEG in combination with NIRS, allow the use of 10 animals in trials estimating DMI for periods of adequate length, which is difficult (costly and time-consuming analytical methods) to apply with PEG when measured by colorimetric or turbidimetric methods or by other external markers (Corbett et al., 1958; Hopson and McCroskey, 1972; Priggeet al., 1981).

Considering the potential interest of PEG as a faecal marker and its rapid determination by NIRS, Hassounet al. (2007a) set up a 1000-sample database with wide ranges of PEG content in faeces. In anin vivo experiment with sheep (Hassounet al., 2007b), various PEG doses were tested. Regardless of PEG level of administration, the recovery rate was higher than 98%.

With external markers used to estimate total faeces excretion, two sources of errors have to be considered. The first one deals with total recovery of the marker in faeces, meaning that few or no administered marker disappeared until reaching rectal excretion. The second one deals with the daily excretion pattern of the marker that is linked to the grab sampling approach (i.e. faecal samples taken directly from rectum) to estimate total faeces output. Consequently, the marker concentration measured in grab samples must be as close as possible to the marker mean concentration in total faeces. These two potential sources of bias have been studied with chromium sesquioxide (Langlandset al., 1963) and PEG (Hopson and McCroskey, 1972; Landau et al., 2002). Langlandset al. (1963) and Hopson and McCroskey (1972) found that total faeces output was either under- or overestimated due to these two sources of bias according to the administration form of the marker (on paper or into a capsule) and daily administration frequency of the marker (once or twice daily). On the contrary, Landauet al. (2002) stated that grab sampling would not bias significantly PEG recovery when goats were given 20g/day PEG.

The present experiment aimed to measure daily total PEG excretion in faeces, the diurnal excretion pattern in grab samples and to test three levels of PEG and two methods of administration in order to conclude on the usefulness of the PEG as external marker in forage intake studies.

Material and methods

Four trials were conducted. The first three trials were con-ducted at the Montpellier-Vauguie`res Experimental Unit

(INRA–PHASE, UMR SELMET) in the south of France, and trial 4 at the La Fage experimental farm unit (INRA–GA– SAGA) in a semi-mountainous area. All trials were conducted indoors in January/February 2005 (trial 1), March 2006 (trial 2), October/November 2006 (trial 3) and April 2007 (trial 4). All experimental procedures were approved by the current French Animal Ethics Committee at the time that each trial was performed.

Trial design

For all trials, each adult dry and non-pregnant ewe was previously orally drenched against internal parasites with 14 ml of SupavermR

(Jansen-Cilag, Issy-les-Moulineaux, France) (trials 1 to 3) or 18 ml of PanacurR

2.5% (Intervet, Beaucouze´, France), and placed in individual metabolism crates. Within trials, groups were balanced on a BW basis.

Trial 1 was conducted on two groups of Merinos d’Arles (MA) (48 6 3 kg). It consisted of a 14-day control period, fol-lowed by two measurement periods of 2 weeks. The control period consisted of 1 week of adaptation, followed by a 5-day DMD measurement period. The measurements periods con-sisted of 2 weeks during which 20 g/day (PEG20) and 40 g/day

of PEG (PEG40) were administered as a solution in two equal

parts (0800 and 1600 h) to five (PEG20) and four (PEG40) ewes.

During the 1st week, the daily kinetics of the appearance of PEG in total faeces was recorded. In the 2nd week, PEG recovery was measured daily on total faeces output. The excretion pattern between 0800 and 1800 h was defined through grab samples collected every 2 h for 5 consecutive days. The diet DMD was measured over the same period. The PEG administration was then stopped and the kinetics of PEG disappearance in total faeces output was recorded for 1 week. Diet DMD was measured the 2nd week for 5 consecutive days Trial 2 was conducted on two groups of four MA each (51 6 5 kg). It was performed according to a cross-over design with two periods of 2 weeks, including 1 week of transition, followed by 1 week of measurement. Two groups of four ewes received 20 g/day of PEG in solution during the two periods. The first group (PEGsingle) received a single dose

at 0800 h (period 1) and twice daily in split doses (period 2) at 0800 and 1600 h. The reverse procedure was applied for the second group (PEGtwice). The PEG recovery, diurnal

kinetics of excretion and the DMD of the diet were measured during the 2nd week of each period for 5 consecutive days. Trial 3 was conducted on two groups of five MA each (51 6 2 kg) successively fed two Crau perennial meadow hays of different qualities. The control group (C3) was not dosed with PEG, and the experimental group (E3) received a dose of 20 g/day of PEG administered once a day (0800 h) on a daily basis. The trial consisted of a 2-week adaptation period, fol-lowed by 1 week for DMD determination with the medium quality hay (MH) and a 1-week adaptation period for PEG and one measurements week. A 1-week adaptation period was then used to adapt the animals to the low quality hay (LH), followed by one measurements week. The PEG recovery was measured on total faeces collected for 5 consecutive days, and grab samples were simultaneously collected at 0800 h.

(4)

Trial 4 was conducted on two groups of five dairy Lacaune ewes each (79 6 17 kg). The control group (C4) received fresh oat-vetch forage without PEG and the experimental group (E4) received the same forage plus 10 g/day of PEG in a daily single dose (0800 h). The trial consisted of a 2-week adaptation period including PEG adaptation, followed by a 10-day measurement period (total and grab PEG recovery, DMD determination). Grab samples were collected at 0800 h.

Diets and feeding

In trial 1, animals were fed 0.3 kg of dehydrated alfalfa pellets and 0.2 kg of dehydrated sugar beet pulp pellets, both provided in two equal parts at 0900 and 1600 h. In addition, they were fed 1.5 kg of molassed wheat straw pellets once a day at 0900 h. In trial 2, animals were fed a 5-year-old semi-mountainous meadow hay harvested in July 2004. The hay was chopped into 5-cm-long pieces and given forad libitumintake (allowing 10% to 15% refusal on the DM basis) in two equal meals as in trial 1. In trial 3, animals were fed hay for ad libitumintake (allowing 10% to 15% refusal on the DM basis), chopped into 5-cm-long pieces. In trial 4, animals received fresh oat-vetch cut every day and given forad libitumintake (allowing 20% refusal on the DM basis). Fresh water was freely available to all of the animals in all of the trials. The chemical composition of the feeds is presented in Table 1.

Chemical analysis

All samples (feed and faeces) were ground through a 1-mm sieve. Total mineral content was determined by ashing in a muffle furnace for 5 h at 5508C. Total nitrogen was deter-mined using the Kjeldahl procedure. Cell wall fractions (NDF, ADF) were determined sequentially according to the method of Goering and Van Soest (1970) with an amylolytic and protease pre-treatment. Cell wall fractions are expressed exclusive of residual ash. The CT (trial 4) were determined using the vanillin method (Burns, 1971).

DMI and digestibility

Individual DMI was measured daily in the four trials. Refusals were recorded every morning before the first new meal. Offerings and refusals were sampled every day for DM content determination (48 h, 608C). During the measurement

periods, total faeces were collected, weighed and sampled for DM determination (48 h at 608C) in order to calculate total faecal output. Apparent DMD, based on the individual average DMI and faecal output, was calculated on 5 to 7 consecutive days, depending on the trial.

PEG preparation, administration and NIRS measurement

The PEG used was PEG 6000 (molecular weight 6000 da, Panreac Qimica SA, Barcelona, Spain). It was administered in solution form with plastic syringes. The PEG solution, with a concentration of 333.33 g/l, was prepared a few days before in the laboratory with double distilled water. In order to precisely determine the quantity of PEG administered, each syringe was weighed to the nearest 0.1 g before and after administration. The concentration of PEG in faeces was estimated with the NIRS method. Calibration databases were built by adding known amounts of PEG in faeces samples collected before the first doses, in order to build PEG 1 faeces databases similar to collected samples. The PEG was added to faeces in solution within a range of 0 to 100 g of PEG/kg DM (by 5 or 10 g of PEG/kg DM steps). The PEG 1 faeces mixtures were dried (508C until constant dry weight) and ground through a 1-mm sieve, similarly to the procedure applied for faeces preparation during trials.

The samples were scanned on a monochromator NIR spectrophotometer (NIRS 6500, Foss NIRSystems, Silver Spring, MD, USA). Measurement was done in reflectance mode in small circular cups (diameter: 50 mm) with quartz glass. Spectral data were collected every 2 nm from 400 to 2500 nm. Samples were scanned in duplicate (two different cup fillings) and spectra were averaged. Spectra were added to our existing database (Hassounet al., 2007a), leading to a global database of 527 samples of faeces samples collected from various origins (sheep breed and diets). The NIRS cali-bration was carried out using partial least squares regression (MPLS procedure, WinISI software, Infrasoft Int., Port Matilda, PA, USA). Only wavelengths in the 1100 to 2500 nm range were used, because of the unstability of models built with visible wavelengths. Mathematical pre-processing was applied to spectra with detrending and normalization (SNV) of data, and use of the second derivative calculated on five consecutive points with a smoothing also on a gap of five points. During the calibration process, prediction outliers Table 1Chemical composition of the feeds provided in trials 1, 2, 3 and 4

DM (%) OM (g/kg DM) CP (g/kg DM) NDF (g/kg DM) ADF (g/kg DM) CT (g/kg DM) ALF (trial 1) 90.3 972 155 485 326 nd SBP (trial 1) 89.4 920 80 503 262 nd STR (trial 1) 90.7 941 36 810 481 nd Hay (trial 2) 90.3 909 109 650 334 nd Hay 2 MH (trial 3) 89.7 914 105 539 327 nd Hay 2 LH (trial 3) 89.8 923 66 575 355 nd Oat2Vetch (trial 4) 15.3 896 168 423 206 1.7

DM 5 dry matter; OM 5 organic matter; NDF 5 neutral detergent fibre expressed exclusive residual ash; ADF 5 acid detergent fibre expressed exclusive residual ash; CT 5 condensed tannins; ALF 5 dehydrated alfalfa; SBP 5 dehydrated sugar beet pulp; STR 5 molassed straw pellet; MH 5 medium-nutritive value hay; LH 5 low-nutritive value hay; nd 5 not determined.

(5)

(studentized residualT.2.5) were discarded. Cross-validation of NIR equations was performed during the calibration process, dividing the database into four groups of samples of which three were used for calibration and the fourth for validation. Criteria for the evaluation of the prediction models are SEC (standard error of calibration) and SECV (standard error of cross-validation), which is an estimate of precision that can be expected in routine analysis. The RPD (5s.d./SECV) was calcu-lated as an indicator of the quality of the models (Williams and Sobering, 1993). The Mahalanobis distance was used to com-pare spectra with the database and identify spectral outliers following Shenk and Westerhaus (1991).

PEG recovery and PEG content in grab samples

The PEG recovery (REC) was calculated with the formula: REC 5 PEGT(g/kg DM) 3 FT (g/kg DM)/PEGin(g/day), where

PEGTis the PEG content estimated with NIRS in total faeces

(FT) and PEGinthe daily amount of PEG intake. The REC was

calculated daily for each ewe. Faecal grab samples were collected at the rectal level the same day that total faeces were collected for REC measurement. The PEG content of grab samples (PEGg) collected at 0800 h (trials 1 to 4) and

1600 h (trials 1 and 2) was determined with NIRS. It was compared with PEGTas a percentage:

ðPEGg=PEGTÞ  100:

Estimated faecal output and DMI

Faecal output was calculated including the correction of the two sources of bias values (total and grab sample recovery) or without correction (i.e. assuming that PEG recovery was not different of 100%). Each bias was calculated within trial and factor of variation when applied or averaged for the four trials. Estimated faecal output, corrected (Fc) with the within

trial biases or averaged trial biases or not corrected (Fnc),

was calculated as follows:

Fcðkg DMÞ ¼ ½PEGinREC  ð1000  PEGg8 = RECgÞ=

ðPEGg8 = RECgÞ=1000

FECncðkg DMÞ ¼ ½PEGin ð1000  PEGg8Þ = PEGg8 = 1000

where PEGg8 (g/kg DM) is the PEG content measured in grab

samples collected at 0800 h and RECg the PEG recovery

amount measured in grab samples.

Estimated DMI using Fccalculated with each trial biases

(DMIc), averaged trial biases (DMIavc) or using Fnc (DMInc)

were calculated as follows:

DMIcor DMIavcðkg=dÞ ¼ Fc=ð1  DMD=100Þ

DMIncðkg=dÞ ¼ Fnc=ð1  DMD = 100ÞÞ

Statistical treatment of results

In all trials, DMI, DMD and faecal DM content (FDMc) were

compared between groups (PEG20and PEG40, PEGsingleand

PEGtwice, C3 and E3 and C4 and E4, for trials 1, 2, 3 and 4,

respectively) at each period: before PEG (trials 1 to 3), with

PEG (trials 1 to 4) and after PEG (trial 1). Data were averaged per period for each ewe. Consequently, because of the low number of ewes per treatment or period, the non-parametric Mann and Whitney U-test (Siegel and Castellan, 1988; Sprent, 1992) was used to compare two independent sam-ples. The REC was also compared at each measurement period between PEG20 and PEG40 (trial 1), PEGsingle and

PEGtwice(trial 2) and E3 MH and E3 LH (trial 3), with the

same non-parametric test. Because non-statistical intra-trial differences were found, the REC between trials was com-pared adding trial 4, with the non-parametric Kruskal–Wallis test for multiple independent samples (Siegel and Castellan, 1988; Sprent, 1992). The PEG content measured on grab samples at 0800 h, 1600 h or averaged was compared with PEGT with the non-parametric Wilcoxon test for paired

samples because sample numbers were small, from four to eight (Siegel and Castellan, 1988; Sprent, 1992). For the same reason, actual DMI were compared with DMIc, DMIavc

and DMInc, respectively, with the non-parametric Wilcoxon

test for paired samples. All statistical analyses were per-formed using Statistica v9.1 for Windows (Statsoft 2010, www.statsoft.fr).

Results

NIRS calibration for PEG content

The calibration itself had anR2

50.99 and a residual stan-dard error (SEC) of 3.05 g/kg. No major bias was observed in the calibration process, and there were only 13 outlier samples, that is, 2.5% of the calibration database. The vali-dation of the calibration model by cross-valivali-dation resulted in a standard error (SECV) of 3.47 g/kg, which is quite accurate for such a measurement. The RPD value was 9.1.

When applying the calibration to our experimental sam-ples, it appeared that all samples to be predicted were inside the calibration database range. Only seven samples had an H (Mahalanobis) distance higher than 3, which was perfectly satisfactory.

Intake, digestibility and faecal DM content

The average DMI, FDMcand DMD for trials 1 to 4 are

pre-sented in Table 2. In trial 1, DMI and DMD were not sig-nificantly different (P.0.05) before PEG (control period), with 20 or 40 g of PEG, or after when PEG was stopped for 1 week (Table 2). The FDMcwas not significantly different

between PEG20 and PEG40 when PEG was administered.

However, it decreased compared with the first period, from 36.4% to 34.1% for the PEG20 group, and from 35.3% to

32.8% for the PEG40 group. In contrast, FDMc was

sig-nificantly different (P,0.05) between PEG20 and PEG40

measured 1 week after PEG was stopped. During this period, the FDMcof PEG20group increased and recovered its initial

FDMcvalue (before the PEG period). On the other hand, the

FDMcof PEG40 did not change and remained at the same

value as during PEG administration.

In trial 2, there were no significant differences between single or split doses on any parameters (Table 2). The FDMc

(6)

tended to be lower in both periods for ewes that first received PEG as a split dose and then as a single dose (36.1% and 35.8%) compared with the other group (39.0% and 38.2%), as presented in Table 2.

In trial 3, during the control period (Table 2), one ewe in the C3 group had a mouth problem and its results have been discarded for this period. After 3 days, the ewe recovered normal intake and had no more problems until the end of the trial. During the control period with MH hay, both DMI and DMD were not significantly different (P.0.05) between the C3 and the E3 group (Table 2). Also, FDMc was not

sig-nificantly different (P.0.05) between C3 and E3. When PEG was administered to group E3 fed with MH or LH, DMI and DMD were not significantly different (P.0.05) com-pared with the C3 group (Table 2). Only FDMctended to be

lower (P50.06) for E3 with MH but not with LH (P50.31). In trial 4, during the 1st-week adaptation period, two ewes (one in each group) were replaced after 4 days because they did not adapt to the crates. This was the only problem that occur-red. The DMI of E4 was significantly higher (P,0.05) than the control group C4 (Table 2). In contrast, DMD was not sig-nificantly different (P50.84) between C4 and E4. The FDMc

was significantly lower (P,0.05) for the E4 compared with the C4 group: 37.0%v. 56.5%, respectively.

PEG recovery, daily and diurnal excretion pattern

The recovery (REC) measured in the total faeces collected over 7 (trial 1), 5 (trials 2 and 3) or 9 days (trial 4) are

summarized in Table 2. The REC obtained in the first three trials ranged between 95% and 109%, with a similar varia-bility of 6.2% to 8.9%. In trial 4, a lower mean value was obtained (88%) with a higher variability of 24%. No sig-nificant effect (P,0.05) of the treatments was observed: dose, frequency and hay in trials 1, 2 and 3, respectively. However, when comparing trials, REC in trial 1 was sig-nificantly higher than in trial 2 (P,0.05), trial 3 (P,0.001) and trial 4 (P,0.001). The three other trials were not significantly different (P.0.05).

Faecal PEG content measured on grab samples (PEGg)

collected at 0800 h (PEGg8) and 1600 h (PEGg16) or pooled

(PEGg8-16) were compared with PEGT. Values and statistical

results are summarized in Table 3. In all trials, PEGg8 values

were not significantly different (P.0.05) compared with PEGT, except in trial 1 when 20 g/day of PEG was

adminis-tered (P50.04), and in trial 2 when 20 g/day of PEG was administered as a single dose (P50.03). The values of PEGg16 and PEGg8-16 were significantly different (P,0.05)

from those of PEGTin trial 2 but not in trial 1. The value of

PEGg8 represented more than 90% of PEGT, except in trial 2

when PEG was administered in a split dose (79%). Average PEGTvalues measured in the four trials are summarized in

Table 3. Values ranged from 22.0 to 43.0 g/kg DM with a similar standard deviation (s.d.) of 2.2 to 8.6, which gives a relative s.d. ranging from 5% to 28% (results not shown). Trial 4 gave the highest s.d. and relative s.d. The PEGT

was followed from the 1st day until 1 week after the last Table 2Mean and relative standard deviation (values in parentheses) of DMI, FDMc, DMD and PEG recovery rate (REC) measured in the four trials

Trial Group Dose (g/day) Frequency Period DMI (kg/day) DMI (g/kgW0.75) FDMc(%) DMD (%) REC (%) 1 PEG20 Before PEG 1.48 (3.0) 81 (5) 36.4 (1.9) 41.9 (7.4)

1 PEG40 Before PEG 1.43 (3.5) 79 (9) 35.3 (2.2) 40.3 (3.7)

1 PEG20 20 Split With PEG 1.52 (8.6) 82 (9) 34.1 (3.5) 37.8 (4.3) 109.2a(2.0) 1 PEG40 40 Split With PEG 1.57 (6.1) 85 (8) 32.8 (1.3) 36.3 (2.9) 108.0a(2.6) 1 PEG20 After PEG 1.57 (7.3) 84 (8) 37.3a(4.4) 42.3 (4.6)

1 PEG40 After PEG 1.60 (8.0) 85 (9) 33.0b(2.1) 41.2 (1.6)

Significance ns ns 0.019 ns

2 PEGsingle 20 Single 1 1.10 (12.9) 56 (18) 39.0 (0.4) 62.7 (3.5) 97.0b(4.9)1 2 PEGtwice 20 Split 1 1.18 (16.1) 65 (15) 36.1 (1.7) 62.3 (4.4) 95.5b(7.7)1 2 PEGsingle 20 Single 2 1.28 (3.9) 68 (5) 35.8 (2.2) 62.3 (1.5)

2 PEGtwice 20 Split 2 1.20 (6.8) 59 (15) 38.2 (1.9) 62.9 (3.8)

Significance ns ns ns ns 3 C3 Control-MH 1.24 (16.7) 65 (18) 46.6 (4.3) 63.9 (4.9) 3 E3 Control-MH 1.20 (8.3) 63 (8) 45.8 (5.8) 63.6 (2.1) 3 C3 Exp-MH 1.14 (15.9) 61 (18) 48.1 (3.0) 61.3 (2.0) 3 E3 20 Single Exp-MH 1.14 (4.8) 59 (7) 42.1 (1.1) 59.7 (4.9) 95.4b(2.0) 3 C3 Exp-LH 1.30 (9.4) 66 (11) 45.2 (2.1) 55.9 (1.8) 3 E3 20 Single Exp-LH 1.24 (4.4) 64 (6) 40.8 (1.1) 57.0 (2.1) 98.4b(1.7) Significance ns ns ns ns 4 C4 – 0.74b(22.6) 31b(14) 56.5b(2.7) 80.4 (2.0) 4 E4 10 Single – 1.40a(31.5) 55a(27) 37.0a(5.5) 79.8 (3.1) 87.5b(10.7) Significance 0.028 0.047 0.022 ns 0.0004

DMI 5 dry matter intake; FDMc5faecal dry matter content; DMD 5 dry matter digestibility; PEG 5 polyethylene glycol; MH 5 medium-nutritive value hay;

LH 5 low-nutritive value hay.

Within trial and period for DMI, FDMcand DMD, values with different superscript letters in a column are significantly different (P,0.05). For REC values with

different superscript letters in the column are significantly different (P,0.05).

(7)

PEG administration in trial 1. The excretion pattern is pre-sented in Figure 1.

Once PEG was administered, PEGTrapidly increased over

the first 2 days and then remained quite stable although markedly different between doses, until the last day for both 20 and 40 g/day doses. When PEG administration was stopped, PEGTdecreased as quickly as it had increased at the

beginning. No PEG was recorded 2 to 3 days later. Although the values observed on subsequent days were not exactly null (1.1 and 1.3 g/kg DM for PEG20and PEG40, respectively),

they ranged within the NIRS standard error of prediction: SECV 5 3.47 g/kg DM.

The diurnal excretion pattern was measured on grab samples in trial 1 (Figure 2a) and trial 2 (Figure 2b). When PEG was administered twice a day in trial 1, PEGgdecreased

from 0800 h to 1400 h, and then increased until 1800 h. The PEGg value at 0800 h and at 1800 h represented the

highest daily values in trial 1. The PEGg value decreased

and increased even more rapidly for PEG40 than for PEG20

(Figure 2a). In trial 2, regardless of the frequency of the dosed PEG, the highest PEGgwas observed at 0800 h and

then decreased until 1400 h, like in trial 1, and remained almost identical at 1600 h. The PEGgthen increased in both

groups but more quickly when administered as a single dose, almost reaching the initial value (i.e. at 0800 h), whereas with the split dose it remained lower (Figure 2b).

Estimated DMI

Actual DMI compared with each estimated values of DMI (Table 4) are not statistically different (P.0.05). The coef-ficient of variation (CV) of actual DMI in trials 1, 2 and 3 ranged from 4% to 12%. In trial 4, the CV reached 32%, respectively. The estimated values had a CV ranging from 5% to 22%, but was higher once again (48%) in trial 4.

Discussion

The precision of NIRS calibration was high, with a low measurement error (3.47 g/kg) and highR2and RPD values. The analytical precision is of extreme importance in studies Table 3Average PEG content measured in grab samples collected at 0800 h (PEGg8), 1600 h (PEGg16) or averaged (PEGg8–16), and in total faeces

(PEGT), statistical result (P-value of the Wilkinson test) for the comparison of means

Trial Group PEGg8 (g/kg DM) PEGg16 (g/kg DM) PEGg8–16 (g/kg DM) PEGT (g/kg DM) PEGg8v. PEGT P PEGg16v. PEGT P PEGg8–16v. PEGT P 1 PEG20 19.0 19.9 19.5 22.0 0.04 0.22 0.04 PEG40 39.7 38.2 39.0 40.8 0.46 0.14 0.27 2 PEGsingle 44.8 30.4 37.6 41.5 0.03 0.01 0.01 PEGtwice 39.8 28.1 34.0 43.0 0.12 0.01 0.01 3 E3MH 37.9 – – 40.7 0.37 – – E3LH 35.3 – – 37.4 0.33 – – 4 E4 33.7 – – 31.1 0.5 – –

PEG 5 polyethylene glycol; MH 5 medium-nutritive value hay; LH 5 low-nutritive value hay.

Figure 1 Evolution of PEG content (PEGT) in total faeces during the

experiment for groups dosed with 40 (PEG40) or 20 (PEG20) g of PEG per

day (trial 1). PEG 5 polyethylene glycol.

Figure 2 Kinetics of PEG content (PEGg) in grab faeces samples for groups

dosed (a) with 40 (PEG40) or 20 (PEG20) g of PEG per day (trial 1) and (b) daily

with 20 g of PEG administered once at 0800 h (PEGsingle) or split in two

amounts at 0800 and 1600 h (PEGtwice; trial 2). PEG 5 polyethylene glycol. PEG as a faecal marker to assess ruminant intake

(8)

with markers because a small error in the quantification of markers in faeces has a strong effect on the calculation of feed intake. For this reason, it is essential to update the calibration database at each new experiment with some faecal samples obtained before PEG treatments and enriched in vitro with PEG in order to obtain con-centrations within the range of those expected during the experiment.

The fact that recovery rates of PEG were close to 100% in the first three trials confirms that there was no major bias in PEG estimation. It validates the experimental calibration protocol, based on PEG addition in faeces, which was used to build and update the calibration database. This is also confirmed by the fact that the spectra of experimental samples were well fitted to the calibration database, that is, no major change was observed between PEG addedin vitro

and PEG having transitedin vivo.

The estimation of PEG concentration in faeces by NIRS proved to be very efficient. As no alternative reference analysis method exists for quick PEG determination, it would have been impossible to measure PEG concentration in several hundred samples, as required in this type of studies. The ease of NIRS analysis makes it extremely convenient for intake studies, making it possible to analyse a very high number of samples at a low cost in terms of time and money. Previously, PEG was used as faecal marker to estimate faecal output (Hopson and McCroskey, 1972; Landauet al., 2002). None of these studies reported any metabolism, intake or digestibility modifications due to PEG. In the pre-sent four trials, no effect of PEG was observed on DMI and DMD, except in trial 4 where E4 ewes ate twice as much as C4 ewes, 1.4v. 0.74 kg DM, respectively. The PEG is known to alleviate the negative effect of CT on intake and digest-ibility (Silanikoveet al., 2001; Bhattaet al., 2004). The CT content of oat-vetch in trial 4 was low (1.5 g/kg) compared with the values having a negative effect (i.e. .50 g/kg DM) on voluntary intake reported by Frutoset al. (2004). Therefore, it seems that PEG interaction with CT was not responsible for the

higher DMI observed in trial 4. No valid explanation was found to interpret these results.

In all trials, FDMcsignificantly decreased for ewes dosed

with PEG: 22.5 points (trial 1), 24 to 25.6 points (trials 2 and 3) and 219.5 points in trial 4. Landauet al. (2002) and Teeter and Owens (1983) observed with goats and steers, respectively, that FDMctended to decrease with PEG. This

FDMcdecrease was also observed with other water soluble

markers (Teeter and Owens, 1983). In sheep species, water is absorbed throughout the gut, from the small intestine to the rectum (Grovum and Hecker, 1973; Grovum and Williams, 1973). Consequently, the digesta become drier from the reticulo-rumen to the rectum. The DM content of digesta in the caecum and proximal colon is low and progressively increases until the terminal colon and rectum (Hecker and Grovum, 1971). Most of the water is absorbed at the caecum and proximal colon because digesta are retained for a rela-tively long time compared with the other sections of the colon (Hecker and Grovum, 1971).

It is known that PEG has no effect on water movement at the rumen level and does not interfere with the physiological functions of ruminal microorganisms (Sperben et al., 1953, quoted by Sinhaet al., 1970). As the intestine cannot secrete free water (Lord, 1999), the lower FDMcobserved with PEG

addition is probably due to the osmotic effect of PEG (Schiller

et al., 1988), which sequesters water in the intestine, inhi-biting water absorption (Davis et al., 1980). The osmotic effect of the PEG is probably higher at the caecum and proximal colon level. Considering the great difference observed in DMI but not in DMD in trial 4, Blaxter et al. (1956) observed that DMD (79.1% to 80.3%) was not modified when sheep were fed dry grass offered in a long form at 600 g or 1200 g/day. In the same time, they observed that DM content of the faeces tended to decrease (23.7 points) from 42.3% to 38.6% when DMI increases. Grovum and Williams (1973) observed that the quantity of water reaching the proximal colon is higher for sheep given 1200 g/ day of lucerne chaff than those given 400 g/day but water absorption from the large intestine is also higher. They observed the same water content of digesta in the rectum and concluded that the level of DMI does not influence the water content in the rectum. These results can explain partly why in trial 4 the DM content of the faeces in E4 is lower as more water reaching the colon is not fully absorbed because of the osmotic effect of PEG.

These results could be elucidated in offering two levels the same forage (fresh and as hay) at two levels of offered with or without PEG.

The REC was high in the first three trials, ranging from 95% to 109%. The same PEG recovery ranges (96% to 113%) were measured indoors with cattle (Corbettet al., 1958; Teeter and Owens, 1981), sheep (Hassounet al., 2007b; Cajaet al., 2009) and goats (Landau et al., 2002). In trial 4, REC was lower (87.5%), with an average range of 74.5% to 102.3%, as reported by Caja et al. (2009) when ewes were allowed to graze Italian ryegrass for 6 h (REC 5 81.6%) in addition to being fed dry food indoors, compared with ewes exclusively fed Table 4Average and relative standard deviation (values in

par-entheses) of actual DMI and estimated values with each trial recovery bias (DMIc) or average recovery bias of the four trials (DMIavc) included

or without (DMInc) recovery bias. Results were not significantly

(P>0.05) different.

DMI (kg/day)

Trial Factor DMI DMIc DMIavc DMInc 1 PEG20 1.51 (10) 1.60 (10) 1.49 (10) 1.53 (10) PEG40 1.55 (4) 1.67 (5) 1.54 (5) 1.58 (5) 2 PEGsingle 1.19 (12) 1.24 (21) 1.31 (22) 1.35 (22) PEGtwice 1.19 (11) 1.21 (12) 1.12 (12) 1.15 (12) 3 E3MH 1.14 (6) 1.19 (14) 1.29 (14) 1.32 (14) E3LH 1.20 (7) 1.20 (15) 1.30 (15) 1.33 (15) 4 E4 1.39 (33) 1.53 (48) 1.59 (49) 1.63 (49)

DMI 5 dry matter intake; PEG 5 polyethylene glycol; MH 5 medium-nutritive value hay; LH 5 low-nutritive value hay.

(9)

indoors (REC 5 101%). However, it was demonstrated that PEG with a high molecular weight (.3000) is not absorbable in the intestines (Schilleret al., 1997) and not found in the urine (Teeter and Owens, 1981 and 1983). The REC results of trial 4 may be attributed to the low PEG level (10 g/day) or to the nature of the diet (fresh forage with low DM content), but this remains to be clarified.

Marker excretion must be as stable as possible from day to day. In trial 1, daily PEG excretion was rather constant over the 14-day trial. In trial 1, PEG reached its maximum level in faeces 2 days after the first administration with a rapid steady state. Moreover, PEG rapidly disappeared 3 to 4 days after the last PEG administration (Figure 1). These results are in agreement with Corbett et al. (1958) and Hopson and McCroskey (1972) who observed a total PEG recovery within 2 to 3 days with steers dosed with 50 to 400 g/day of PEG. The pattern of PEG excretion is similar to other water-soluble markers (Cr-EDTA, Co-EDTA) excreted within 48 h after the first administration (Aharoni et al., 1999). The diurnal excretion pattern in trials 1 and 2 showed a curvilinear excretion with two high PEG content values at 0800 and 1800 h, and one lower value at 1400 h (i.e. 6 h after the morning dose). Corbett et al. (1958 and 1959) found the same diurnal excretion pattern of PEG on cows dosed once or twice daily, with the lowest value observed 6 to 8 h after the morning dose and the highest at 0800 and 1800 h. Hopson and McCroskey (1972), administrating various PEG levels in a single dose (0800 h) or twice daily (0800 and 1630 h) to steers, observed a similar diurnal excretion pat-tern but with a more pronounced difference between the highest and lowest PEG content with a single dose than with a split dose. Landauet al. (2002), using 20 and 40 g PEG/day administered in a single dose at 0800 h to goats, obtained the same excretion pattern with 40 g/day that observed in the present experiment with 20g PEG/day administered in a single or split dose (trial 2), but a different excretion pattern with 20 g PEG/day with less hourly variability.

When a marker is used for assessing total faecal output through grab sampling, the marker content must be as close as possible to the mean content in total faeces. Otherwise, marker content of grab samples must be corrected for this systematic bias. The PEGg8 values, which represented 86%

to 108% of the corresponding PEGT values, were not

sig-nificantly different from actual PEGT in all trials, except in

trial 1 (PEG20) and in trial 2 when PEG was administered in a

single dose (Table 3). Averaging PEGg8 and PEGg16 did not

reduce this bias. Hopson and McCroskey (1972) obtained slightly higher values (92% to 116%) when PEG content in gathered grab samples (0800 and 1630 h ) were compared with PEG in total faeces collection. An average CV of 14% and 13% was found when measured at 0800 and 1600 h, respectively, that is similar to those observed by Landau

et al. (2002) with 16.4% and 15.3% with 20 and 40 g PEG/day, respectively. The CV was only higher in trial 4 with green forage, with 38%. Similarly, CV calculated on PEGTranged

from 3% to 19%, except in trial 4 (30%). Considering these results, it seems advisable to collect grab samples only in the

morning, which is easier from the practical point of view (less work and animal handling). Our results also reveal that there is no major difference between administering PEG once or twice daily.

The actual DMI variations between ewes in trials 1, 2 and 3 are in good agreement with other values observed under various conditions (Andueza et al., 2011). However, the values were much higher (32%) with fresh green forage than those observed for other species of fresh green forage (Dulphy, 1971). Consequently, if the diet does not contain tannins, the DMI can be estimated with good accuracy, cor-rected or not with the recovery biases. Landauet al. (2002) obtained the same results without any correction.

Conclusions

These results confirm that faecal PEG content can be esti-mated by NIRS with good accuracy, provided that faeces obtained from sheep fed the diet on which measurements are to be made are included in the general NIRS database for calibration. Because PEG is rapidly excreted, it is recom-mended that faeces be collected within 1 week after the start of administration. The PEG recovery rate in total faeces is high and comparable with other results found in the lit-erature concerning dry feed. Using PEG as a faecal marker at levels of 20 to 40 g/day does not modify DMD and DMI when sheep are fed dry diets. Surprisingly, PEG modifies the DMI but not the DMD of a fresh forage diet. Further experiments with fresh forage must be conducted because most of the results in the literature deal with dry diets. Consequently, PEG estimated by NIRS can be a good faecal external marker, allowing a rapid determination, no extraction, no use of health hazards for technicians (in contrast with other external marker like ytterbium or alkanes) and no problem of disposal. Briefly, the practical procedure proposed is to dose animals with PEG solution once a day (20 g of PEG/day) and to collect grab faeces samples in the morning for 5 days at the same time the animals are dosed. Collected faeces should be dried (at a temperature not exceeding 508C) and gathered per animal and per period before being NIRS scanned.

Acknowledgements

The authors would like to thank J.M. Capron, S. Douls, V. Thiers and the technical staff of La Fage for their expertise in animal management and sample preparation. They are also grateful to L. Bonnal for his assistance in NIRS analysis.

References

Aharoni Y, Brosh A and Holzer Z 1999. Comparison of models estimating digesta kinetics and fecal output in cattle from fecal concentrations of single-dosed markers of particles and solutes. Journal of Animal Science 77, 2291–2304. Alexander CL, Meyer RM and Bartley EE 1969. Effect of quantity of rumen dry matter and other factors on determinations of rumen fluid volume with polyethylene glycol. Journal of Animal Science 29, 69–74.

Andueza D, Picard F, Pradel P, Egal D, Hassoun P, Peccatte JR and Baumont R 2011. Reproducibility and repeatability of forage in vivo digestibility and

(10)

voluntary intake of permanent grassland forages in sheep. Livestock Science 140, 42–48.

Bauman DE, Davis CL, Frobish RA and Sachan DS 1971. Evaluation of polyethylene glycol method in determining rumen fluid volume in dairy cows fed different diets. Journal of Dairy Science 54, 928–930.

Bhatta R, Shinde AK, Verma DL, Sankhyan SK and Vaithiyanathan S 2004. Effect of supplementation containing polyethylene glycol (PEG)-6000 on intake, rumen fermentation pattern and growth in kids fed foliage ofProsopis cineraria. Small Ruminant Research 52, 45–52.

Blaxter KM, Graham MM and Wainman FW 1956. Some observations on the digestibility of food by sheep, and on related problems. British Journal of Nutrition 10, 69–91.

Burns RE 1971. Methods for estimation of tannin in grain sorghum. Agronomy Journal 63, 511–512.

Caja G, Ralha VM and Albanell E 2009. Evaluacion del polietilenglicol (PEG6000) como marcador indigestible para ovejas lecheras en estabulacion o pastoreo. In XXXIX Jornadas de Estudio, XIII Jornadas sobre Produccion Animal, Zaragoza, Spain, pp. 3582360.

Clark JL, Hembry FG, Thompson GB and Preston RL 1972. Ration effect on polyethylene glycol as a rumen marker. Journal of Dairy Science 55, 1160–1164. Corbett JL, Greenhalgh JFD and Florence E 1959. Distribution of chromium sesquioxide and polyethyleneglycol in the reticulo-rumen of cattle. British Journal of Nutrition 13, 337–345.

Corbett JL, Greenhalgh JFD, Gwynn PE and Walker D 1958. Excretion of chromium sesquioxide and polyethylene glycol by dairy cows. British Journal of Nutrition 12, 266–276.

Davis GR, Santa Ana CA, Morawski SG and Fordtran JS 1980. Inhibition of water and electrolyte absorption by polyethylene glycol (PEG). Gastroenterology 79, 35–39.

Dulphy J 1971. Influence du poids vif et du niveau d’ingestion sur le comportement alimentaire et me´rycique du mouton. Annales de Zootechnie 20, 477–486. Frutos P, Hervas G, Giraldez FJ and Mantecon AR 2004. Review. Tannins and ruminant nutrition. Spanish Journal of Agricultural Research 2, 191–202. Goering HK and Van Soest PJ 1970. Forage fiber analysis. In Agricultural handbook No. 379. (ed. Agricultural Research Services, Washington, DC) Grovum WL and Hecker JF 1973. Rate of passage of digesta in sheep. 2. The effect of level of food intake on digesta retention times and on water and electrolyte absorption in the large intestine. British Journal of Nutrition 30, 221–230. Grovum WL and Williams VJ 1973. Rate of passage of digesta in sheep. 1. The effect of level of food intake on marker retention times along the small intestine and on apparent water absorption in the mall and large intestines. British Journal of Nutrition 29, 13–21.

Hassoun P, Bastianelli D and Bonnal L 2007b. Determination of polyethylene glycol (PEG) concentration in sheep faeces with near infrared spectroscopy. In Proceedings of the 12th International Conference 2 Near Infrared Spectroscopy. Auckland, New Zealand, 9215 April 2005 (ed. GR Burling-Claridge, SE Holroyd, RMW Sumner), pp. 34236. NZ NIRS Soc. Inc., Hamilton, New Zealand. Hassoun P, Fabre D, Bastianelli D, Bonnal L and Bocquier F 2007a. Utilization of poly ethylene glycol 6000 (PEG) as a faecal marker measured with near infra red spectrometry (NIRS) in sheep. Cahiers Options Me´diterrane´ennes Se´rie A 74, 269–272.

Hecker JF and Grovum WL 1971. Absorption of water and electrolytes from the large intestine of sheep. Australian Journal of Biological Science 24, 365–372. Hopson DE and McCroskey JE 1972. Influence of dose level and method of administration on the use of polyethylene glycol for determining fecal output of cattle. Journal of Animal Science 35, 1054–1057.

Jones RJ and Palmer B 2000. In vitro digestion studies using 14C-labelled polyethylene glycol (PEG) 4000: comparison of six tanniniferous shrub legumes and the grassPanicum maximum. Animal Feed Science and Technology 85, 215–221.

Landau S, Friedman S, Devash L and Mabjeesh S 2002. Polyethylene glycol, determined by near-infrared reflectance spectroscopy, as a marker of fecal output in goats. Journal of Agricultural and Food Chemistry 50, 1374–1378.

Langlands JP, Corbett JL, McDonald I and Reid GW 1963. Estimation of the faeces output of grazing animals from the concentration of chromium sesquioxide in a sample of faeces. 1. Comparison of estimates from samples taken at fixed times of day with faeces outputs measured directly. British Journal of Nutrition 17, 211–218.

Lord RCC 1999. Osmosis, osmometry, and osmoregulation. Postgraduate Medical Journal 75, 67–73.

Prigge EC, Varga GA, Vicini JL and Reid RL 1981. Comparison of ytterbium chloride and chromium sesquioxide as fecal indicators. Journal of Animal Science 53, 1629–1633.

Schiller LR, Emmett M, Santa Ana CA and Fordtran JS 1988. Osmotic effects of polyethylene glycol. Gastroenterology 94, 933–941.

Schiller LR, Santa Ana CA, Porter J and Fordtran JS 1997. Validation of polyethylene glycol 3350 as a poorly absorbable marker for intestinal perfusion studies. Digestive Diseases and Sciences 42, 1–5.

Shenk JS and Westerhaus MO 1991. Population definition, sample selection, and calibration procedures for near infrared reflectance spectroscopy. Crop Science 31, 469–474.

Siegel S and Castellan JN 1988. Nonparametric statistics for the behavioral sciences, 2nd revised edition. International editions, McGraw-Hill Humanities/ Social Sciences/Languages, New York, USA.

Silanikove N, Gilboa N and Nitsan Z 2001. Effect of polyethylene glycol on rumen volume and retention time of liquid and particulate matter along the digestive tract in goats fed tannin-rich carob leaves (Ceratonia siliqua). Small Ruminant Research 40, 95–99.

Sinha KN, Martz FA, Johnson HD and LeRoy Hahn G 1970. Use of polyethylene glycol in estimating volume and weight of rumen contents, and digestion in cattle. Journal of Animal Science 30, 467–471.

Sprent P 1992. Pratique des statistiques non parame´triques. INRA, Paris, France. Teeter RG and Owens FN 1981. The potential use of five water soluble markers for measuring rumen liquid volume and dilution rate. Journal of Animal Science 53, 436.

Teeter RG and Owens FN 1983. Characteristics of water soluble markers for measuring rumen liquid volume and dilution rate. Journal of Animal Science 56, 717–728.

Williams PC and Sobering DC 1993. Comparison of commercial near infrared transmittance and reflectance instruments for analysis of whole grains and seeds. Journal of Near Infrared Spectroscopy 1, 25–32.

Figure

Figure 2 Kinetics of PEG content (PEG g ) in grab faeces samples for groups dosed (a) with 40 (PEG 40 ) or 20 (PEG 20 ) g of PEG per day (trial 1) and (b) daily with 20 g of PEG administered once at 0800 h (PEG single ) or split in two amounts at 0800 and

Références

Documents relatifs

(1990) and fully formalized by Launeau and Robin (1996) with the addition of a Fourier analysis of the intercept count and the definition of the rose of traverses or the rose of

In contrast, the addition of polyethylene glycol (PEG) to the cerium nitrate containing NaCl solutions enhanced protection through the formation of stable

Please cite this article as: Mily, L.M., Martine, D., Franc¸oise, L., Bernard, B., Roland, C., Philippe, F., Michel, F., Henri, S., Catherine, B., Experimental infection of

Title: Reduction of Escherichia coli O157:H7 excretion in sheep by oral lactoferrin administration..

The ability of the Yb-faecal index method to accurately predict the actual values of forage and total intake, faecal output, as well as diet digestibility and indigestible

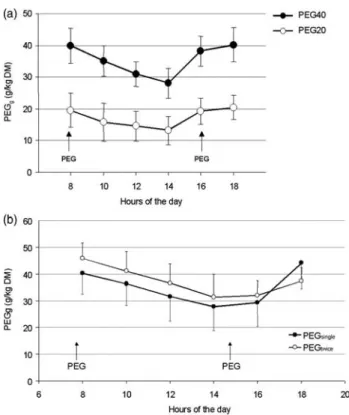
Performance of calibration equations developed over increasing concentration ranges of polyethylene glycol (PEG) to predict the concentration of PEG in sheep faeces (g.(kg DM) -1

The amount of selenium excreted in the urine depends on the level of selenium intake, its chemical form, the composition of the diet, the physiological and selenium status of

Our results show that ACAS provides a more accurate estimation of TTC when the image flow may be approximated by an affine transformation, while SIRS provides an estimate that