The Aging of Organic Aerosol in the Atmosphere: Chemical Transformations by Heterogeneous Oxidation
MAS by
Sean Herbert Kessler
ARC1*
SACHUSETTS INSTIT TE OF TECHNOLOGY
JUN
2 6 2013
B.S. Chemical Engineering, Lehigh University, 2008
Submitted to the Department of Chemical Engineering in Partial Fulfillment of the Requirements for the degree of
DOCTOR OF PHILOSOPHY IN CHEMICAL ENGINEERING at the
MASSACHUSETTS INSTITUTE OF TECHNOLOGY
June 2013
@2013
Massachusetts Institute of Technology. All Rights Reserved.Signature of Author:
Certified by:
/I
Accepted by:Department of Chemical Engineering, May 17, 2013
/ n A/1
Jesse H. Kroll
Assistant Professor of Chemical Engineering Assistant Professor of Civil Engineering Thesis Supervisor
4 atrick S. Doyle
Professor of Chemical Engineering Chairman, Committee for Graduate Students
The Aging of Organic Aerosol in the Atmosphere: Chemical Transformations by Heterogeneous Oxidation
by
Sean Herbert Kessler
Submitted to the Department of Chemical Engineering on 17 May 2013 in Partial Fulfillment of the Requirements for the Degree of Doctor of
Philosophy in Chemical Engineering
ABSTRACT
The immense chemical complexity of atmospheric organic particulate matter ("aerosol") has left the general field of condensed-phase atmospheric organic chemistry relatively under-developed when compared with either gas-phase chemistry or the formation of inorganic compounds. In this work, we endeavor to improve the general understanding of the narrow class of oxidation reac-tions that occur at the interface between the particle surface and the gas-phase. The heterogeneous oxidation of pure erythritol (C4H100 4) and levoglucosan (C6H1005) particles by hydroxyl radical (OH) was studied first in order to eval-uate the effects of atmospheric aging on the mass and chemical composition of atmospheric organic aerosol, particularly that resembling fresh secondary or-ganic aerosol (SOA) and biomass-burning oror-ganic aerosol (BBOA). In contrast to what is generally observed for the heterogeneous oxidation of reduced organ-ics, substantial volatilization is observed in both systems. As a continuation of the heterogeneous oxidation experiments, we also measure the kinetics and products of the aging of highly oxidized organic aerosol, in which submicron particles composed of model oxidized organics- 1,2,3,4-butanetetracarboxylic acid (C8H1008), citric acid (C6H807), tartaric acid (C4H606), and Suwannee River fulvic acid-were oxidized by gas-phase OH in the same flow reactor, and the masses and elemental composition of the particles were monitored as a function of OH exposure. In contrast to studies of the less-oxidized model systems, particle mass did not decrease significantly with heterogeneous oxida-tion, although substantial chemical transformations were observed and char-acterized.
Lastly, the immense complexity inherent in the formation of SOA-due pri-marily to the large number of oxidation steps and reaction pathways involved-has limited the detailed understanding of its underlying chemistry. In order to simplify this inherent complexity, we give over the last portion of this thesis to
a novel technique for the formation of SOA through the photolysis of gas-phase alkyl iodides, which generates organic peroxy radicals of known structure. In contrast to standard OH-initiated oxidation experiments, photolytically initi-ated oxidation forms a limited number of products via a single reactive step. The system in which the photolytic SOA is formed is also repurposed as a gen-erator of organic aerosol for input into a secondary reaction chamber, where the organic particles undergo additional aging by the heterogeneous oxidation mechanism already discussed. Particles exiting this reactor are observed to have become more dramatically oxidized than comparable systems containing
SOA formed by gas-phase alkanes undergoing "normal" photo-oxidation by OH, suggesting simultaneously the utility of gas-phase precursor photolysis as
an effective experimental platform for studying directly the chemistry involved in atmospheric aerosol formation and also the possibility that heterogeneous processes may play a more significant role in the atmosphere than what is pre-dicted from chamber experiments. Consideration is given for the application of these results to larger-scale experiments, models, and conceptual frameworks. Thesis Supervisor: Jesse Kroll
Title: Assistant Professor of Chemical Engineering, Assistant Professor of Civil Engineering
Contents
1 Introduction 10
1.1 Classification of Mixtures . . . . 14
1.2 Modeling of Secondary Organic Aerosols . . . . 15
1.3 Overview of Heterogeneous Oxidation Experiments . . . . 18
2 Analysis of High-Resolution Aerosol Mass Spectrometry Data 21 2.1 Ionization Techniques . . . . 22
2.2 Dimensionality Reduction of Aerosol Mass Spectra . . . . 24
2.3 D iscussion . . . . 27
2.4 Im plications . . . . 32
3 Heterogeneous Oxidation of Poly-Alcohols: Erythritol and Levoglucosan 33 3.1 Experimental Methods . . . . 34
3.2 Fragment Ions at m/z= 44 . . . . 38
3.3 Kinetic Model and Fitting . . . . 38
3.4 R esults . . . . 40
3.4.1 Erythritol . . . . 40
3.4.2 Levoglucosan . . . . 45
3.5 D iscussion . . . . 46
3.5.1 Oxidative mechanisms & Structural effects . . . . 46
3.5.2 Van Krevelen Analysis . . . . 47
3.5.3 Atmospheric Implications . . . . 50
4 Heterogeneous Oxidation of Aged Organic Aerosol 52 4.1 M ethods . . . . 53
4.2 Results and Discussion . . . . 55
4.2.1 Oxidation Kinetics . . . . 55
4.2.2 Elemental Analysis . . . . 58
5 Formation of Secondary Organic Aerosol by Direct Photolysis
of Gas-Phase Iodide Species 66
5.1 M ethods .. . ... . .. . . . . .. . . . . 67 5.2 D iscussion . . . . 69 5.3 Kinetic Model of Iodide Photolysis . . . . 77
6 Aging of Photolytically-Generated Secondary Organic Aerosol 81
6.1 M ethods ... ... . . . . .. . . . .. . 83 6.2 Results . . . ... 83
7 Conclusions and Outlook 89
7.1 Experim ent . . . . 90 7.2 M odeling . . . . 91 7.3 Atmospheric Implications . . . . 93
A Estimation of Volatility Properties in Van Krevelen Space 108
B MATLAB and Igor Scripts 111
B. 1 Evaluating Chemical Diversity of Organic Compounds . . . . 111 B.2 Formation of Oxidation State Distributions from High-Resolution
M ass Spectra . . . . 118 B.3 The Van Krevelen "Ellipse" for Elemental Ratios . . . . 131
List of Figures
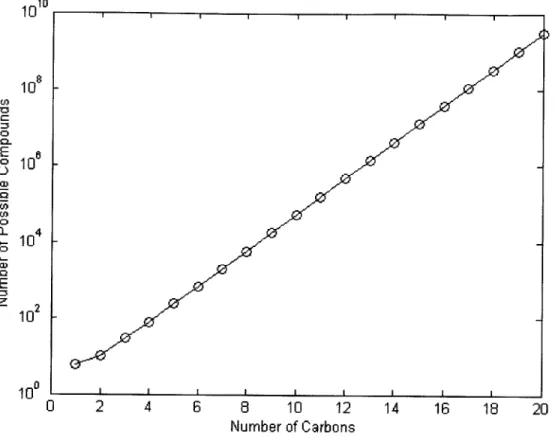
1.1 Total number of possible oxidized compounds for a given num-ber of carbon atoms . . . . 11 1.2 Van Krevelen diagram of low-volatility oxygenated organic aerosol
(LV -O O A ) . . . . 13
1.3 A general oxidation scheme for organic compounds in the
at-mosphere . . . . ... 14
1.4 Oxidative evolution of squalane and subsequent generations of products . . . . 16
1.5 Chemical structures of the model compounds to be used in this work ... ... .. 19
1.6 Diagram of the flow-tube reactor to be used in this work. . . . 20 2.1 Diagram of the Aerosol Mass Spectrometer . . . . 22 2.2 Comparison of unit-mass resolution and high resolution mass
spectra . . . . 23
2.3 Comparison of electron impact (EI) and vacuum ultraviolet
(VUV) ionization methods for squalane . . . . 25
2.4 Mass spectrum of a multigenerational mixture of oxidized squalane particles . . . . 26
2.5 Oxidation state distributions of pure citric acid interpreted from m ass spectra. . . . . 28
2.6 Distributions for three factors obtained by PMF from the CARES
cam paign . . . . 30
2.7 Distribution of the squalane OA oxidation state distribution at
four different degrees of oxidant exposure. . . . . 31
3.1 Measured effective density of particles for oxidized erythritol (red circles) and levoglucosan (blue squares) . . . . 36
3.2 High-resolution AMS spectrum of highly oxidized erythritol, at nominal mass-to-charge ratio of 44 . . . . 39
3.3 Fractional contribution of CO' (red) and C2H40+ (blue) to
organic signal in the erythritol system, along with the combined signal at m/z = 44 (gray). . . . . 40 3.4 Exponential fits performed on measured erythritol (red circles)
and levoglucosan (blue squares), presented on a logarithmic scale. 41 3.5 Representative AMS spectra of erythritol and levoglucosan, at
zero OH exposure and at - 8 x 10¹² molecule s cm- . . . . . 42 3.6 (A) Decay curves of pure erythritol (open circles) and total
par-ticle mass (filled triangles) over increasing oxidant exposures. (B) Mass contributions of selected marker peaks, used to repre-sent erythritol (circles), first-generation products (squares), and heavily-oxidized products (triangles). Solid and dashed curves denote non-linear fits to Equation 3.5. (C) Hydrogen-to-carbon (H/C, open triangles) and oxygen-to-carbon (O/C, filled trian-gles) ratios of reacted erythritol system. (D-F) Structure and evolving characteristics of levoglucosan system, as compared to erythritol. . . . . 43 3.7 Two possible reaction pathways in the oxidation of erythritol
and levoglucosan . . . . 47 3.8 Van Krevelen plot of H/C versus O/C for the erythritol (circles)
and levoglucosan ('x') reacting systems . . . . 49 4.1 An assumed representative structure of an aquatic fulvic acid,
based on fractionation and chemical analysis of samples . . . . 53
4.2 Aerosol mass spectra of oxidized acids and the products of fur-ther oxidation . . . . 56 4.3 Mass fraction remaining of key ions in the oxidation of the
single-component highly-oxygenated acid systems . . . . 59 4.4 Combined Van Krevelen diagram of the oxidation of aerosolized
organic acids . . . . 61 4.5 Fractional mass contribution of carbon (red) and oxygen (blue),
and total mass fraction remaining per particle (black) for each of the four oxidized acid systems over the course of further oxidation 63 4.6 Summary plots of heterogeneous oxidation experiments,
depict-ing changes in average carbon oxidation state, OSc, and relative carbon abundance as a function of OH exposure . . . . 65 5.1 Simplified mechanism of alkane oxidation chemistry and
com-parison of hydrogen abstraction pathways with direct photolysis of alkyl iodides . . . . 67
5.2 Common reaction pathways of alkylperoxy radicals under at-mospheric conditions. . . . . 68 5.3 Experimental setup for iodide photolysis and secondary organic
aerosol generation. Nitrogen is bubbled through liquid alkyl io-dide, such that the exiting gas is saturated in organic compound before being diluted by the makeup gas and entering the flow reactor. . . .. . . .. ... ... . . . . .. . . .... . 70
5.4 Adjusted organic aerosol mass yields versus total particle mass loading for the C8, Cio, and C12 systems. Trend lines are
gener-ated using a two-parameter fit to a volatility basis set, as shown in Equation 5.1 and Table 5.1. . . . . 71 5.5 Sample electron-impact mass spectra of C8, C10, and C12 aerosol,
taken from the highest range of concentrations in each experi-ment and normalized by the total signal . . . . 73 5.6 VUV mass spectra of the C8, C10, and C12 systems . . . . 76 5.7 Expected reaction pathways for the alkylperoxy radical in the
flow-tube photolysis of alkyl iodides . . . . 77 6.1 (Top) VUV mass spectrum of SOA generated from the
expo-sure of pure dodecane to OH. (Bottom) VUV mass spectrum of SOA generated from the photolysis of dodecyl iodide, with a much smaller degree of fragmentation. Peaks at m/z = 183 and m/z = 185 correspond to C12H230+ and C12H250+,
respec-tively, which may arise from the photolysis of C12H250OC 12H25 or from the loss of a hydrogen atom from dodecanal and dode-canol, respectively. . . . . 82 6.2 Experimental setup for the generation and aging of photolytic
secondary organic aerosol. . . . . 84
6.3 Normalized amount of carbon and oxygen detected in the C12
-derived organic aerosol. . . . . 85
6.4 Summary plots of the changing average carbon oxidation state (left) and normalized particulate carbon mass (right) for the aging of dodecyl-iodide SOA (red) as compared with all previous heterogeneous oxidation experiments (gray). . . . . 86
6.5 Van Krevelen plot of C12 photolytic SOA at increasing levels of oxidation . . . . 88
List of Tables
4.1 Uptake Coefficients, Atmospheric Lifetime, and Van Krevelen Slope of Model Systems . . . . 58
5.1 Product yields from a two-parameter fit to Equation 5.1 . . . 72
5.2 Reactions and rate coefficients used in a simplified photolytic oxidation schem e . . . . 79 5.3 Final concentration values of stable (non-radical) species, as a
fraction of the initial concentration of RI, for a simulation of the kinetics described in Table 5.2 . . . . 80
Chapter 1
Introduction
The presence of particulate matter (or "aerosols") in the atmosphere is of special importance due to its impact on both human health [1] and global climate-in the latter case primarily due to both direct radiative forcing and cloud condensation effects [2, 3]. The high degree of uncertainty in predict-ing these effects underscores the need for both improved understandpredict-ing of the underlying mechanisms of formation (and transformation) of particles and im-proved models to estimate both aerosol loading and its attendant influence on the planetary energy balance. Although aerosol particles have been extensively studied from the point of view of their inorganic components, characterization of organic aerosol remains less well understood, in large part because of the chemical complexity inherent in a system containing many diverse compounds.
The number of uniquely identified compounds present in the atmosphere has been estimated to be in the tens of thousands
[4],
and the number of theoret-ically possible compounds is shown through Figure 1.1 to be several orders of magnitude greater, even in very narrow cases for which several restrictions are placed on the definitions of chemical complexity.Organic compounds account for anywhere from 20% to 90% of the partic-ulate matter present in the lower troposphere [5, 6], yet the exact chemical composition of these mixtures is difficult to fully characterize. Organic aerosol particles in the atmosphere have two distinct sources. Primary organic aerosols (POA) are emitted directly into the atmosphere, whereas secondary organic aerosols (SOA) are formed from the condensation of lower-volatility oxidation products of volatile and semi-volatile organic compounds (VOCs and SVOCs, respectively) present in the gas phase. SOA has been shown in many stud-ies to contribute a substantial fraction to total organic particulate matter, though most field studies show measured amounts of SOA to be 10-100 times
1010 108 0 0-E o 10 0 a)' 10 a) S104 -0 E Z10 2 100_ 0 2 4 6 8 10 12 14 16 18 20 Number of Carbons
Figure 1.1: Total number of possible oxidized compounds for a given number of carbon atoms, assuming a linear backbone and allowing for hydroxyl, carbonyl, and carboxyl functional groups only.
higher than predicted by current models [7, 8, 9], indicating several as-yet unaccounted-for sources.
In addition, the classification of types of organic aerosol is further compli-cated by the definitions of various classes of oxidation through positive ma-trix factorization (PMF), which defines large datasets, containing time series of many mass spectra, in terms of a statistically restricted set of "factors", which are subsequently evaluated and given labels ranging from hydrocarbon-like organic aerosol (HOA, typically the most chemically reduced form) to oxygenated organic aerosol (OOA), biomass-burning organic aerosol (BBOA), and other region-specific factors [10]. Several factors, taken from multiple field campaigns and given the common label of low-volatility OOA (or LV-OOA), have been evaluated by elemental analysis, which is described in greater
de-tail in the next chapter, and are depicted in Figure 1.2 as a Van Krevelen diagram, which plots the hydrogen-to-carbon ratio (H/C) against oxygen-to-carbon (O/C) as a generic description of the chemical character of the organic species. In many cases, this description is sufficient to determine many use-ful properties of the aerosol as a whole [11, 12]. Even for a class of aerosol components with a common label and interpretation among the atmospheric chemistry community, we can observe a very broad range of values within this Van Krevelen space. The range in question is outlined using a confidence re-gion based on the covariance of the data set itself [12].
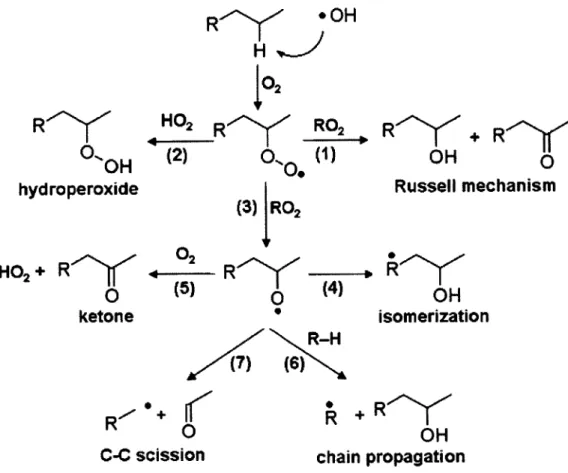
The chemical oxidation of organic compounds in the atmosphere may oc-cur in either the gas phase or the condensed phase (in the latter case, most frequently at the surface of a particle, via a heterogeneous mechanism), as in-dicated by the various mechanisms previously studied and depicted in Figure
1.3 [13, 14]. In many cases, oxidation is initiated by a hydrogen abstraction
step, in which a hydroxyl radical (OH-) reacts with the organic compound to form an alkyl radical. The subsequent reaction pathways lead either to ad-dition of functional groups (generally hydroxyl and carbonyl groups) to the carbon backbone of the molecule, which tends to lower the molecule's volatil-ity, or to carbon-carbon bond scission, which frequently increases volatility
[15, 16]. Additionally, oxidation of unsaturated hydrocarbons may also occur by an ozonolysis pathway, in which an alkene reacts directly with 03 to form
an ozonide intermediate before forming more heavily oxidized products [16].
Of particular interest in this work is the competition between those
reac-tions that contribute to a net increase in overall oxygen content of organic aerosols (functionalization) and those that contribute to a net decrease in car-bon content (fragmentation). Whereas functionalization reactions are likely to decrease the volatility of the organic species, fragmentation reactions typically lead to carbon loss by yielding two separate products, each one more volatile than the parent compound. The most common understanding of oxidation tends to assume that further oxidation generally leads to lowered volatility in almost all cases. Preliminary results observed in the oxidation of squalane, however, have demonstrated that fragmentation pathways are likely to be im-portant even for mildly oxidized components [13].
1.8 1.6- 1.41.2 -avg LV-OOA (reported) 1.0-0.8- 1 1 1 0.0 0.2 0.4 0.6 0.8 1.0 1.2 O/C
Figure 1.2: Van Krevelen diagram showing the reported elemental ratios of
the LV-OOA factors from several HR-AMS field campaigns [12]. The red star
denotes the average of all measured elemental ratios, with the ellipse indicating the covariance of the data within 1.96 standard deviations of the uncorrected mean value.
*OH
R
R
0OH
hydroperoxide H0 2+ R 0ketone
02 HO2 R R02 (2) 4 (1) (3) R02 02(3
.- Ry(5)
(7)
+
C-C scission
(4)
R
+ R
OH 0 Russell mechanismOH
isomerization(6)
RH
R+ROH
chain propagationFigure 1.3: A general oxidation scheme for organic compounds in the atmo-sphere, in both gas and condensed phases, and in the absence of NO,. All reactions depicted here are initiated by hydrogen abstraction by the hydroxyl radical (OH). Reaction rates and branching ratios between competing mecha-nisms are heavily influenced by a compound's partitioning between phases.
1.1
Classification of Mixtures
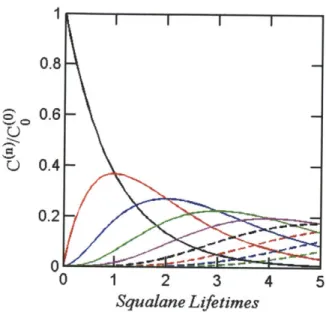
In considering the complexity of organic mixtures in the atmosphere, three classes, or orders, of organic mixture are of special note. The first, as discussed already, is the mixture of different possible reaction products available from a given oxidative step. Competition between fragmentation and functional-ization reactions, and variations among numerous functional groups that may be added to a compound, characterize the complexity of this particular class, which grows larger with each successive reaction. The second grouping con-siders mixtures among different generations of products, as depicted in Figure 1.4. Smith et al. have shown that initial oxidation of a large starting
com-pound (in this case, squalane, a branched C3 0 alkane shown in Figure 1.5) may
be represented in a simplified form by a single series reaction in which each generation is treated as a single product
[14:
Sq-+ OH
A
Sqo 1SqO, + OH -4 SqOn+1 (1.1)
If the same rate constant is used in each oxidation step (approximately valid for the first few reactions of a very large compound), the resulting analytical expression for the simplified system is
Tn
[SqOn] = [SqJ0 n exp(-rF) (1.2) where T= k (OH) t is the number of squalane lifetimes and represents the
amount of exposure required to decrease the amount of starting compound by one exponential unit. As demonstrated in Figure 1.4, several generations may co-exist for a given exposure level, thereby adding to the complexity of the system.
Lastly, the degree of oxidant exposure to which a compound is subjected is determined by the amount of time it spends in the system of interest. There-fore, the residence time distribution, which is controlled by transport consid-erations, dictates variations in the number of average lifetimes a single particle may experience. An understanding of the interplay among all three classes of mixing is important for two reasons. The first is that each level of detail is necessary in order to accurately model the atmospheric behavior of organic species, since a small fraction of highly oxidized compounds may potentially contribute disproportionately to either aerosol mass or additional thermophys-ical properties of the condensed phase (e.g. cloud condensation activity and human uptake). Additionally, the collection of useful laboratory data requires restriction of higher-order mixing in order to yield useful insights regarding the specific microscopic behavior of the systems in question.
1.2
Modeling of Secondary Organic Aerosols
Most recent treatments of SOA follow the two-product model proposed by Odum [17], in which the fractional aerosol yield is determined from the
indi-1 0.8 S0.6-U 0.4-0.2 0 0 1 2 3 4 5 Squalane Lifetimes
Figure 1.4: Evolution of squalane (black solid line), and the first-, second-, third- (red, blue, and green solid lines, respectively), and higher-generation oxidation products over increasing oxidant exposures.
vidual yields (ai) and gas-aerosol equilibrium partitioning constants (Kom,i) of every possible reaction product according to
Y = = COA
z
(1.3)AC R 1 + KomiCOA
where COA is the mass concentration of organic aerosol present in the sys-tem and CR is the concentration of the reactive species. The two-product model simplifies the above expression by assuming that the sum over all pos-sible products can be represented by two characteristic pseudo-products:
Q1
Kom, 1 a2Kom,2
Y ~O Co + (1.4)
1 + Kom,1Co 1 + Kom,2COA)
Application of this model to atmospheric systems entails identifying suit-able precursors (primarily terpenes and aromatic hydrocarbons), performing chamber oxidation studies to estimate mass yields as a function of aerosol loading, and fitting the data to Equation 1.4 to obtain values of ai, a2, Kom,1,
and Kom,2 for the compound being studied. Several potentially important
pre-cursors have been characterized in this manner [18, 19], but the large number of candidate organic compounds underscores several limitations of the model. Because the model treats precursors on a compound-by-compound basis, it cannot make predictions for compounds that have not been explicitly iden-tified and characterized, and the addition of each new precursor makes the non-linear solution of Equation 1.3 more unwieldy and prone to numerical er-rors. Additionally, the focus on aerosol production in terms of product yields implies a single-step chemical process, whereas multigenerational reaction ki-netics have been demonstrated to act as both significant sources [20] and sinks
[21] of SOA.
Another model, proposed by Donahue et al. [22], rewrites Equation 1.3 in terms of the total atmospheric concentration (as opposed to reaction yield) of a given compound:
COA =( iCi; i (I + - (1.5)
where (i is the fraction of the compound present in the condensed phase and C* (which is just the inverse of Kom,i as shown above) is the compound's saturation concentration in the gas phase, determined from the compound's vapor pressure, temperature, and activity coefficient in the condensed phase, as well as the average molecular weight of the aerosol mixture:
C* = MOAY 2RP (1.6)
In the Donahue model, the values of Cl are fixed (eschewing the assumption of a limited number of possible products), and all compounds of approximately the same volatility are grouped into bins. One practical benefit of grouping different molecules according to volatility is that if the total concentration Ci in each bin is known, the solution for organic aerosol mass requires only 6-7 terms and becomes relatively easy to solve numerically.
At the same time, grouping compounds by their partitioning constants at 25 'C is likely not to be sufficient to describe a given system completely. Dif-ferent compounds with the same gas-phase saturation concentration are likely to have different reactivities or cloud condensing properties, and differences in heats of vaporization can change the volatility distribution significantly over the range of temperatures encountered within the troposphere (-60 to 30 C).
Donahue et al. suggest the introduction of additional bins to describe chemical functionality, degree of oxidation, or elemental ratios as a means of capturing enough information to fully characterize a model system [22].
1.3
Overview of Heterogeneous Oxidation
Ex-periments
The overarching goal of this work is to establish a useful set of rules for pre-dicting the chemical behavior of organic aerosol systems undergoing aging via heterogeneous oxidation, which is considered as one narrow subset of all possi-ble oxidation pathways in the atmosphere (including bulk condensed-organic-phase oxidation, gas-condensed-organic-phase reactions, and aqueous chemistry). In order to sample from a sufficiently broad range of possible organic aerosol types, we choose to use a set of model compounds that represent several different rel-ative levels of oxidation and have a wide array of functional groups. Figure
1.5 displays the major compounds studied in this thesis, each of which is
in-troduced separately to a flow tube reactor (described in this section and in subsequent chapters, where relevant) and subjected to reaction with hydroxyl radicals (OH). These compounds include hydrocarbons (squalane, C3 0H62),
poly-ols (erythritol and levoglucosan), and highly oxygenated acids, the last of which are used as representatives for OOA, which is otherwise very difficult to reproduce in a laboratory setting [23, 24, 25].
The reactor that is used to oxidize the compounds of interest is depicted in Figure 1.6. Briefly, compounds are introduced, already in the condensed phase as sub-micrometer particles, along with a mixture of hexane, ozone, oxygen, nitrogen, and water vapor. The ozone, in the presence of 254-nm light, rapidly photolyzes and reacts with water vapor to form hydroxyl radicals, which are the primary oxidants in this system. The exiting particle flow is monitored by several conventional (and commercially available) instruments, as well as the Aerosol Mass Spectrometer, which is discussed in greater detail in the next chapter.
)Scr -2.067 1,2,3A-Butanetetracarboxylic Acid HO OH OH OH OH -0.5 Citric Acid HO 0 HO OH 0 OH 0 0.75 Levoglucosan 0 HO OH OH 0 Tartaric Acid OH O HO OH 0 OH 1 1.5
Figure 1.5: Chemical structures of the model compounds to be used in this work. Squalane [13]; erythritol and levoglucosan [26]; and tartaric, citric, and 1,2,3,4-butanetetracarboxylic acids [27] are all introduced separately into a flow tube reactor (by various methods described for each experiment) and subjected to reaction with high concentrations of the hydroxyl radical, OH.
GC-FID
SMPS
HR-AMS
hexane concentration (OH) volumes, mobility diameters elemental ratios, vacuum aerodynamic diametersFigure 1.6: Diagram of the flow-tube reactor to be used in this work. organic
Chapter 2
Analysis of High-Resolution
Aerosol Mass Spectrometry
Data
Analysis of the composition of aerosols exiting our reacting systems was per-formed using a High-Resolution Time-of-Flight Aerosol Mass Spectrometer
(HR-ToF-AMS, Aerodyne Research Inc., depicted in Figure 2.1) and has been extensively characterized [Jimenez 2003, Canagaratna 2007]. The front end consists of a sampling chamber in which the particle flow is sampled through a 100-,um critical orifice at a flow rate of -0.1 L min- and is focused through an aerodynamic lens at a pressure of -2 mmHg into a beam approximately 1 mm in diameter. The particle beam then passes to the ionization and sub-sequent detection region for mass spectral analysis of the entire condensed phase. Alternatively, if the instrument is set to "PToF" (Particle Time-of-Flight) mode, the beam is interrupted by a chopper so that aerosols enter a sizing chamber in small pulses. Individual particles are separated according to their vacuum aerodynamic diameter so that they enter the detection region at different times, thereby enabling the evaluation of a size-based distribution of mass spectra.
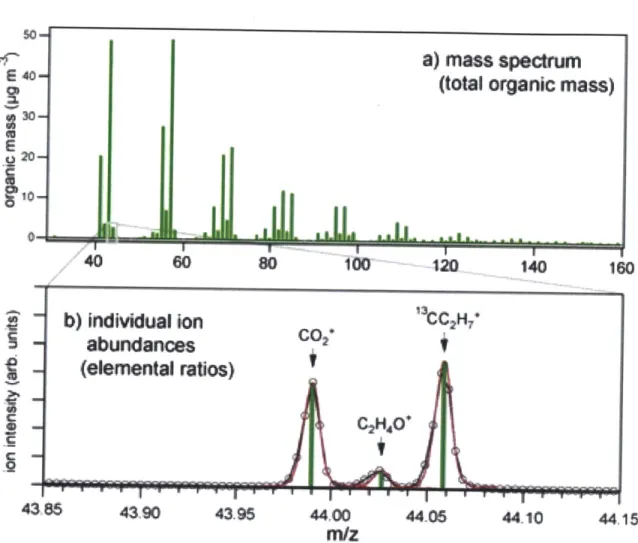
Mass spectra of the compounds and mixtures that pass through the selected front end instrument are analyzed via a time-of-flight mass spectrometer pro-vided by Tofwerk AG. The main advantage afforded by this device is the use of high-resolution (~5000) data gathering to differentiate between fragment ions having the same nominal mass (e.g. CO+, with a mass of 43.990, and C2H40+, with a mass of 44.026 amu, as illustrated in Figure 2.2 below). A
MCP
'
AerodynamicLens (2 Torr) Turbo Particle Inlet Pum p(1 atm)
Turbo Turbo
Pump Pump
Figure 2.1: Aerosol Mass Spectrometer set-up. Particles are sampled at the inlet of the AMS front end, pass through a chopper and PToF chamber for sizing, and then enter the ionization region, where they are vaporized, ionized, and analyzed by time-of-flight mass spectrometry [28].
of elemental composition, as described below for systems using electron impact
(EI) ionization [29, 30]. The utility of separating ion fragments shall be further
illustrated in Section 3.2, which contains profiles of the two ions mentioned above for a system in which erythritol particles undergo oxidation in a flow reactor as described above. Although the unit-mass peak at m/z = 44 is fre-quently used as a marker for the degree of oxidation of a system [30], the case presented here shows that even as the system becomes more heavily oxidized (as indicated by the rising CO- peak), the unit-mass peak appears to decrease.
2.1
Ionization Techniques
The most common ionization method used in the commercial AMS is the well-characterized electron impact (EI) method, whereby molecules are bombarded
by electrons from a tungsten filament at an electrical potential difference of 70
V. This process tends to lead to substantial fragmentation of organic molecules,
so that there is frequently little to no trace of the original parent ion detected. Although this fragmentation precludes the identification of individual
com-pounds within a mixture, the reduction of the mixture to a set of fragments, most with masses of no more than 100 amu, enables the unambiguous identi-fication of many individual fragments, thereby allowing for the measurement
a) mass spectrum
E 40
(total organic mass)
30-40
260
80 100 120 140 160b) Indivdual ion
CC2H*
abundances
CO
-
(elemental ratios)
43,86 43.90 43.95 44.00 44.06 44.10 44.15m/z
Figure 2.2: (Above) Unit mass resolution spectrum of a typical organic aerosol. (Below) High-resolution spectrum of the same organic aerosol at a nominal
of elemental ratios (oxygen to carbon, hydrogen to carbon, etc.) within the mixture [29, 30].
An alternative method of ionizing compounds, compared with El as de-scribed above, is vacuum-ultraviolet single-photon ionization (VUV-SPI), a "soft" technique that avoids excessive fragmentation of analyte ions. Photon energies employed are within 10-12 eV, just above the ionization energy of typical organic compounds (8-11 eV). The ultraviolet light required can be generated from a krypton lamp mounted inside the AMS, with a plurality of emitted photons at energies of 10 and 10.6 eV [31], or from a synchrotron radiation source. Because the latter option affords the advantages of a much greater level of radiation intensity and a highly tunable photon energy output (to within 0.1 eV over a range of 5-20 eV), synchrotron radiation was employed for the entirety of this project through continuing collaboration with Aerodyne Research, Inc. and Lawrence Berkeley National Laboratory (LBNL).
The utility of VUV ionization is demonstrated in Figure 2.3 below, in which a highly branched alkane (molecular weight 422 amu) is introduced in aerosolized form to the AMS. Whereas El ionization reduces the mixture to a series of fragments for which m/z < 100 (useful for bulk composition
stud-ies), VUV photoionization yields a predominant molecular peak and select few fragment peaks. When the particles are oxidized in a flow tube as described previously, several individual oxidation products can be identified and moni-tored with changing oxidant exposure in order to develop a working model for the kinetics of their time evolution [14].
2.2
Dimensionality Reduction of Aerosol Mass
Spectra
Dimensionality reduction in the AMS has frequently been used as a means of extracting physically relatable information from complicated mass spectra. The most often-employed techniques include the calculation of total aerosol mass; the fractional presence of the marker peaks at m/z = 43 and m/z = 44, used respectively to identify moderately- and highly-oxidized OA [32]; ele-mental ratios H/C, O/C, and N/C [29, 30]; and positive matrix factorization (PMF), which identifies the reduced and oxidized portions of organic aerosol, in addition to specific sources from unique events (e.g. biomass burning), via statistical speciation of large amounts of time-resolved AMS data [10].
CmS
-6
10-electron imipact (El)
VtN photoionszation
I L I AN _IN_ ._ J
Figure 2.3: Mass spectra of squalane (branched C30 alkane, structure shown inset) generated using electron impact ionization and vacuum-ultraviolet pho-toionization. The "soft" ionization technique yields a molecular peak not otherwise seen in most EI-AMS studies, with only very mild fragmentation observed.
Each of these dimensionality reduction techniques is capable of providing
highly useful chemical and/or physical information about the unresolved
com-plex mixture of organic species that is typically found in ambient aerosol (e.g.
by gas chromatography studies). However, by simplifying a high-resolution
mass spectrum to only a handful of variables, we risk discarding additional information by over-simplifying. We therefore seek a means of consolidating the full mass spectrum in a manner that is physically descriptive, retains a substantial amount of chemical information from the original spectrum, and relies on a very small number of variables in the final output. To this end, we introduce the concept of an oxidation-state distribution of carbon atoms, which can be applied to a single molecule or to large complex mixtures of many molecules.
1.2
1.0-
Am/z = 13.97 (+10, -2H)
1.0
Sq
SO
0.8-SqO
0,6-0
0.8
0.4 C 0.2--'
0.6
-)0.0C0L
420
425
430
435
440
SqO20.2
-ISqO
3SqO
4420
440
460
480
500
m/z
Figure 2.4: Mass spectrum of a multigenerational mixture of oxidized squalane particles, with different generations identified by the mass of the molecular peak.
The oxidation-state distribution, which we display here as a frequency his-togram, identifies the fraction of total carbon at each possible oxidation state (which, for molecules with more than one carbon atom, ranges from -3 for the most reduced carbon, CH3, to +3 for fully oxidized carbon, COOH). By
sub-dividing total carbon in this way, we are able to present a picture of organic aerosol as a dynamic mixture of reduced and oxidized carbon in a manner that allows for both greater conceptual understanding of mass spectra and a potentially improved analysis of key physicochemical properties of the organic mixture (e.g. reactivity, hygroscopicity, refractive index [11, 33, 34, 2, 35]).
2.3
Discussion
Construction of an oxidation-state distribution for a single molecule is
rela-tively straightforward. With very few exceptions (e.g. molecules containing a single carbon atom), the oxidation state of carbon atoms within a molecule typically take on integer values between -3 and +3. By counting the
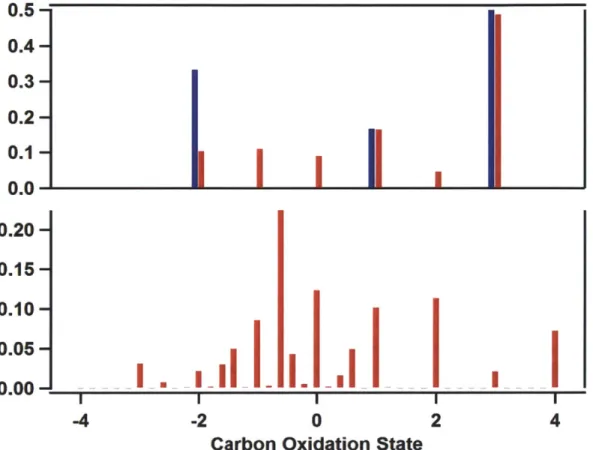
num-ber of atoms at each possible state, we can construct a histogram depicting the relative frequency of each level of oxidation. One such sample histogram is depicted in Figure 2.5a, for pure citric acid, which contains two reduced secondary carbon atoms, a hydroxyl group on a tertiary carbon, and three carboxyl groups.
A similar approach is undertaken in constructing carbon oxidation
distri-butions from mass spectra of unresolved OA mixtures. The AMS does not provide direct information about the degree of oxidation of each individual carbon atom. However, the high degree of fragmentation caused by electron impact (EI) ionization within the instrument ensures that a majority of the ion signal in the mass spectra comes from fragments containing three or fewer carbon atoms. As a result, the estimate of each fragment's average carbon oxidation state,
_ OH
OSc ~ 2 , (2.1)
C C,
will result in only modest errors compared with carefully reporting the oxidation state of each constituent atom. Different ion fragments with the same approximate OSc are grouped together, and the carbon contribution from each one is tallied in order to produce a frequency plot, as illustrated in Figure 2.5b for atomized citric acid. The non-integer values depicted in the distributions are the result of taking the average oxidation state for fragments with multiple carbon atoms. Note that because the formal positive charge associated with each ion is a product of the ionization process, and not an intrinsic characteristic of the organic aerosol, it is ignored for the purpose of our analysis.
Additionally, an alternative method (for which the relevant code is pro-vided in the Appendix) simplifies the distribution-as calculated from the
AMS data-to integer values of OSc in order to attempt an estimate of the "true" oxidation state distribution. The method by which this calculation is carried out involves first an empirical estimate of the relationship between the fraction of signal at m/z = 44 (specifically, the fraction of the ion CO') and
0.5
0.4 0.3 0.2 0.1 0.0 0.20 0.15 0.10 0.05 0.00 -4 1 1 -2 0Carbon Oxidation State
2 4
Figure 2.5: (Top, Blue) Oxidation state distribution of pure citric acid. (Top, Red) Inferred oxidation state distribution of citric acid obtained from manipu-lation of the mass spectra. (Bottom) Distribution of average carbon oxidation state of AMS fragments, weighted by carbon abundance.
the known fractional presence of carbon with an oxidation state of +3 in a given training set [29]. From there, the oxygen on remaining fragment ions is apportioned to values of -1 through +2 according to the relative degree of saturation (determined by the hydrogen content of the same fragments), and the remaining (non-oxidized) carbon in each fragment is apportioned to the reduced (-3 through 0) values of OSc. Fragments with no oxygen content at all are apportioned to the values of -3 through 0 in the same manner, with non-integer values of OSC determining the division of carbon between the two nearest integer values.
Such distributions are intended to provide a generic picture of reduced and oxidized OA that has greater physical significance beyond the simple MS-based picture, which typically must be interpreted by expert methods. Additionally, such distributions may avoid the potential danger in PMF studies of conflat-ing the various factors (e.g. hydrocarbon-like OA and oxidized OA) with fixed classes of molecules. Because the oxidation state distribution is only concerned with the degree of oxidation of carbon atoms, there is no danger of conflation of the atomic information with molecular information.
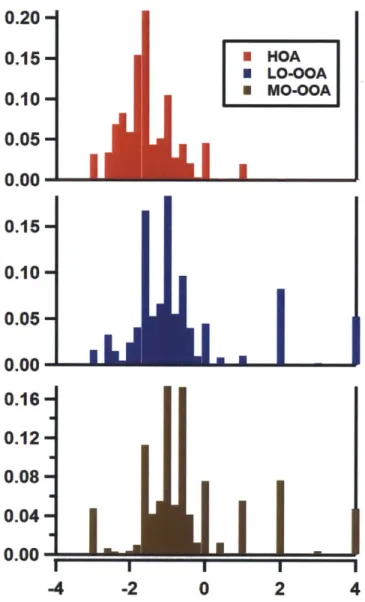
In order to demonstrate the potential value of these oxidation-state distri-butions, Figure 2.6 provides distributions for the factors obtained by positive matrix factorization (PMF) from the CARES field campaign [36]. Each of the factors depicted has already been identified, on the basis of analysis of the high-resolution mass spectra, according to the relative levels of oxygenation observed. However, by simply processing the spectra individually, the degrees of oxidation can be depicted directly for ready analysis.
Additionally, Figure 2.7 depicts the oxidation state distributions at several different levels of oxidation in the heterogeneous aging of Squalane [13], rang-ing from unoxidized to several weeks' worth of OH exposure. Once again, the gradual increase in average oxidation state-and, as importantly, the broaden-ing of the distribution to include a wider array of values-is depicted cleanly and directly. The distribution begins tightly centered about OSc = 2, as is
expected of typical alkanes. As particles become oxidized, the distribution becomes broader and shifts to higher oxidation states on average. We can also note that there is still some "reduced" carbon left in the mixture, even after heavy oxidation in the flow reactor.
OHOA SLO-OOA SMO-OOA
~1
0.00 0.16 0.12-0.08 0.04 0.00 "_-_ A I -2 -4 -2 0I
. . .o
2
4
Figure 2.6: Distributions for three factors obtained by PMF from the CARES campaign. (Top, red) Hydrocarbon-like Organic Aerosol, HOA. (Middle, blue) Less-oxidized Oxygenated Organic Aerosol, LO-OOA. (Bottom, brown) More-oxidized Oxygenated Organic Aerosol, MO-OOA. The average of the distribu-tion is observed to be higher for the factors identified as more-oxidized.
0.20 - 0.15- 0.10- 0.05-0.00 - 0.15- 0.10-
0.05-0.4 0.3 0.2 0.1 0.0 0.20 - 0.15- 0.10-0.05 -0.00 -0.20 0.15-0.10 0.05 0.00 0.15- 0.10- 0.05-0.00
-i
I
I -4 i2 -2I
I~
U UI
I 0 U i 2 i 4Figure 2.7: Distribution of the squalane OA oxidation state distribution at four different degrees of oxidant exposure.
a
0
2.4
Implications
We have introduced in this chapter a method for interpreting aerosol mass spectra that eschews the frequent view of OA as a sum of "factors". Rather, the distributions described herein approach the aerosol simply as a sum of many carbon atoms of varying oxidation states, in keeping with the tradi-tional difficulty of obtaining any greater molecular information from the high-fragmentation El mass spectra [28]. This view of OA as a distribution of com-ponents, rather than as specific molecules, allows us to examine with greater clarity how oxidation changes affect the mixture as a whole, with a gradual al-teration of the distribution's shape indicative of the chemical transformations occurring within the particle phase.
In the future, we might consider using such distributions in the context of low-variable-number models of the kinetics of atmospheric oxidation, in order to better capture the nature of oxidative aging of OA. By using a universally-applied method of characterizing the aerosol components, a parameterization for the kinetics of oxidation may be introduced for the purpose of allowing comparisons among the many different classes of organic compound and aerosol type that are included in this thesis. Future work on this project should focus on creating a generalized framework for describing all of these classes in a single model, such that the evolution of novel systems can be accurately predicted prior to carrying out the relevant experiments.
Chapter 3
Heterogeneous Oxidation of
Poly-Alcohols: Erythritol and
Levoglucosan
The bulk of the work performed in this thesis focuses on experiments concern-ing oxygenated organic compounds, considerconcern-ing the many studies that have al-ready been undertaken with respect to heterogeneous aging of reduced species and various types of chamber-generated secondary organic aerosol (SOA). Sev-eral of these studies [23, 37, 14] have previously found that substantial oxida-tion of reduced organic species, as well as loss of OA mass, occurs only at very high oxidant exposures, beyond what most particles will experience in their atmospheric lifetimes. Nonetheless, our work suggests that oxidized organic compounds may be susceptible to volatilization reactions; these may be atmo-spherically important given the abundance of oxidized compounds in OA [2].
In this chapter we investigate the kinetics and products of the hetero-geneous oxidation of oxygenated (polyhydroxylated) species by exposure to hydroxyl (OH) radicals. We focus on two model organic systems, chosen both for their high degree of oxidation and for their importance as surrogate or tracer species in OA. Erythritol, C4H100 4, is an analog of 2-methyl
erythri-tol, a tracer species for isoprene SOA [38, 39]. Levoglucosan, C6H1005, is a known product of cellulose pyrolysis and is frequently used as a tracer for biomass burning OA (BBOA) [40]. Although the role of these compounds in atmospheric chemistry differs greatly, they are functionally similar, with low carbon numbers, several hydroxyl groups, and a relatively high degree of oxygenation (oxygen-to-carbon ratios of 0.8 to 1.0). The rates of oxidation of both species may strongly affect their efficacy as tracers in determining
rel-ative amounts of SOA and BBOA [41, 42, 43, 44]. More generally, the goal of this work is to investigate the possibility that oxidative aging of organic aerosol may serve as a chemical sink of atmospheric particulate matter (PM) via formation of volatile products [45].
3.1
Experimental Methods
The flow reactor used to study the heterogeneous oxidation of particles has been described in detail previously [13, 14] and is discussed briefly here. The reactor is made up of type-219 quartz, with a length of 130 cm, inner diameter of 2.5 cm, and residence time of ~37 s. Carrier flow consists of an02/N2 mixture (in a 5/95 volume ratio), humidified to 30% RH. Organic aerosol is generated by sending an aqueous solution of each organic through either a constant-output atomizer (erythritol, 99% purity, Aldrich) [46] or a commer-cial nebulizer (levoglucosan, 99% purity, Aldrich) [47], and the resulting par-ticles (surface-weighted mean diameter of -270-305 nm) are drawn through a diffusion drier and into the flow reactor at loadings of ~500-750 pg m-3. Such loadings are sufficiently high to ensure that more than 95% of the erythritol and 99% of the levoglucosan, respectively, is present in the condensed phase at equilibrium. Because non-equilibrium aerosol mixtures tend to favor the condensed phase due to slow evaporation rates [48], we are confident that
het-erogeneous oxidation reactions will dominate under these conditions.
Ozone is produced by either a mercury pen-ray lamp (1-10 ppm) or a commercial corona discharge ozone generator (10-200 ppm, OzoneLab Instru-ments). 03 concentrations, which determine the level of OH exposure within the reactor are determined using an ozone monitor (2B Technologies Inc.). Within the flow reactor (temperature: 35 C), ozone is photolyzed by UV light at 254 nm from two mercury lamps positioned immediately outside the quartz tube. O(1D) generated by ozone photolysis subsequently reacts with
water vapor to form a pair of hydroxyl radicals (OH), which initiate oxidation of the particles. The water vapor concentration is maintained at a sufficiently high level to ensure that direct oxidation of particles by O(1D) is negligible,
as determined previously [14]. Hexane (~100 ppb) added to the tube is moni-tored by GC-FID to quantify OH concentration. This technique has been used to correctly predict rate constants in the reaction of OH with other selected gas-phase hydrocarbons [13, 14]; OH concentrations, which are changed by varying 03, range from 109 to 2 x 10" molecule cm- . Such concentrations
correspond to approximate atmospheric exposures of one day to four weeks, assuming an average ambient OH concentration of 3 x 10⁶ molecule cm-3. It
should be cautioned that these high OH concentrations may lead to significant secondary chemical effects, which would make linear extrapolation to ambient levels highly uncertain. Examination of these secondary effects by compari-son of low- and high-concentration experiments at varying residence times is therefore an important topic for future research.
Particles exiting the flow reactor are sampled into a scanning mobility parti-cle sizer (SMPS, TSI, Inc.), for the measurement of partiparti-cle mobility diameters, and a high-resolution time-of-flight aerosol mass spectrometer (HR-ToF-AMS, Aerodyne Research, Inc.), for the measurement of particle composition (oper-ating in "W-mode") and vacuum aerodynamic diameter ("V-mode"). Particle mass is obtained from combined SMPS measurements and AMS
particle-time-of-flight (PToF) data, by multiplying average particle volume (from the SMPS)
by the effective particle density (Figure 3.1). The effective density is calculated
from the mobility diameter, Dm (SMPS), the vacuum aerodynamic diameter, Dva (PToF), and the standard density, po (1 g cm 4, used in calibration of the
instrument), using the equation:
Dva
Peff =Dm Po (3.1)
Although this equation is strictly valid only for spherical particles, minor variations in particle shape will result in only small errors in measured mass,
less than 10% [49].
Pure particles of levoglucosan and erythtritol did not change in composition or mass when the UV lights were turned on but no ozone was added, verifying both that the parent organic compounds studied are not directly photolyzed, and that UV-generation of condensed-phase oxidants is negligible. Significant gas-phase oxidation of the semivolatile compounds studied here is also highly unlikely, due to their strong partitioning into the particle phase and the short residence time in the flow reactor. Thus any oxidative changes to the mass or composition of the particles result from heterogeneous oxidation of particulate species by gas-phase OH radicals.
The amount of starting compound (levoglucosan or erythritol) lost by re-action is quantified by selecting a marker peak from the high-resolution mass
1.5 - -O 3 a3 a (5 0 C? O O 0 E 0 o 0 y 0.5 -W 0 Erythritol 0 Levoglucosan 0 2 4 6 8 10 x 1012 OH Exposure (molecule s cm-3)
Figure 3.1: Measured effective density of particles for oxidized erythritol (red circles) and levoglucosan (blue squares). Actual densities of pure crystalline compounds are 1.45 and 1.5 g cm-3 , respectively. Discrepancies between real and measured values are likely to be caused by morphological effects and errors in PToF calibration, though these are not expected to affect our results (Figure
3.6).
spectrum and computing its fractional contribution to total AMS mass:
myj = .t moA (3.2)
itotal
where ij is the peak signal of the fragment ion selected to represent compound
j, itotal is the sum of all organic peak signals from the AMS, and moA is the
OA mass, normalized by particle number in order to account for wall losses
(assuming that dilution has no effect on other particles), small atomizer fluctu-ations, and changes in collection efficiency of the AMS. This method assumes that the chosen marker peak does not constitute a significant portion of the individual mass spectra of the oxidation products, so that the peak represents only the compound of interest. This approach has recently been shown to compare very well with offline techniques for quantifying levoglucosan [41].
(m/z = 104.047), which is formed by the neutral loss of H20 from the molec-ular ion (M - 18). Likewise, the selected marker peak for levoglucosan is
C6HsO (m/z = 144.042), also obtained by the loss of H20. Both peaks were
observed to be the fragments of highest mass in the pure compound spectra for which the AMS signal-to-noise ratio was suitably large. It is unlikely that any oxidation products would contribute significantly to the selected peaks, since they are expected to be of lower mass (aside from oligomerization prod-ucts, which are not strongly represented in these AMS spectra) and have fewer hydrogen atoms than the parent compound.
The effects of oxidation by OH exposure may vary widely, depending on the nature of the organic compound being oxidized. It is therefore useful to introduce the mass loss ratio (MLR), defined as the ratio of the change in particle mass to the change in mass of the reacting species. For a given particle mass moA, reactive species mass mR, and particles initially composed of the pure reactive species, such that moA(0) mR(0), one may write:
MLR = AmoA moA - moA(0) _ 1 - po (3.3)
AmR mR- mR(0) 1 -A
where t is the mass fraction remaining of either total aerosol or the reac-tive species. For our purposes, we assume that pR = my/mj(0), where my
is the mass of the selected AMS peak as computed in Equation 3.2. The MLR therefore describes the approximate yield of gas-phase products upon oxidation. Values of the MLR are determined by averaging all data points for which the total particle mass loss is greater than 20%, since values computed at low-oxidation conditions are subject to substantial numerical errors, while val-ues computed at high-oxidation conditions did not appear to vary significantly. We characterize the chemical changes to the reacting systems in terms of changes to the overall elemental composition of the organic mixture in the condensed phase. In particular, the oxygen-to-carbon ratio (0/C) and hydrogen-to-carbon ratio (H/C) are combined to estimate the overall degree of oxidation of OA particles and the relative contributions of key functional groups. The method for calculating elemental ratios from high-resolution AMS data is described in detail by Aiken et al. [29, 30]. This approach requires a set of factors to correct measured values for biases in ion fragmentation. Such factors are expected to be most accurate for complex organic mixtures, such as are found in ambient OA. As noted by Aiken et al. [29, 30], these standard correction factors (0.75 for O/C and 0.91 for H/C), are not as accurate for the measurement of individual organic species, such as those studied in the
present experiments. We therefore use system-specific correction factors for these studies in order to ensure that the elemental ratios of pure compounds are reported as their known values. The correction factors used are 0.44 for
O/C and 0.82 for H/C for erythritol, and 0.50 for O/C and 1.1 for H/C for
levoglucosan, which is similar to the correction for pure levoglucosan reported previously [29]. Regardless of the correction factor used, the overall conclu-sions reached with respect to the oxidative mechanism described below remain unchanged.
3.2
Fragment Ions at m/z =
44
While most studies have in the past used the unit-mass resolution peak at
m/z = 44 in order to quantify the presence of highly-oxidized compounds [30],
we have in this case focused specifically on the CO' peak. For both pure
ery-thritol and levoglucosan, the CO' signal is negligible, and the C2H40+ peak
dominates the total m/z = 44 signal (Figure 3.2). As oxidation continues (Fig-ure 3.3), the dynamic shifts to favor the presence of CO', so that the fractional contribution of C2H40+ may be used as a tracer for compounds closely
resem-bling erythritol and other tetrols. The lack of a strong C2H40+ presence in
some atmospheric measurements [50] may suggest that isoprene-derived tetrols contribute only weakly to the total sampled OA in several regions and points to a useful avenue of inquiry in future field studies.
3.3
Kinetic Model and Fitting
Traces used in Figure 3.6b and 3.6e are obtained from a fit to the model described herein. By designating the initial compound (erythritol or levoglu-cosan) as Po, first-generation condensed-phase products as P1, and volatilized products as V, we can write a simplified mechanism as:
Po- + OH P1
P0 + OH V
P1 + OH 4 Products (3.4)
where ki is the decay rate coefficient of initial component, k2 is the decay
500- 400-300 -6200 _ 100- CA 0-CO2 C2H4 43.94 43-96 43.98 44.00 44.02 44.04 44.06 44.08 44.10
Figure 3.2: High-resolution AMS spectrum of highly oxidized erythritol, at nominal mass-to-charge ratio of 44. The separation of the CO2 and C2H40+
peaks is clear and unambiguous, allowing for the calculation of elemental ratios
[29, 30] and the monitoring of changes in specific fragment ions during the oxidation process.
that lead to production of low-volatility first-generation oxidized compounds. For small variations in the concentration of OH, the reaction scheme in equa-tion 3.4 can be solved analytically to yield the concentraequa-tions of each species:
Cp. = Cp.(O)exp(-kr)
C = OkiCp0(0) [exp (-k 2r) - exp (-klT)] (3.5)
k1 - k2
where T = (OH) At is the average OH exposure, as measured by the
ob-served decomposition of hexane.
Non-linear exponential fits of concentration versus T was performed for the initial slope of erythritol and levoglucosan, using the first line of equation 3.5, over the first e-fold in the data in order to determine the value of k1, as
de-picted in Figure 3.4. This value was then inserted into the second line and combined with a non-linear fit of first-generation measurements in order to