European Heart Journal (1987) 8 (Supplement C), 1-9
The use of invasive techniques, angiography and indicator
dilution, for quantification of valvular regurgitations
H . P. K.RAYENBUEHL, M . RlTTER, O . M . HESS AND H . HlRZEL Medical Policlinic, Cardiology, University Hospital, 8091 Zurich, Switzerland
KEY WORDS: Mitral and aortic rcgurgitation, thermodilution, left ventricular biplane cineangiography. Angiographic techniques have been used for the quantification of mitral or aortic and rarely tricuspid regurgitation. Mitral or aortic regurgitant volume per beat and the regurgitation fraction (f*> andfm, respectively) are obtained from the angiographic determination of total left ventricular stroke volume (TSV) and forward stroke volume
(FSV) estimated by a different technique. Although this procedure is generally accepted as the gold standard for quantification of left heart regurgitations, there are several limitations: In the presence of mitral and aortic regurgitation no separate quantification offM and fm is feasible; heart rate at the time of determination of FSV (from Fick or dye dilution cardiac output) and of TSV (angio) may be different; there is a tendency to consistently overestimate stroke volume by angio techniques; repeated estimations of TSV bv angio are influenced by the circulatory effects of the contrast dye. In contrast indicator dilution techniques, where upsueam and downstream sampling allow the simultaneous estimation of forward and regurgitant flow, the accuracy of the determination of FSV is well established and repeated estimations offiu, andfm are possible because the indicators do not have cardiovascular effects. These methods are, however, crucially dependent on thorough mixing of the regurgitant volume with the blood in the upstream chamber.
In 23 patients with isolated aortic regurgitation there was a positive correlation between fM evaluated by thermodilution and fa determined by the biplane angio-Fick method (r = 0-59). fa by thermodilution averaged 0-40 and f,0 by angio-Fick 0-46 (NS). In 23 patients with isolated mitral regurgitation there was also a positive correlation between fm determined by thermodilution and fm determined by angio-Fick (r = 0-71). However, fm by thermodilution was consistently smaller than/„ by angio-Fick (average values 0-45 and 055, respectively, P < 0-005).
Introduction estimate the regurgitant stroke volume (RSV) per beat
_ . . - , . . . (RSV = TSV-FSV). The regurgitation fraction (f) is This review focuses on the two major invasive . , , _ ' , _ „ , , ° . . . ,
, . . .. , . . , . . . , . calculated as RSV/TSV. Several limitations and techniques, angiocardiography and indicator dilution, r r ' , . , , , , ,
. , ] . . ! . . . . . , , • sources of error of this technique have to be addressed: both of which were introduced into the cathetenzation
laboratory in the early 1960s"21. Purely qualitative (1) Determination of RSV across the mitral or the
or semi-quantitative modalities of angiographic and aortic valve is only possible when the other valve is dilution techniques will not be dealt with here. competent. In the presence of mitral and aortic regurgitation RSV calculated according to the above _ ._ ^ , . . . . formula equals the sum of the regurgitant flow in
Quantification of valvular regurgitations by I I . I - I . - I I J Z •
. . . . B B systole through the mitral valve and the regurgitant angiocardiography „, . , , , . .
^ flow in diastole through the aortic valve.
MITRAL AND AORTIC REGURGITATION
Sandier et al.™ were the first to quantify mitral or <2>I d e a»* T S V a n d F S V s h o u l d * determined
simul-aortic regurgitation by means of angiocardiography. taneously. However, angiographic contrast dye alters Angiographic determination of left ventricular total t h e circulatory dynamics after a few beat* followmg
' " J ^1 1 0" a n d h e n c e t h e r e l s n o s l e a dy s t a t e w h l c h
stroke volume (TSV) and forward stroke volume (FSV) ' " J ^1 1 0" a n d h e n c e t h e r e l s n o s l e a dy s t a t e w h l c h
stroke volume (TSV) and forward stroke volume (FSV) . ,
obtained by a different technique are compared to s h f° ^d e* ' f d u n n« t h e ' " ^ P t ' o n (15 to 25 seconds)
of a dye dilution curve or during the even longer Fick Supported by the Swus National Science Foundation. procedure for the estimation of cardiac output. Thus
dye dilution or Fick cardiac output is determined prior
to angiocardiography. Similar heart rates during
cardiac output estimation and angiocardiography are
generally taken as an indicator that the cardiovascular
dynamics have been stable although this is no absolute
proof that the amount of regurgitant volume was
unchanged during the two measurements.
Discrepan-cies in heart rate between cardiac output
determina-tion and angiocardiography occur mostly in patients
with atrial fibrillation. The error in determination of
cardiac output by Fick or indicator dilution has been
estimated to be between 5 and 10%'
31.
(3) Of crucial importance for the validity of the
combined technique based on the estimation of TSV
and FSV is the accuracy with which angiographic
TSV is determined. In 1966 Bartle and Sanmarco
1*
1have reviewed a number of studies in humans and
experimental animals without regurgitation which
compared angiographic stroke volume (SV-A) with
SV obtained by conventional Fick or indicator
dilution techniques. In the average angiocardiography
overestimated stroke volume by about 15%. We have
reassessed the accuracy of angiographic stroke volume
estimation in 16 patients with atypical chest pain or
coronary artery disease but without valvular
regurgi-tation or shunt. Fick cardiac output was determined
first. O2 consumption was determined in 1 minute
intervals during 10 minutes using a paramagnetic
method (Oxycon Analyzer Mijnhardt BV, Odijk,
Holland). After 5 minutes blood samples were
with-drawn from the pulmonary artery and the aorta. The
arterio-venous difference in O
2content was calculated
from the O
2saturations and the actual hemoglobin
assuming that 1 g hemoglobin contains 1-34 ml O2.
Heart rate was assessed when blood samples were
taken. Thereafter left ventricular biplane
cineangio-cardiography was performed in the right (RAO) and
left (LAO) anterior oblique projection and
end-diastolic and end-systolic volumes were calculated
using the area-length method"
1. Both volumes were
corrected by the regression equation proposed by
Wynne el al.
l6]for biplane RAO and LAO
cine-angiograms (V
Inlc= 0-989 V,,,, - 81 ml). Heart rate
averaged 64 bpm at both Fick and angiographic
determinations whereas the individual differences
varied between +7 and —10 bpm. SV-A averaged
98 ml and SV-Fick 83 ml resulting in an 18%
over-estimation of stroke volume by angiocardiography
(Fig. 1). The major reason for the overestimation of
SV-A appears to be an underestimation of end-systolic
volume although we were careful to trace always the
outermost contour of the end-systolic silhouette'
7'.
Corrections based on comparisons with casts'
6' had
i80r 1201-/V=I6 /"•O-73 P < 0 - 0 0 5 > •si 60 o
,-A
0
°
o 60 120 ) 1 a n^ (ml) (Wynne corrected) 180Figure 1 Comparison between stroke volume calculated
from Fick cardiac output (SVFick) and stroke volume obtained
by left ventricular biplane cineangiography (TSVlo,io) in 16
patients without shunt or valvular regurgitation. On average, cineangiography overestimated stroke volume by 18%, and overestimation became apparent especially when stroke volume exceeded 100 ml. TSVla,u> was calculated from
end-diastolic and end-systolic volumes corrected according to the regression equation of Wynne el al.m.
resulted in only minor reductions of calculated stroke
volume because the reduction of the end-diastolic
volume by the regression equation was only slightly
greater than that of the end-systolic volume.
TRICUSPID AND PULMONIC REGURGITATIONThe same principle as for the quantification of the
left-sided regurgitations by angiocardiography can be
applied to calculate tricuspid or pulmonic regurgitant
volume. However, right ventricular angiography is
rarely used to quantitate tricuspid regurgitation'
81and
we are not aware of studies which tried to assess
quantitatively pulmonic regurgitation.
In both tricuspid and pulmonic regurgitation
accurate quantification of right ventricular
end-diastolic and end-systolic volume is the prerequisite
to obtain the total right ventricular stroke volume.
Because right ventricular geometry is complex
correc-tion of the calculated volumes by a regression equacorrec-tion
established from volumetric measurements of casts is
of utmost importance. In the antero-posterior (AP)
and lateral (LAT) or RAO and LAO projections
calculated cast volumes correlated best with true
volumes when the multiple slices method was applied
for volumetric measurement. Whereas in the biplane
AP/LAT projection true volumes of the casts were
about 25% smaller than the calculated volumes'
81, the
Use of invasive techniques, angiography and indicator dilution
volumes correlated very closely in an almost 1:1 relationship when the casts were filmed in the RAO and LAO projections1'1. Hence proper positioning of
the patient within the orthogonal X-ray beams and use of the projection-specific regression equation for correction of calculated volumes (by Simpson's rule) are mandatory.
In patients without right-sided regurgitant lesions or left to right shunts Gentzler et al.m have compared right ventricular SV-A with the SV derived from dye dilution cardiac output measurements performed 30 seconds prior to angiography. Right ventricular volumes were calculated from AP/LAT cineangio-grams with the use of the multiple slices method and correction by the proper regression equation. An excellent correlation (r = 0-98) with almost identical mean values of the two stroke volumes was observed. Hence the authors have used the angio-indocyanine green method for quantitating tricuspid insufficiency in 6 cases181. In contrast to the biplane right ventricular
cineangiography the single plane RAO technique is less suitable for the assessment of tricuspid regurgita-tion because it overestimates right ventricular total stroke volume by about 20%'101.
Quantification of valvular regargitations by indicator dilution techniques
In the early 1960s dye dilution techniques for the quantification of mitral and aortic regurgitation have been developed by Lacy et al.[l" and the Mayo Clinic Group headed by E. H. Wood1 1 2"1 4'. The technique
is based on the recording of simultaneous dilution curves upstream and downstream to the incompetent valve following injection of the indicator just down-stream to this valve. If the two dilution curves are sampled by equisensitive devices (cuvette densito-meters for dye dilution, thermistors for thermodilu-tion) the regurgitant flow (OR) is determined by the following formula:
O F
where
O F = forward flow (cardiac ouput in 1 min"1),
OR = regurgitant flow (in 1 min"'),
Ad,,.,,, = area of the downstream dilution curve, Aup = area of the upstream dilution curve.
In the case of mitral regurgitation the indicator is injected into the left ventricle; Ado.,, corresponds to the dilution curve recorded in the descending aorta (AAO) and Anp to that recorded in the left atrium (ALA).
For the quantification of aortic regurgitation the indicator is injected into the aortic root; Adm cor-responds to the dilution curve recorded in the descend-ing aorta (AAO) and Aop to that recorded in the left
ventricle (ALV). The mitral regurgitation fraction (fm)
equals ALA/AAO and the aortic regurgitation frac-tion (fM) ALV/AAO- These relationships hold
regard-less whether only the valve in question or both left-sided valves are incompetent.
In the presence of combined mitral and aortic regur-gitation the combined regurregur-gitation fraction (fc) is
obtained by the sampling of simultaneous dilution curves in the left atrium (ALA) and the descending aorta (AAo) after indicator injection into the aortic
root[13]
fc ALA
AAO lm
Thus from the combined regurgitation fraction and the regurgitation fraction of one of the two incom-petent valves the regurgitation fraction of the second valve can be calculated. In patients with mitral and aortic regurgitation Bloomfield et al.ll>] have docu-mented a close correlation (r = 0-99) between fc and
the product of the individually determined regurgita-tion fracregurgita-tions across the mitral and the aortic valve.
ADVANTAGES AND LIMITATIONS
In contrast to the angiographic technique the dilution methods with upstream and downstream sampling allow simultaneous estimation of forward and regurgitant flow. The accuracy of the deter-mination of the forward cardiac output is well established131. Repeated estimations of fm and f.o are
possible because the indicators are devoid of cardio-vascular effects. The indicator dilution methods are, however, dependent on thorough mixing of the regurgitant volume with the untagged blood in the upstream chamber. If mixing is incomplete the area of the regurgitation dilution curve may vary sizably at different sampling sites in the upstream chamber112161. Especially in mild regurgitations
indicator concentration in the upstream chamber may be higher at sampling sites close to the insufficient valve than in more remote portions of the chamber.
COMPARISON OF THE INDICATOR DILUTION TECHNIQUE WITH AN INDEPENDENT METHOD FOR THE
QUANTIFICATION OF MITRAL AND AORTIC REGURGITATION
Experimental studies
compared the regurgitant flow obtained by dye dilution with the regurgitant flow determined by an independent method'1 2"1 4 1. In dogs with artificially
produced chronic mitral insufficiency the regurgitant flow by the indocyanine dye technique correlated closely (r = 0-96) with the regurgitant flow estimated by an hydraulic technique based on the mean systolic pressure gradient across the mitral valve (measured just before dye injection), the systolic regurgitant time and the defect area in the anterior mitral leaflet determined at necropsy*121. In dogs with acute
regurgitation a positive correlation existed between the aortic regurgitation fraction determined by dye dilution and the ratio of regurgitant volume/total stroke volume assessed from phasic recording of blood flow in the ascending aorta by an electromagnetic flowmeter11*1. The dye dilution regurgitation fraction
was slightly but systematically larger than the aortic regurgitation fraction obtained from the flowmeter recording. The overestimation of regurgitant flow was, however, small in mild and moderately severe aortic regurgitation and became more marked only at regurgitation fractions of 0-60 or more1141.
Comparison in patients with aortic or mitral regurgita lion
In 23 patients with isolated aortic and 23 patients with isolated mitral regurgitation fM and fm were
determined by thermodilution using upstream and downstream sampling with respect to the incom-petent valve according to the technique described previously''6t'71. The regurgitation fractions obtained
by thermodilution were compared with fM and fm
estimated by the combined angio-Fick method. Figure 2 shows an example of the recording of simultaneous dilution curves with equisensitive thermistors in the left ventricle and the descending aorta in a patient with aortic regurgitation. All patients with aortic regurgitation and 10/23 patients with mitral regurgita-tion were in sinus rhythm. The other 13 patients with mitral regurgitation had atrial fibrillation.
Fick cardiac output was determined first (see the previous section on quantification by angiocardio-graphy). O2 consumption (VO2) was measured in
36/46 patients by the Oxycon analyzer. In 10 patients VO2 was taken from a nomogram* assuming a basal * Documenta Geigy, Scientific Tables. 5th ed , Basle. 1955- 24]
LV
ECG
I - 5 s - I
Figure 2 Recording of simultaneous thermodilution curves with equisensitive thermistors (3-5 F) in the left ventricle and
in the descending thoracic aorta following injection of 10 ml icecold saline in a patient with aortic regurgitation. The thermistor in the left ventricle was advanced through a 8-5 F transseptal Broclcenbrough catheter. The other thermistor was advanced through a black Kifa catheter inserted into the left femoral artery. Cold saline was injected into the aortic root via a 8 F pigtail catheter inserted through the right femoral artery. The aortic regurgitation fraction (fM) was obtained from the ratio of the areas of the two thermodilution curves (areas in cm2). Aortic regurgitant flow (Q») was
calculated from the forward cardiac output (OF) and the ratio of the areas of the two thermodilution curves. In the figure, I is the point when 10 ml icecold saline was injected into the aortic root. LV is the left ventricle. AO thor desc is the descending thoracic aorta. HR is heart rate, and ECG is electrocardiogram.
Use of invasive techniques, angiography and indicator dilution
15
4 6 8 COF l c k(l mm"1)
( V 02 from tables)
Figure 3 Comparison between Fick cardiac output (COFick) calculated with measured O2 consumption and Fick cardiac output calculated with VO2 taken from a nomogram in 19
patients with aortic insufficiency (AI) and 17 patients with mitral insufficiency (MI). There was good agreement between the two values of cardiac output (r = 0-86). VO2 is the oxygen consumption.
metabolism of + 5 % of normal. We accepted these values from the nomogram because in 36 patients Fick cardiac output calculated with measured VO2
correlated closely (r = 086) with cardiac output calculated with VO2 taken from tables (Fig. 3).
After the Fick cardiac output estimation the thermodilution study was performed. On average, 3-3 pairs (upstream and downstream sampling) of thermodilution curves per patient were recorded. The areas of the curves were obtained by planimetry. Quantification for the cold injection was earned out by a model experiment using the same injection catheter and the same quantity of icecold saline (10 ml) as in the in vivo situation"6"1 7 1. Finally biplane
left ventricular cineangiography was performed in the RAO and LAO projections'". Heart rate in the 23 patients with aortic regurgitation averaged 73, 71 and 74 bpm during the three investigations. Individual differences of heart rate exceeded 10 bpm in 5 of the 69 possible paired comparisons. Heart rate in the 23 patients with mitral regurgitation averaged 77, 76 and 78 bpm during Fick, thermodilution and cine-angiography, respectively. In 3 of 69 paired compari-sons the difference in heart rate was larger than
10 bpm.
The left ventricular total stroke volume was
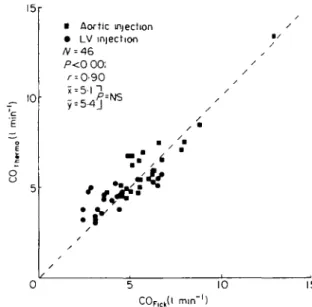
• Aortic injection • LV injection P<0 0O. r = 0-90 • • / / / / / / • 5 10 C0Flck(l mm"1) 15
Figure 4 Comparison between cardiac output determined
by thermodilution (CCWrmo) and cardiac output determined by the Fick method (COFICO in 23 patients with aortic regurgitation (AR, squares) and 23 patients with mitral regurgitation (MR, dots). In AR cold saline was injected into the aortic root and in MR into the left ventricle. Thermo dilution sampling was performed in the descending thoracic aorta. There was good agreement between the two techniques regardless of the injection site of the cold indicator.
obtained as the difference of the angiographic end-diastolic volume minus the end-systolic volume after both volumes had been corrected by the regression equation of Wynne el al.l6]. In addition the calculated total stroke volume was corrected for the 18% over-estimation by biplane cineangiography (see Fig. 1). The forward stroke volume (FSV) which was used to calculate angiographic regurgitant volume and re-gurgitation fraction was obtained as Fick cardiac output/heart rate existing at the time of cine-angiography. The choice to use FSV obtained by the Fick method rather than by thermodilution cardiac output was motivated by our aim to compare the indicator dilution technique with a truly independent (angio-Fick) method although there was no significant difference between cardiac output determined by thermodilution and that obtained by the Fick method (Fig. 4).
In the patients with isolated aortic regurgitation there was a positive correlation between fM evaluated
by thermodilution and fM determined by the
angio-Fick method, r = 0-59 (Fig. 5). Although the mean value of fx, by angio-Fick was somewhat higher than
0-8 £ 0-4
J
D A' Aortic 23 /°<&005 / • • x y1 D 0-59 0 46 }, 0-40 J / •NS D C1 /' \t D D ' ' D • D D D / / D • Q D n D 1 / / / /' s D D 0 8 O4 Wangio-Fick) o-sFigure 5 Comparison between aortic regurgitation fraction
(f.o) determined by thermodilution and f« obtained by the combined angiographic-Fick method in 23 patients with aortic regurgitation. For the calculation of f«, (angio-Fick) forward stroke volume (FSV) was calculated from Fick cardiac output (COFIOI) divided by heart rate existing at angiography (HR.a|io). We used this particular heart rate in
order to compensate for differences (although small) between heart rate during Fick and during angiography. It was assumed that forward cardiac output remained stable dunng the small variations of heart rate. The total angiographic stroke volume (TSV) was calculated from end-diastolic and end-systolic volumes corrected according to the Wynne regression equation161; the value obtained was reduced in accordance with the average overestimation (18%) of stroke volume by angiography as shown in Fig. 1.
The mean values of f« (thermo) and f,o (angio-Fick) were
not significantly different, although there was a tendency for f«, (angio-Fick) to be larger than fM (thermo). There was
only a fair correlation (r - 0-59) between the two measure-ments. In one patient aortic regurgitation was missed by the combined angio-Fick method.
that of f.o determined by thermodilution the
differ-ence was not significant. In the patients with isolated mitral regurgitation there was also a positive correla-tion between fm as determined by thermodilution and
fm assessed by angio-Fick, the r value being 0-71 (Fig.
6); fm by thermodilution was, however, significantly
smaller than fm obtained by angio-Fick.
COMPARISON OF TOTAL LEFT VENTRICULAR STROKE VOLUME DETERMINED BY THERMODILUTION AND C1NEANG1OGRAPHY IN PATIENTS WITH COMBINED AORTIC AND MITRAL REGURGITATION
In 18 additional patients with combined aortic and
O Mitral ® Atnal fibrillation N -- 23 r = 0-71 ~P.0OOS J
o°,-e
/ o
0/ '& ®° 0 4 fm(ongio-Fick) 0-8Figure 6 Comparison between mitral regurgitant fraction
(fm) determined by thermodilution and fm determined by the
angio-Fick method in 23 patients with isolated mitral regurgitation. The forward stroke volume (FSV) and the left ventricular angiographic total stroke volume (TSV) were determined as outlined in Fig. 5. There was a positive correlation between the two measurements although (m determined by angio-Fick was significantly larger than fm
estimated by thermodilution. In one patient mitral regurgita-tion was missed by the combined angio-Fick technique. (Results for patients in atrial fibrillation are indicated by a circle with a cross.)
mitral regurgitation f^, and fm were determined
individually by thermodilution. In 6 of the 18 patients atrial fibrillation was present. First it was evaluated whether cardiac output determined from the area of the thermodilution curve in the descending aorta was different when cold injection occurred in the aortic root rather than in the left ventricle. As demonstrated in Fig. 7 forward cardiac output was uninfluenced by the site of injection of the indicator. After having determined the individual regurgitations across the aortic and the mitral valves, total left ventricular stroke volume was calculated. The two values obtained in an individual patient according to the cardiac output determination following cold injection into the aortic root or the left ventricle were averaged. These mean values showed a good correlation with left ventricular total stroke volume determined by biplane cine-angiography (Fig. 8). A comparison of regurgitation fractions between the two techniques could not be performed because individual regurgitations cannot be quantified by the angio-Fick method in patients with combined valvular lesions.
Use of invasive techniques, angiography and indicator dilution \= 8 to r u V. c c E | o o 8-G 6 0 4 0 2 0 ' = 091 i=4 8 y=4 9 / /'o o / o / ' O , ' '
o V °
0-2 0 4 0 6C 0t h w m !( l min"'), supra-aortic iniection
Figure 7 Comparison between cardiac output obtained by
thermodilution following indicator injection into the left ventricle and cardiac output by thermodilution following indicator injection into the aortic root in 18 patients with combined mitral and aortic regurgitation.
There is an excellent agreement (r = 0-91) between the two measurements. Hence the estimation of forward cardiac output was uninfluenced by the site of indicator injection.
COMMENTS ON THE COMPARISON OF THERMODILUTION WITH CINEANGIOGRAPHY FOR THE QUANTIFICATION OF VALVULAR REGURGITATIONS IN MAN
As outlined above similar values of f
Mwere
obtained by thermodilution and the angio-Fick
method although the correlation between the two
techniques was at best fair. In the patients with
isolated mitral regurgitation f
mwas significantly
larger with angio-Fick than with thermodilution.
Several factors may be responsible for these findings.
First the comparison between the two independent
techniques was not done simultaneously. For large
cineangiographic total stroke volumes, the 18%
correction we have performed according to the
average difference observed between angiographic
and Fick derived stroke volume in patients without
valvular regurgitation or shunt was probably too
small because it is evident from Fig. 1 that
over-estimation by angiography was more marked at larger
stroke volumes. This would have resulted in an
over-estimation of angiographic regurgitation fractions.
Another problem includes angiographic beat selection
in atrial fibrillation. The total stroke volume of the
chosen beat may not be the same as during the
inscription of the thermodilution curves despite good
agreement between the average heart rate during
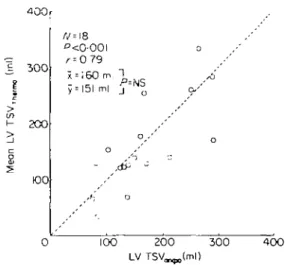
400r E 300 200 KK) /V=18 ° < 0 - 0 0 l ' = 0 79 x = I60 m, T y = !5l ml j 100 200 300 4 0 0
Figure 8 Comparison between left ventricular total stroke
volume determined by thermodilution and left ventricular total stroke volume determined by biplane cineangiography in 18 patients with combined mitral and aortic regurgitation. With thermodilution, mitral and aortic regurgitation frac-tions were determined individually for both valves in each patient. In the individual patients left ventricular total stroke volume (LV TSV) determined by thermodilution represents the mean of two calculations, one from the cardiac output obtained after indicator injection into the aortic root and one from the cardiac output measure following indicator injection into the left ventricle. The LV TSVu*,™. agTeed quite well with the LV T S V ^ ^ (r = 0-79). This may be taken as indirect evidence of the validity of the thermodilution technique for assessing quantitatively aortic and mitral re-gurgitations. LV TSVU f i o was corrected according to the
Wynne regression equation161; the value obtained was
re-duced in accordance with the average overestimation (18%) of stroke volume by angiography (see Fig. I).
thermodilution and the heart rate corresponding to
the cycle interval preceding the beat chosen for
estimation of angiographic stroke volume. Errors in
the quantification of mitral regurgitation with
thermo-dilution may also have occurred and are likely to be
linked to errors in left atrial indicator concentration
sampling due to inadequate mixing. Finally, we have
to consider that in Fick cardiac output determination
of patients with atrial fibrillation average heart rate
may not correspond with average forward stroke
volume. Alternatively indirect evidence for the validity
of thermodilution for the quantification of
regurgita-tion may be derived from the good agreement of total
left ventricular stroke volume estimated by
thermo-dilution with total angiographic stroke volume in
patients with combined aortic and mitral
regurgita-tion.
RECENT DEVELOPMENT OF EQUIPMENT FOR THE ESTIMATION OF MITRAL AND AORTIC REGURGITATION BY THERMODILUTION
The thermodilution studies outlined above required
the insertion of two thermistor probes (3-5 F) one
into the left atrium and/or the left ventricle via a
transseptal 85 F Brockenbrough catheter and the
other into the descending aorta via the retrograde
femoral route"
7'. Cold saline was injected into the
left ventricle or aortic root through a pigtail catheter
inserted via the other femoral artery. Recently this
procedure was simplified
1'
81. A double-lumen
poly-ethylene pigtail catheter (8 F, 100 cm) is inserted into
the right femoral artery and is advanced to the left
ventricle or aortic root. Through the distally ending
lumen (0-8 mm
2) cold saline is injected. Through the
second lumen (0-8 mm
2) which opens 50 cm behind
the catheter tip a thermistor probe (3 F, teflon) is
advanced into the descending aorta for the recording
of thermodilution curves. The second thermistor is
again inserted via the transseptal Brockenbrough
catheter.
Summarizing remarks
From this summary on the angiographic and
indicator dilution techniques for the quantification
of valvular regurgitations, it may be concluded that:
(1) both techniques are based on sound principles;
(2) they have been used so far almost exclusively for
the quantification of mitral and aortic regurgitation
and (3) they have several drawbacks:
The angiographic technique tends to overestimate
total left ventricular stroke volume and hence
regurgi-tation fraction; it requires the estimation of forward
stroke volume by another non-simultaneous
tech-nique with its own sources of error; it cannot be used
for the quantification of individual valvular
regurgi-tations when both the aortic and the mitral valves are
incompetent and alterations of cardiovascular
dynamics following contrast dye injection limit
repeated angiographic quantifications of
regurgita-tion. Thus the place of the angiographic technique as
the gold standard for the quantification of valvular
regurgitations may be debated.
The indicator dilution techniques (indocyanine
green, thermodilution) are crucially dependent on
thorough mixing of the regurgitant volume with the
blood in the upstream chamber. Thus the recorded
indicator concentrations may vary according to the
specific sampling site within this chamber. Slight
regurgitations into a large upstream chamber
(especially the anatomically ill-defined upstream
mixing chamber in mitral regurgitation) are most
likely to be erroneously assessed by dilution
tech-niques.
References
[ I ] Sandier H. Dodge HT, Hay RE, Rackley CE. Quantitation of valvular insufficiency in man by angiocardiography. Am Heart J 1963; 65: 501-13. [2] Wood EH. Speculations concerning present and future
developments in indicator-dilution technics In: Sym-posium on use of indicator-dilution technics in the study of circulation Am Heart Ass Monograph 4. New York, 1962: 569-81
[3] Grossman W. Blood flow measurement: The cardiac output In Cardiac catheterization and angiography, 2nd edition. Philadelphia- Lea and Febiger, 1980-89-102
[4] Bartle SH, Sanmarco ME. Comparison of angio-cardiographic and thermal washout technics for left ventricular volume measurement. Am J Cardiol 1966;
18. 235-52.
[5] Eichhorn P, Grimm J, Koch R, Hess O, Carroll J, Krayenbuehl HP Left ventricular relaxation in patients with left ventricular hypertrophy secondary to aortic valve disease. Circulation 1982, 65: 1395-404. [6] Wynne J, Green LH, Mann T, Levin D, Grossman W.
Estimation of left ventricular volumes in man from biplane cineangiograms filmed in oblique projections. Am J Cardiol 1978, 41: 726-32.
[7] Sandier H. Dimensional analysis of the heart. A review Am J Med Sci 1970, 260: 56-70.
[8] Gentzler RD, Briselli MF, Gault JH. Angiographic estimation of right ventricular volume in man. Circulation 1974; 50- 324-30.
[9] Hess OM, Goebel NH, Gnmm J, Krayenbuehl HP Accuracy of angiographic right ventricular volume determination. In: Kaltenbach M, Lichtlen P, Balcon R. Bussmann WD, cds. Coronary heart disease Stuttgart. G. Thieme, 1978: 227 32.
[10] Ferlinz J. Right ventricular performance in essential hypertension. Circulation 1980; 61: 156-62.
[ I I ] Lacy WW, Goodson WH, Wheeler WG, Newman EV. Theoretical and practical requirements for the valid measurement by indicator-dilution of regurgitant flow across incompetent valves. Circ Res 1959, 7: 454-60. [12] Newcombe CP, Sinclair JD, Donald DE, Wood EH.
Detection and assessment of mitral regurgitation by left atnal indicator-dilution curves. Circ Res 1961; 9:
1196-207.
[13] Armelin E, Michaels L, Marshall HW, Donald DE, Cheesman RJ, Wood EH. Detection and measurement of experimentally produced aortic regurgitation by means of indicator-dilution curves recorded from the left ventricle. Circ Res 1963; 12: 269-90.
[14] Malooly DA, Donald DE, Marshall HW, Wood EH. Assessment of an indicator-dilution technic for quantitating aortic regurgitation by electromagnetic flowmeter Circ Res 1963; 12: 487-507.
[15] Bloomfield DA, Battersby EJ, Sinclair-Smith BC. Use of indicator dilution techniques in measuring combined aortic and mitral insufficiency. Circ Res 1966; 18: 97 100.
Use of invasive techniques, angiography and indicator dilution
[16] Krayenbuhl HP. Die DynamiW und Kontralttilitat des dilutionsmethode. Arch Kreislaufforschg 1969; 58: linken Ventrikels. Bibl Cardiol 23. Basel: S Karger, 1-35.
1969:1-182. [18] Krayenbuhl HP, Niederhauser W, Grimm J, Hirzel H, [17] Krayenbuhl HP, Rutishauser W, Wirz P, Noseda G, Hess O. Ein neuer Thermodilutionskatheter zur Luthy E. Das enddiastolische Volumen der lintcn Bestimmung des Herzminutenvolumens im arterieUen Kammer beim Menschen, bestimmt mit der Thermo- System. Schweiz med Wochenschr 1984; 114: 1604-6.