LETTER TO THE EDITOR
Comments on profession and gender statistics of the EANM
membership database 2007
Claudine Als&Andreas G. Andiel
Received: 8 January 2008 / Accepted: 8 January 2008 / Published online: 29 February 2008 # Springer-Verlag 2008
Dear Sir,
In order to obtain a better insight into membership com-position and to anticipate developments to come, the European Association of Nuclear Medicine (EANM) each year sends a membership form to members. In 2007, the form for the first time also included gender reporting. It has to be taken into account, however, that EANM membership is not mandatory even if the EANM is a scientific organisation representing the interests of European profes-sionals in the field. Based on a comparison of members’ statistics between national societies and the EANM, one may suppose that the EANM represents about one third to half of all nuclear medicine professionals in Europe. We herewith report and comment on the 2007 profession and gender statistics of the EANM (Membership Database as of April 18, 2007).
Profession
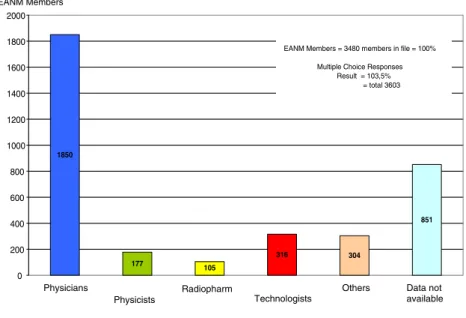
A total of 3,480 members (100%) are filed in the EANM Membership Database 2007. The results show that most
EANM members are physicians (Fig. 1). Technologists
rank in second place followed by physicists and radio-pharmacists. Within all 3,480 members, there are 1,850 physicians (53.2%), 316 technologists (9%), 177 physicists (5%), 105 radiopharmacists (3%) and 304 other medical professionals (8.7%). The 851 instances of data not avail-able can either account for corporate (n=13) and society (n=34) members or for individual members for whom professional data were not available (n=804).
In addition to the main profession, the membership form inquired on an additional specialisation, shown as the
category “Others” (Fig. 1). Members who are
profession-ally active also outside the field of Nuclear Medicine were additionally listed in the category“Others”. For this reason, a total of 3,603 answers or professional categories (103.5%) were indicated for the 3,480 EANM members. The predominant part of“Others” is represented by radiologists (n=100) followed by industrial researchers (n=71) and by consultants (n=57). Technologists are not mentioned here because their category has no further professional split-up.
Gender
Over two thirds (67%) of the 3,480 EANM members are
men and 31% are women (Fig. 2). Neither profession nor
gender is attributed to the 47 society or corporate members; they are reflected in the non-gender category (2%), which contains also 30 individual members for whom gender has not been specified.
Out of all 3,480 EANM members, 85% of men and 65%
of women are ordinary members. Figure 3 illustrates the
sex distribution (including also non-gender members) as related to membership types. The different shades of blue identify the main membership categories (ordinary, junior and associate members). Ordinary members constitute the Eur J Nucl Med Mol Imaging (2008) 35:1026–1029
DOI 10.1007/s00259-008-0737-x
C. Als (*)
Department of Nuclear Medicine, Clinique Ste Thérèse, Luxembourg 2763, Luxembourg
e-mail: [email protected] C. Als
Institute of Clinical Chemistry, Inselspital, University of Bern, 3010 Bern, Switzerland
A. G. Andiel
Executive Secretariat, EANM, Hollandstrasse 14,
largest share (n=2747); there is a high predominance of 1,987 (72%) men against 760 (28%) women. Interestingly, sex distribution among junior members (n=182) is by and
large similar (males n=93, females n=89; Fig. 4).
Tech-nologists are made up by about twice as much women (65%) than men (35%).
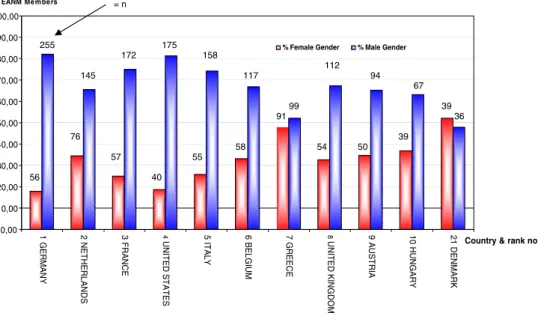
Figure 5 shows the percentages of women and men
among EANM members from the top-ten countries, i.e., the ten countries with the highest member representation within the EANM (plus Denmark: rank 21). Interestingly, Greece (rank 7, 47.9%) and Denmark (rank 21, 52%) are the countries with the highest percentages of female members. On the opposite, the lowest female part is found in the US American group (rank 4) with only 18.6% of women. Gender representation may, thus, vary widely from one member country to another within the EANM.
Discussion
The 2007 socio-professional EANM member data show that about two thirds are male and about one third are female. Women are underrepresented as nuclear medicine physicians (one third women) and overrepresented as technologists (two thirds women). Gender distribution is more equilibrated in the other represented professions
(malesn=334, females n=283, non-gender n=2). The data
illustrate that up to now, the main EANM target group has consisted of male physicians. However, based on the balanced numbers of male and female junior physicians, a raise of female membership can be anticipated. The future generation of nuclear medicine specialists might, thus, progressively be represented by about as many women and men. This trend is illustrated by the observation of
‘female only’ sessions during the 2007 EANM Congress in Copenhagen where chairs and speakers were all female.
Comparison between EANM trends and demographic trends concerning female physicians in Europe in general is
quite interesting (Table1). Compared to 64‘Swiss’ EANM
members in 2007, the overall Swiss demographic medical data (http://www.fmh.ch(members statistics)), for instance, show an increasing trend of women physicians from 28.4% in 1999 to 33.6% in 2007 and a possibly increasing trend of female nuclear medicine physicians from 13% to 19% during the same time period. As another example, compared
to 270 ‘German’ EANM members in 2007, Germany’s
overall medical population (http://www.bundesaerztekammer.
de (Ärztestatistik)) shows an increasing trend from 26%
female physicians in 1997 to 30.6% in 2007. French
demographic data in 2007 (http://www.web.ordre.medecin.
fr) moreover show that the women part is higher in younger age categories. Other European countries show similar
Female 31% Non Gender 2% Male 67% Proportion of Gender
Fig. 2 Gender distribution within all EANM members in 2007 1850 851 304 316 177 105 0 200 400 600 800 1000 1200 1400 1600 1800 2000
EANM Members = 3480 members in file = 100% Multiple Choice Responses
Result = 103,5% = total 3603
Physicians
Physicists
Others Data not available Technologists
Radiopharm EANM Members
Fig. 1 Professional background of EANM members in 2007
gender trends over 10 years. Within the different specialisa-tion fields of medicine, however, female representaspecialisa-tion may vary widely from 2% in urology, 4% in surgery, 22% in radiology, 52% in general medicine and up to 57% in pedo-and adolescent psychiatry, as exemplified in Switzerlpedo-and in 2007 (http://www.fmh.ch(members statistics)).
Representation of women within working groups, com-mittees and the Executive Committee of the EANM is variable. Concerning high executive EANM functions, the EANM up to now has had only one woman as an EANM President and only two women as EANM Congress Presidents. In 2001–2003, the EANM Executive
Commit-0 500 1000 1500 2000 2500
Associate Member Corporate Member Emeritus Member Emeritus Member EJNMMI
Honorary Member Junior Member Ordinary Member Society Member
Technologist Technologist EJNMMI
Gender by Member Type
Non Gender
Women
Men
EANM Members
Fig. 3 Gender distribution and member status of EANM members in 2007
Fig. 4 Distribution of ordinary, junior and associate members of the EANM within the professional subgroups of physicians, physicists, radiopharmacists and other professions
tee has consisted of 100% of men, whereas from 2004 to 2008 is has consisted of one woman and of six men.
Within the populations of medical students in most European medical universities as well as among those who finish medical school, representation of women is around 50% or even above 50%. The discrepancy between a recent trend of a high representation of women in the student community and an underrepresentation of women exercis-ing as physicians shows that a substantial part of them do
not work as a physician. However, a positive trend is emerging with the age pyramid. Efforts ought to be undertaken to make medicine and especially nuclear medicine training programmes and professional environ-ment attractive for young colleagues, women and men.
Besides, as technologists make up for 10% of the EANM membership and rank on the second place within the professional categories, their status within the EANM should be further studied.
Table 1 Examples of increasing percentage of women physicians in Europe in 2007
Country Percentage of women
physicians in general medicine (%) Related absolute numbers Percentage of women physicians in nuclear medicine (%) Related absolute numbers Switzerland 2007 33.6 9,682 out of 28,812 19 1999 28.4 13
Germany 2007 30.6 124,354 out of 406,974 27.6 264 out of 955
1997 26
France 2006a 39.2 32
aWomen part is higher in younger age categories
% EANM Me mbe rs 0 10,00 20,00 30,00 40,00 50,00 60,00 70,00 80,00 90,00 100,00 e r % Ma le nde r % EANM Me mbe rs 0,00 10,00 20,00 30,00 40,00 50,00 60,00 70,00 80,00 90,00 100,00
1 GERMANY 2 NETHERLANDS 3 FRANCE 4 UNITED STATES 5 ITALY 6 BELGIUM 7 GREECE 8 UNITED KINGDOM 9 AUSTRIA 10 HUNGARY 21 DENMARK
Country & rank no. % Female Gender % Male Gender
255 145 172 175 158 117 99 112 94 67 36 56 76 57 40 55 58 91 54 50 39 39 = n
Fig. 5 Gender distribution among 2007 EANM members from the top-ten countries (the ten countries with the highest absolute member numbers, in decreasing order), plus from Denmark