Astronomical time scale for the Middle Oxfordian to Late
Kimmeridgian in the Swiss and French Jura Mountains
A
NDRÉS
TRASSERKey words: Astronomical time scale, Cyclostratigraphy, Oxfordian, Kimmeridgian, Jura Mountains
ABSTRACT
Detailed investigation of facies and sedimentary structures reveals that, during the Middle Oxfordian to Late Kimmeridgian, the shallow carbonate platform of the Swiss and French Jura Mountains recorded high-frequency sea-level fluctuations quite faithfully. The cyclostratigraphic analysis within the estab-lished biostratigraphic and sequence-chronostratigraphic framework implies that the resulting hierarchically stacked depositional sequences formed in tune with the orbital cycles of precession (20 kyr) and eccentricity (100 and 400 kyr). The astronomical time scale presented here is based on the correlation of 19 platform sections and 4 hemipelagic sections from south-eastern France where good biostratigraphic control is available. The cyclostratigraphic inter-pretation suggests that the interval between sequence boundaries Ox4 and Kim1 (early Middle Oxfordian to earliest Kimmeridgian) lasted 3.2 myr and that the Kimmeridgian sensu gallico has a duration of 3.2 to 3.3 myr. The as-tronomical time scale proposed here is compared to time scales established by other authors in other regions and the discrepancies are discussed. Despite these discrepancies, there is a potential to estimate the durations of ammonite zones and depositional sequences more precisely and to better evaluate the rates of sedimentary, ecological and diagenetic processes.
ZUSAMMENFASSUNG
Die detaillierte Untersuchung von Fazies und Sedimentstrukturen zeigt, dass während des Mittleren Oxfords bis zum Späten Kimmeridge die flache Karbo-natplattform des schweizerischen und französischen Juras hochfrequente Mee-resspiegelschwankungen recht genau aufzeichnete. Die zyklostratigraphische Analyse innerhalb des bestehenden biostratigraphischen und sequenz-chro-nostratigraphischen Rahmens deutet darauf hin, dass sich die resultierenden hierarchisch gestapelten Ablagerungssequenzen im Einklang mit den orbita-len Zykorbita-len der Präzession (20 ka) und der Exzentrizität (100 und 400 ka) bil-deten. Der hier vorgestellte astronomische Zeitmassstab beruht auf der Kor-relation von 19 Plattform-Profilen und 4 hemipelagischen Profilen aus Süd-ost-Frankreich, wo eine gute biostratigraphische Kontrolle vorhanden ist. Ge-mäss der zyklostratigraphischen Interpretation dauerte das Intervall zwischen den Sequenzgrenzen Ox4 und Kim1 (frühes Mittleres Oxford bis frühestes Kimmeridge) 3.2 ma; das Kimmeridge sensu gallico hat eine Dauer von 3.2 bis 3.3 ma. Der hier vorgeschlagene astronomische Zeitmassstab wird mit Mass-stäben anderer Autoren in anderen Regionen verglichen und die Diskrepan-zen werden diskutiert. Trotz dieser DiskrepanDiskrepan-zen ergibt sich das Potential, die Dauer von Ammonitenzonen und Ablagerungssequenzen präziser abschätzen und die Geschwindigkeit von sedimentären, ökologischen und diagenetischen Prozessen besser evaluieren zu können.
radiometric dating, then a time resolution of 20’000 years (cor-responding to the cycle of the precession of the equinoxes) can optimally be obtained (Hilgen et al. 2004; Strasser et al. 2007; see also examples in D’Argenio et al. 2004).
In this paper, an astronomical time scale covering the Mid-dle Oxfordian to Late Kimmeridgian interval of the Swiss and French Jura Mountains is developed. There, the Oxfordian and Kimmeridgian have been studied extensively since the 19th century (e.g., Thurmann 1830; Heer 1865). Lithology and bio-stratigraphy of these mostly shallow-water carbonates are well known (e.g., Thalmann 1966; Bolliger & Burri 1970; Trümpy 1980; Gygi & Persoz 1986; Enay et al. 1988; Gygi 1995; Gygi 2000). Furthermore, several high-resolution
sequence-strati-Introduction
Since the early days of Earth Sciences there has been a quest for measuring geological time. Relative time scales have been established through biostratigraphy and are constantly being refined. Radiometric dating furnishes numerical ages but error margins may still be large. Astronomical time scales use the sedimentary or geochemical record of insolation changes and are directly linked to orbital periodicities with known dura-tions (e.g., Fischer et al. 2004). Except for the Quaternary where other dating methods give yearly, decadal, or centennial time resolutions, astronomical time scales offer the highest res-olution available for the deep geologic past. If the sedimentary systems were sensitive enough to record orbitally induced cli-mate changes, and if the general time frame is constrained by
Department of Geosciences, University of Fribourg, Pérolles, 1700 Fribourg, Switzerland. E-mail: andreas.strasser@unifr.ch DOI 10.1007/s00015-007-1230-4
graphic and cyclostratigraphic studies have been undertaken in the last decade (e.g., Pittet 1996; Pittet & Strasser 1998a, b; Mouchet 1998; Dupraz 1999; Strasser et al. 2000; Colombié 2002; Hug 2003; Jank 2004; Rameil 2005; Colombié & Strasser 2005; Jank et al. 2006; Colombié & Rameil 2007). The present work is a synthesis based on 23 sections (Fig. 1; Table 1) logged and interpreted by Pittet (1996), Bühler (1997), Oswald (1998), Bard (1999), Dupraz (1999), Gsponer (1999), Jordan (1999), Rauber (2001), Colombié (2002), Hug (2003) and Rameil (2005). The purpose of this endeavour is to offer a time frame within which the rates of sedimentological, ecological and diagenetic processes can be evaluated with unprecedented precision.
Palaeogeographic and stratigraphic setting
The studied time interval covers the Middle and Late Oxfor-dian, the Kimmeridgian (sensu gallico) and the earliest Tithon-ian. During those times, in the original position of today’s Jura Mountains, a shallow platform extended between the Paris Basin to the north and the Tethys Ocean to the south. Palaeo-latitude was about 26 to 27 oN (Dercourt et al. 1993). Lagoonal facies rich in carbonate-producing organisms, coral patch-reefs and ooid shoals testify warm, subtropical waters. Water depths varied between a few tens of metres in the open lagoons to in-tertidal and supratidal along the coasts of low-lying islands.
Controlled by synsedimentary tectonics, epicontinental basins developed mainly to the south of the platform (Allenbach 2001). Periodically, especially during Oxfordian times, silici-clastics originating from the Bohemian and the Central massifs were shed onto the platform and into the basins (e.g., Gygi & Persoz 1986; Pittet 1996), which implies generally more humid conditions. In the Kimmeridgian and Tithonian, siliciclastics are less abundant and evaporites occur, suggesting an evolu-tion towards a generally more arid climate (Hug 2003; Rameil 2005).
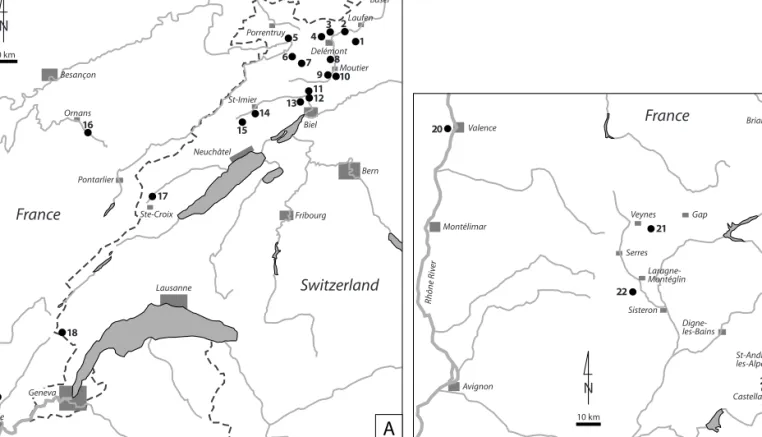
The platform facies of the Swiss and French Jura is repre-sented by 19 sections (Fig. 1), which include the St. Ursanne, Pi-choux, Vellerat, Balsthal, Courgenay, Reuchenette and Twannbach formations and their respective members (Gygi 1995; Fig. 2). The Wildegg Formation, characterised by lime-stone-marl alternations, tempestites and condensed intervals, was deposited in an epicontinental basin. Based on ammonites and mineralo-stratigraphic correlations, Gygi & Persoz (1986) and Gygi (1995) have established a solid biostratigraphic framework for these formations and members (Fig. 2A). Fur-thermore, Gygi et al. (1998) identified large-scale sequence boundaries, which correlate well with the ones recognized by Hardenbol et al. (1998) in several European basins. In order to additionally constrain the biostratigraphy, 4 sections from south-eastern France are integrated in this study (Fig. 1). They contain hemipelagic limestone-marl alternations and are well Fig. 1. Location of studied sections in the Swiss and French Jura (A) and in south-eastern France (B).
2 3 9 7 6 5 8 10 Delémont Moutier Biel Bern 14 St-Imier 4 Basel 1 Laufen 11 13 12 Neuchâtel 16 Ornans Besançon Lausanne Geneva 15 17 Ste-Croix Fribourg 18 Porrentruy N
France
Switzerland
10 km Pontarlier Bellegarde 19 Digne-les-Bains Sisteron Avignon Montélimar Valence Briançon Castellane 23 Gap 21 Serres 22 20 St-André-les-Alpes N 10 km Veynes Laragne-MontéglinFrance
Rhône R iv erA
B
dated by ammonites (Atrops 1982). All sections have been cho-sen for their relative completeness of the sedimentary record and for their unequivocal stratigraphic position (Fig. 2B). These are the prerequisites for the cyclostratigraphical analysis.
Material and methods
The sections presented here (Figs. 3–12) cover a total of 1969 metres, have been logged at cm-scale and are documented by a total of 2622 thin sections, polished slabs and marl washings. Where no samples were taken, the facies has been determined on the outcrop with a hand lens. Under the optical microscope or the binocular, microfacies have been analysed using the Dunham (1962) classification and a semi-quantitative estima-tion of the abundance of rock constituents (Fig. 3). Special at-tention has been paid to sedimentary structures and to omis-sion surfaces (Clari et al. 1995; Hillgärtner 1998). The sum of this sedimentological information is then used to interpret the depositional environments. For the sequence-stratigraphic in-terpretation of the facies evolution, the nomenclature of Vail et al. (1991) is applied.
In the platform sections, vertical facies changes define deepening-shallowing depositional sequences, which are hier-archically stacked (example in Fig. 3). Elementary sequences are the smallest units where facies evolution indicates a cycle of environmental change, including sea-level change (Strasser et al. 1999). In some cases, there is no facies evolution discern-able within a bed but marls or omission surfaces delimiting the bed suggest an environmental change (Strasser & Hillgärtner 1998). Commonly, 2 to 7 elementary sequences compose a small-scale sequence, which generally displays a deepening then shallowing trend and exhibits the relatively shallowest
fa-cies at its boundaries (Fig. 3). For example, birdseyes, micro-bial mats or penecontemporaneous dolomitization suggest tidal-flat environments, lithoclasts and black pebbles imply erosion of previously exposed and consolidated sediment (Strasser & Davaud 1983), and detrital quartz and plant frag-ments indicate input from the hinterland during low relative sea level. In some cases, however, no changes in water depth are implied but a change to more open-marine fauna and an increase in energy points to a transgressive event (e.g., at metre 13.8 in Fig. 3). There, a transgressive surface delimits the small-scale sequence rather than a sequence boundary sensu Vail et al. (1991). Four small-scale sequences make up a medium-scale sequence, which again displays a general deep-ing-shallowing trend of facies evolution and the relatively shal-lowest facies at its boundaries. Furthermore, the elementary sequences are thinner around the small-scale and medium-scale sequence boundaries, which suggests reduced accommo-dation. Thick elementary sequences in the central parts of these sequences imply higher accommodation. The fact that most of the small-scale and medium-scale sequence boundaries can be followed over hundreds of kilometres points to an allo-cyclic control on sequence formation. However, also autoallo-cyclic processes (such as lateral migration of sediment bodies or re-activation of high-energy shoals) occurred and are recorded mainly on the level of the elementary sequences (Strasser 1991; Strasser & Védrine 2007).
The basinal sections feature limestone-marl alternations, whereby one limestone-marl couplet is considered to corre-spond to an elementary sequence. In some cases, these are grouped into bundles of 5 that define small-scale sequences, which again build up medium-scale sequences. In other cases, the hierarchical stacking is not evident.
No. of
Section Name Location Stratigraphic interval Author(s)
1 Les Champés Along forest road SE of Bärschwil Middle Oxfordian to Early Kimmeridgian Rauber (2001)
2 Liesberg In quarry of cement factory Late Oxfordian Hug (2003)
3 Mettemberg-Soyhières Along road from Mettemberg to Soyhières Late Oxfordian Hug (2003)
4 Vorbourg Along road above Vorbourg chapel Middle to Late Oxfordian Pittet (1996)
5 St-Ursanne Along footpath and in cliff above St-Ursanne Middle to Late Oxfordian Oswald (1998)
6 Tabeillon Along path towards Sceut Dessous Middle Oxfordian Bühler (1997), Dupraz (1999)
7 Pichoux Along road between Undervelier and Sornetan Middle Oxfordian to Late Kimmeridgian Pittet (1996), Colombié (2002)
8 Hautes Roches Along forest path south of the village of
Hautes Roches Middle to Late Oxfordian Pittet (1996), Dupraz (1999)
9 Gorges de Court Along road between Moutier and Court Middle to Late Oxfordian Pittet (1996), Colombié (2002), Hug (2003)
10 Moutier Borehole SE of Moutier Middle to Late Oxfordian Pittet (1996), Dupraz (1999)
11 La Chamalle Along forest road to La Chamalle farm Late Oxfordian Jordan (1999)
12 Péry-Reuchenette In quarry of cement factory Middle Oxfordian to Late Kimmeridgian Pittet (1996), Colombié (2002), Hug (2003)
13 Forêt de Châtel Along forest road Late Oxfordian Gsponer (1999)
14 Savagnières Along road between St-Imier and Val-de-Ruz Middle to Late Oxfordian Pittet (1996)
15 Pertuis Along road from Dombresson to Pertuis Middle to Late Oxfordian Pittet (1996)
16 Châteauvieux-les-Fossés Along road from Vuillafans to Longeville Middle Oxfordian to Early Kimmeridgian Bard (1999)
17 Noirvaux Along road from Buttes to Ste-Croix Late Kimmeridgian to Late Tithonian Rameil (2005)
18 La Dôle Along base of cliff below La Dôle summit Late Kimmeridgian to Late Tithonian Rameil (2005)
19 Cirque des Avalanches Along forest road N of Champfromier, below
Le Truchet Middle Kimmeridgian to Early Tithonian Rameil (2005)
20 Crussol In quarries at Montagne de Crussol Kimmeridgian Colombié (2002)
21 Châteauneuf-d’Oze Along road between Veynes and
Moulin-du-Pied-de-la-Poua Kimmeridgian Colombié (2002)
22 Gorges de la Méouge Along road between Barret-le-Bas and
Laragne-Montéglin Late Oxfordian to Late Kimmeridgien Colombié (2002)
23 Clue de Taulanne Along road from Barrème to Col des Leques Late Kimmeridgian to Early Berriasian Rameil (2005)
Each section is first interpreted independently (example in Fig. 3). Within the framework given by biostratigraphy and large-scale sequence stratigraphy (Fig. 2), the sections are then correlated on the level of small-scale and medium-scale depo-sitional sequences. Some small- or medium-scale sequence boundaries defined in an isolated section may have to be rein-terpreted and shifted by one or two elementary sequences in order to obtain a best-fit solution that satisfies the
sedimento-logical observations as well as the general stratigraphic frame. In several cases it is not possible to attribute a small-scale or medium-scale sequence boundary to a specific bed surface: a sequence-boundary zone is then introduced, which covers the interval of relatively lowest accommodation space (Montañez & Osleger 1993; Strasser et al. 1999). The same holds for max-mum-flooding situations, where highest accommodation gain on the shallow platform is not always translated by a specific Fig. 2. (A) Chronostratigraphy biostratigraphy and lithostratigraphy of the studied interval. Litho- and biostratigraphic scheme after Gygi (1995, 2000), with circles indicating where biostratigraphically significant ammonites have been found. Sequence boundaries after Hardenbol et al. (1998) and Gygi et al. (1998). Note that the time scale is not indicated (compare with Fig. 13). Fm: formation; Mb: member. (B) Stratigraphic range of studied sections.
Chrono-strat.
Kimme- ridgian
Oxfordian
Lithostratigraphy (Swiss Jura) Biostratigraphy Autissiodorensis Eudoxus Transversarium Bifurcatus Bimammatum Planula Platynota Hypselocyclum Divisum Acanthicum Antecedens Luciaef. / Parandieri
Rotoides / SchilliStenocycloides Grossouvrei
Hypselum Hauffianum Bimammatum
Densiplicatum / Vertebr. ammonite zones subzones
Reuchenette Fm Lower Virgula Mb Banné Mb St. Ursanne Fm Vellerat Fm Courgenay Fm Bärschwil Fm Balsthal Fm Vorbourg Mb Röschenz Mb Steinebach Mb Bure Mb Oolithe rousse
La May Mb Porrentruy Mb Liesberg Mb Holzfluh Mb Günsberg Mb Sequence boundaries Galar Ox 3 Ox 8 Ox 7 Ox 6 Ox 5 Ox 4 Kim 1 Kim 3 Kim 2 Kim 4 Kim 5 Pichoux Fm Birmenstorf Mb (condensed) Verena Mb Effingen Mb Wildegg Fm Laufen Mb Hauptmumienbank Mb (hiatus) Birmenstorf Mb Upper Virgula Mb Ti
tho- nian Hybonotum Ti 1 Twannbach Fm
Plicatilis Chrono-strat. Kimme- ridgian Oxfordian Biostratigraphy Autissiodorensis Eudoxus Transversarium Bifurcatus Bimammatum Planula Platynota Hypselocyclum Divisum Acanthicum Antecedens Luciaef. / Parandieri Rotoides / Schilli Stenocycloides Grossouvrei Hypselum Hauffianum Bimammatum Densiplicatum / Vertebr. ammonite zones subzones
Sequence boundaries Galar Ox 3 Ox 8 Ox 7 Ox 6 Ox 5 Ox 4 Kim 1 Kim 3 Kim 2 Kim 4 Kim 5 Ti th o-nian Hybonotum Ti 1 Plicatilis
A
B
Studied sections (Switzerland and France)
1 2 3 4 5 6 7 8 9 10 11 12 13 14 15 16 17 18 19 20 21 22 23
platform basin
Planula
Fig. 3. Example of detailed facies analysis of a part of the Kimmeridgian in the Péry-Reuchenette section (compare with Fig. 10). Based on this analysis, deposi-tional environments, high-resolution sequence stratigraphy and cyclostratigraphy are interpreted (modified from Colombié 2002). For discussion refer to text.
Texture marls mudstone wackestone packstone grainstone m M W P G m M W P G Sedimentary Structures birdseyes bioturbation microbial mat laminations Facies
limestone with quartz limestone with dolomite peloids oncoids ooids lithoclasts black pebbles echinoderms foraminifera green algae bivalves gastropods ostracodes plant fragments Sequence stratigraphy SB TS MFD sequence boundary transgressive surface maximum-flooding deposits
quartz dolomite iron black pebbles lithoclasts peloids grapestones oncoids ooids ostracodes gastropods bivalves serpulids benthic foraminifera dasycladaceans sponge spicules echinoderms
Field observations
Samples Metres
Facies Texture
Constituents Depositionalenvironment interpretationSequence
small-scale sequences medium-scale sequences
intertidal flat marsh restricted lagoon tidal channel semi-restricted lagoon semi-restricted lagoon restricted lagoon restricted lagoon semi-restricted lagoon muddy lagoon semi-restricted lagoon sheltered lagoon open lagoon semi-restricted lagoon restricted lagoon intertidal flat marsh restricted lagoon SB TS SB SB SB SB SB TS MFD Relative abundance present common abundant very abundant TS elementary sequences ? ? ? ? ? ? 5 10 15
4
3
2
1
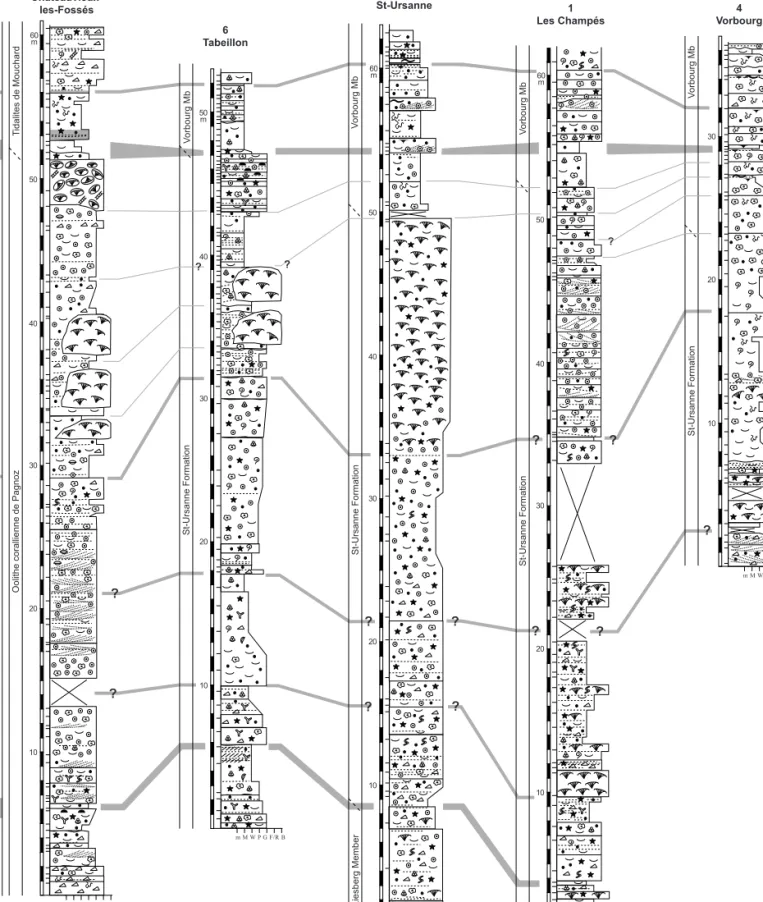
Fig. 4. Simplified logs of the interval between sequence boundaries Ox4 and Ox5. For discussion refer to text. Legend in Fig. 5. m M W P G F/R B 10 20 50 m 40 30 Vo rbourg Mb St-Ursanne Formation 6 Tabeillon m M W P G F/R B 10 20 50 40 30 60 m 16 Châteauvieux-les-Fossés Ti dalites de Mouchard
Oolithe corallienne de Pagnoz
m M W P G F/R B 10 20 50 40 30 60 m 5 St-Ursanne St-Ursanne Formation Vo rbourg Mb Liesberg Member m M W P G B 10 20 50 40 30 60 m 1 Les Champés St-Ursanne Formation Vo rbourg Mb Ox 5 ? 4 3 ? ? 2 ? ? ? ? ? Ox 4 1 5 m M W P G F/R B 10 20 30 4 Vorbourg St-Ursanne Formation Vo rbourg Mb ? ? ? ? ? ?
surface but by particularly thick beds and by the relatively most open-marine facies. In the basin, maximum flooding is expressed rather trough condensation and predominance of marls (Colombié 2002). All sections have been studied with the same detail as shown in Figure 3. However, for the purpose of this paper, only simplified versions are represented in Figures 4–12.
Once the best-fit correlation of all sections is established, the small-scale sequences (which are the best defined ones in the studied sections) are counted between ammonite zone boundaries and large-scale sequence boundaries. These boundaries have been dated by Hardenbol et al. (1998)
through interpolation between the ages of the stage bound-aries proposed by Gradstein et al. (1995). When dividing the duration of an interval by the corresponding number of small-scale sequences, the average duration of one small-small-scale se-quence can be estimated.
Sequence-stratigraphic interpretation
In the following, a brief description of the key features is given, which are used for the identification of large-scale and small-scale sequences in Figures 4 to 12. The numbering of the small-scale sequences and the identification of medium-Fig. 5. Interval between sequence boundary Ox5 and the important medium-scale sequence boundary at the top of small-scale sequence 12. For discussion refer to text. Röschenz Member Vo rbourg Member 9 6 5 Ox 5 m M W P G F/R B 10 20 40 m 30 7 Pichoux St-Ursanne Formation 8 7 13 12 11 10 4 m M W P G 10 20 30 m 4 Vorbourg Röschenz Member m M W P G 10 20 30 1 Les Champés Vo rbourg Member m M W P G 10 20 40 m 30 Günsberg Member 8 Hautes-Roches 10 20 30 m Günsberg Member 10 Moutier m M W P G F/R B Texture marls mudstone wackestone packstone grainstone floatstone / rudstone boundstone m M W P G F/R B
Sequence- and Cyclostratigraphy
100-ka sequence boundaries 400-ka sequence boundaries or sequence-boundary zones sequence boundaries according to Hardenbol et al. (1998) Ox 5 Sedimentary Structures birdseyes keystone vugs bioturbation cross-stratification microbial mat root traces 10 20 40 m 30 Günsberg Member 12 Péry-Reuchenette m M W P G F/R B Ef fingen Member X 40 m Röschenz Member Vo rbourg Member Facies
limestone with quartz limestone with dolomite peloids oncoids ooids lithoclasts brachiopods echinoderms bryozoans foraminifera corals green algae bivalves gastropods ostracodes serpulids charophytes plant fragments
Fig. 6.
Interval containing sequence boundary Ox6 and the prominent transgressive surface at the base of the Hauptmumienbank and
Steinebach members. For discussion refer to text, for the legend
to Fig. 5.
Günsberg / Röschenz Member
Ox 6 m M W P G F/R B 10 20 30 15 Pertuis 13 m M W P G 10 20 30 m 14
Savagnières Günsberg Member
m M W P G 10 20 12 Péry-Reuchenette 10 20
Günsberg / Röschenz Member
9
Gorges de Court
10
20
30 m
Günsberg / Röschenz Member
10 Moutier m M W P G F/R B 10 20 30 m
Günsberg / Röschenz Member
m M W P G F/R B X Hauptmumienbank Mb 15 14 17 30 m m M W P G 10 m Röschenz Member 1 Les Champés m M W P G B 30 m 8 Hautes-Roches transgressive surface 18
Günsberg / Röschenz Member
? ? transgressive surface ?? 20 19 16 maximum-floodi ng sur fa ce
scale sequences is anticipated from the next chapter on cy-clostratigraphy.
In the Swiss Jura, the transition from the Liesberg Member to the St-Ursanne Formation is marked by low-energy shal-low-lagoonal facies and/or dolomitization interrupting general-ly high-energy deposits with ooids and corals (Fig. 4). This lithological limit lies in the Antecedens ammonite subzone (Gygi 1995) and corresponds to the large-scale sequence boundary Ox4 of Hardenbol et al. (1998). In the French Jura, at Châteauvieux-les-Fossés, the “Oolithe corallienne de Pag-noz” is considered the lateral equivalent of the St-Ursanne Formation (Enay et al. 1988). A conspicuous level with key-stone vugs indicates a beach environment and is interpreted as representing sequence boundary Ox4. Above this sequence boundary, the sediments are dominated by ooids, oncoids and coral patch-reefs. No emersion features are present. In the high-energy facies it is therefore difficult to identify small-scale or elementary sequences because bedding surfaces may have formed through allocyclic as well as through autocyclic processes. Where there are changes to low-energy protected lagoons, however, an environmental change is suggested, which may be related to a drop of relative sea-level that isolat-ed lagoons from the open ocean. At Tabeillon (metre 31.6), an erosion surface supports this interpretation. A massive reef in-stalled itself at St-Ursanne, whereas two to three episodes of patch-reef growth are manifest at Tabeillon and Châteauvieux-les-Fossés. These episodes are interpreted as representing ele-mentary sequences. Towards the top of the St-Ursanne For-mation, keystone vugs, birdseyes and/or a change to low-ener-gy facies herald a large-scale sequence boundary, which can be correlated with Ox5 (Gygi et al. 1998). At Châteauvieux-les-Fossés, a thick bed of coral rubble testifies to the destruction of a reef, probably due to sea-level fall.
Large-scale sequence boundary Ox5 is also well represent-ed in other sections of the Swiss Jura (Fig. 5). At Pichoux, for example, it overlies restricted lagoonal deposits with plant fragments. At Pichoux, Vorbourg and Les Champés, the Vor-bourg Member represents high-energy ooid and oncoid facies, which pass upwards into marl-dominated deposits of the Röschenz Member. Birdseyes and microbial laminations are common, indicating periodically intertidal conditions. In the more southern sections (Hautes-Roches, Moutier, Péry-Reuchenette; Fig. 1), the Günsberg Member (Fig. 2A) features first siliciclastic-rich deposits, then coral reefs and ooid shoals. The Effingen Member at Péry-Reuchenette represents an epi-continental basin, which was gradually filled and covered by the prograding shallow-platform sediments (Gygi & Persoz 1986). A barrier system composed of reefs and ooid shoals on the edge of the southward prograding platform (Günsberg Member) isolated the marly lagoon of the Röschenz Member to the north. Due to the well-developed facies contrasts and the commonly observed evolution from high-energy transgres-sive deposits to low-energy regrestransgres-sive facies capped by tidal flats, the identification of small-scale sequences is facilitated. The individual beds composing these small-scale sequences are
considered as elementary sequences, which in many cases also exhibit tidal-flat caps. An interval exhibiting root traces at Vorbourg and plant fragments at Hautes Roches, Moutier and Péry-Reuchenette is considered as an important sequence boundary, which, however, has no equivalent in the chart of Hardenbol et al. (1998).
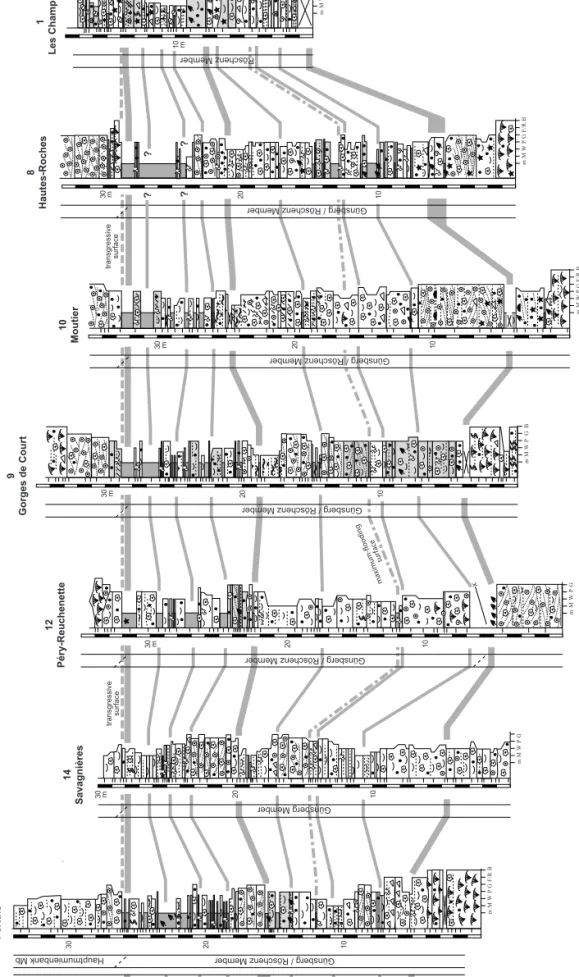
There is a general trend in the Günsberg and Röschenz members to become more marly and shallower towards the top (Fig. 6). Nevertheless, this evolution is periodically punctu-ated by ooid shoals and oncoid lagoons. Small-scale sequences can be identified relatively easily, and they are composed of 2 to 7 elementary sequences. A particularly strongly bioturbated horizon appearing in small-scale sequence 15 of several sec-tions is interpreted as an important maximum-flooding sur-face. At Moutier, this level is represented by an exceptional occurrence of corals, testifying to the relatively most open-ma-rine conditions. Plant fragments, tidal flats and dolomitization then point to an important large-scale sequence boundary, which lies approximately at the limit of the Bifurcatus and Bi-mammatum ammonite zones (Gygi 1995) and can be consid-ered as the equivalent of Ox6 (Fig. 2; Gygi et al. 1998). The rapid change to oncoid lagoons, ooid shoals and coral reefs (at Hautes-Roches) is interpreted as an important transgressive surface. Even at Les Champés, where lacustrine facies with charophytes are abundant, this transgression is marked by a pulse of high-energy deposits containing echinoderms.
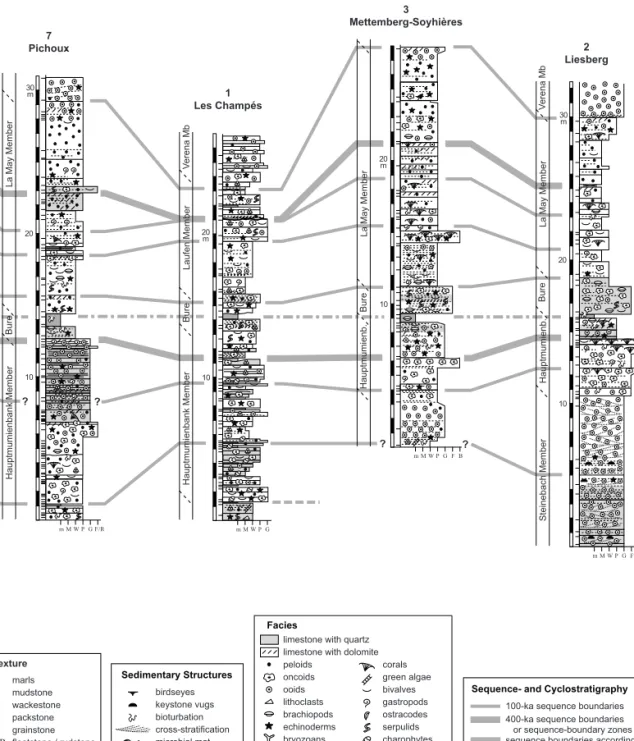
This important transgressive surface defines the base of the Hauptmumienbank and Steinebach members (Fig. 2A). On-coid-rich lagoonal facies characterise the Hauptmumienbank Member whereas the Steinebach Member is dominated by oo-lites and coral framestones (Fig. 7). Rapid vertical facies changes are common and help in the identification of small-scale sequences. The Oolithe rousse Member is a conspicuous level exhibiting reddish oolites containing detrital quartz and occasional plant fragments. It implies a long-term sea-level drop and also a climate change to more humid conditions, favouring increased input of iron. This member belongs to the Bimammatum ammonite zone (Gygi 1995) and is associated to large-scale sequence boundary Ox7 (Gygi et al. 1998). A marly interval rich in brachiopods above this boundary is in-terpreted as an important maximum flooding. Lagoonal facies with occasional coral patch-reefs dominate the overlying inter-val, at the top of which many sections exhibit dolomitization. At Les Champés, a prominent erosion surface occurs. This boundary lies at the limit between the Bimammatum and Plan-ula ammonite zones (Gygi 1995) and is interpreted to corre-spond to large-scale sequence boundary Ox8 (Gygi et al. 1998).
Above sequence boundary Ox8, facies become more ho-mogeneous and are dominated by the oolites that characterise the Verena Member (Fig. 8). Small-scale sequence boundaries are suggested by the presence of dolomite and evaporites. Limits of elementary sequences are locally indicated by dolomitized horizons, but in other cases are difficult to define in the high-energy facies. Black pebbles at Péry-Reuchenette
and charophytes at Court imply a large-scale sequence bound-ary that is correlated with Kim1 of Hardenbol et al. (1998). The Oxfordian-Kimmeridgian boundary is not constrained by ammonites in these sections but is supposed to lie just below Kim1 (Fig. 2; Gygi et al. 1998).
The Reuchenette Formation (Fig. 2) is composed of mainly open-lagoonal facies, but dolomite caps and birdseyes point to periodic sea-level falls that induced small-scale sequence
boundaries (Figs. 9 and 10). The platform sections are corre-lated with biostratigraphically well-dated hemipelagic sections in south-eastern France. There, large-scale sequence bound-aries occur in intervals with relatively thick carbonate beds or with slumps (Colombié 2002). According to the biostratigra-phy and the sequence-chronostratigraphic chart of Hardenbol et al. (1998), Kim1, Kim2, Kim3 and Kim4 can be identified and tentatively correlated with the most conspicuous emersion Fig. 7. Interval containing sequence boundaries Ox7 and Ox8. Note the prominent maximum-flooding surface within small-scale sequence 25. For discussion refer to
maximum-flooding surface 21 25 26 24 23 22 28 27 29 maximum-flooding surface transgressiv e surface Ox 8 Ox 7 m M W P G F/R 10 20 40 30 50 m 11 La Chamalle Steinebach Member Hauptmumienbank Member Ool. R. Humeralis Member Ve rena Member 10 20 30 40 m 9 Gorges de Court m M W P G F/R B La May Member Ve rena Mb Bure Mb Hauptmumienbank Member Steinebach Member m M W P G F/R B 10 20 30 40 m 12 Péry-Reuchenette Steinebach Mb Hauptmumienbank Member Ool. R. Ve rena Mb La May Member m M W P G F 10 20 40 m 30 Ve rena Mb 13 Forêt de Châtel Humeralis Member Ool. R. Hauptmumienbank Member Steinebach Mb
horizons on the platform. For example, the base of the slump at Châteauneuf-d’Oze corresponds to the important sequence boundary displaying charophytes, birdseyes, dolomitization and black pebbles in the sections of the Swiss Jura (Kim2). The stacking pattern of the limestone-marl alternations in the hemipelagic sections does not permit a straightforward defini-tion of small-scale sequences; their interpretadefini-tion will be dis-cussed when dealing with the cyclostratigraphy.
The Late Kimmeridgian in south-eastern France con-sists mainly of massive beds and is not suited for the de-finition of small-scale sequences and, consequently, for a cyclostratigraphic analysis. On the platform, however, the Reuchenette Formation continues with well-developed small-scale sequences, which locally display important dolomiti-zed highstand deposits (especially in the Noirvaux section; Fig. 11). text. ? ? ? ? m M W P G 10 20 m 1 Les Champés Ve rena Mb Laufen Member Hauptmumienbank Member 10 20 m 3 Mettemberg-Soyhières La May Member Hauptmumienb. m M W P G F B 10 20 2 Liesberg Bure Hauptmumienb. m M W P G F B Steinebach Member La May Member Ve rena Mb 10 20 7 Pichoux Bure Hauptmumienbank Member m M W P G F/R La May Member 30 m Bure Bure Texture marls mudstone wackestone packstone grainstone floatstone / rudstone boundstone m M W P G F/R B
Sequence- and Cyclostratigraphy
100-ka sequence boundaries 400-ka sequence boundaries or sequence-boundary zones sequence boundaries according to Hardenbol et al. (1998) Ox 7 Sedimentary Structures birdseyes keystone vugs bioturbation cross-stratification microbial mat root traces Facies
limestone with quartz limestone with dolomite peloids oncoids ooids lithoclasts brachiopods echinoderms bryozoans foraminifera corals green algae bivalves gastropods ostracodes serpulids charophytes plant fragments 30 m
Kim1 m M W P G 10 20 Ve rena Member 12 Péry-Reuchenette Ox 8 9 Gorges de Court 50 m m M W P G R 10 20 Porrentruy Member Ve rena Member 30 40 m M W P G R 10 20 30 7 Pichoux 50 m 40 10 20 30 40 m M W P G R 3 Mettemberg-Soyhières 50 m Reuchenette Fromation Ve rena Member La May Member Ve rena Member 29 32 30 31
In many sections of the Swiss and French Jura, the Upper Virgula Marls mark the boundary between the Reuchenette and the Twannbach formations and correspond approximately to the Kimeridgian (sensu gallico) – Tithonian boundary (Fig. 2A). Below these marls, an important large-scale sequence boundary is implied by a prominent erosion surface at La Dôle, which correlates with birdseyes at Péry-Reuchenette and Pichoux (Fig. 12). The platform sections have been correlated to the hemipelagic section of Clue de Taulanne in south-eastern France (Rameil 2005). There, the marly interval at metres 32 to 34 is interpreted to be the equivalent of the Upper Virgula Marls. Sequence boundary Ti1 at Clue de Taulanne is indicated by an erosive surface overlain by a debris flow, while on the platform it is implied by tidal flats, black pebbles and important dolomitiza-tion. The Tithonian Twannbach Formation displays thin small-scale sequences dominated by shallow-lagoonal and tidal-flat facies. Dolomitization is common and can locally mask the depo-sitional sequences (e.g., top of La Dôle section). In this case, the sequence-stratigraphic interpretation becomes speculative.
Cyclostratigraphic interpretation
In the studied sections, the small-scale sequences are relatively easy to define (example in Fig. 3) and can be correlated over the entire study area within the framework given by the bio-stratigraphy and the large-scale sequence boundaries. Between sequence boundary Ox4 in the Plicatilis zone (Middle Oxfor-dian) and Ti1 in the Hybonotum zone (earliest Tithonian), 68 small-scale sequences have been identified in the platform sec-tions (Figs. 4–12). According to Hardenbol et al. (1998), the same interval lasted 7.4 million years (myr; Fig. 13). Assuming that each small-scale sequence has the same duration, it is im-plied that one small-scale sequence formed within approxi-mately 108’800 years (108.8 kyr). As shown in Figure 3, each small-scale sequence contains on the average 5 elementary se-quences. Considering all studied platform sections, this num-ber varies between 2 and 7 but never lies outside this range. Furthermore, in many cases 4 small-scale sequences build up well-defined medium-scale sequences. Consequently, on the Jura platform, there is a clear hierarchical stacking of the dif-ferent orders of depositional sequences.
In the hemipelagic sections, the limestone-marl couplets are considered as elementary sequences, i.e. they translate pe-riodic changes in clay input, pelagic carbonate productivity and/or input of carbonate mud from the platform (Einsele & Ricken 1991; Pittet et al. 2000). A clear stacking of these cou-plets into small- and medium-scale sequences, however, often is not visible (Figs. 9, 10, 12). In the biostratigraphically pre-cisely dated Crussol section (Fig. 9; Atrops 1982), there are 52 to 78 limestone-marl couplets between the base of the Platyno-ta and the top of the Divisum ammonite zones (52 if only the major couplets are counted, 78 if also the marl seams between limestone beds are considered). This interval covers about 1.4 myr according to Hardenbol et al. (1998), implying that one limestone-marl couplet formed within 17.9 to 26.9 kyr.
The durations for elementary, small-scale and medium-scale sequences thus obtained are close to those of the orbital periodicities (Milankovitch cycles). It is implied that elemen-tary sequences correspond to the 20-kyr cycle of the precession of the equinoxes, small-scale sequences to the 100-kyr short eccentricity cycle and medium-scale sequences to the 400-kyr long eccentricity cycle (Berger et al. 1989). Sequences corre-sponding to the 40-kyr obliquity cycle have not been identified unequivocally in the studied sections, although in some cases two elementary sequences appear to be grouped. Considering the large error margins of the radiometric dating of the stage boundaries (Fig. 13; Gradstein et al. 1995, 2004), the uncertain-ties in the interpolation to date the boundaries of ammonite zones and sequences (Hardenbol et al. 1998), the complexity of the atmospheric system through which the orbitally con-trolled insolation changes translate into climate, and the multi-ple feed-backs by which the climate translates into sea-level and environmental changes and finally into the sedimentary record, it is not astonishing that the values obtained in this study do not correspond exactly to the calculated orbital peri-odicities (Strasser et al. 1999).
Accepting the hypothesis that the observed hierarchical stacking of the sequences seen in the platform sections indeed corresponds to the record of orbital (Milankovitch) cycles, the interpretation of the sections can be fine-tuned. Where uncer-tainties exist in the placing of small-scale sequence boundaries, they are now put in a best-fit position taking into account the stacking of elementary sequences and the lateral correlation. On the other hand, the definition of elementary sequences is facilitated because – theoretically – there should be 5 con-tained in one small-scale sequence. If there are less than 5, it is implied that accommodation loss caused non-deposition or erosion of elementary sequences, or that sea-level change was not sufficient to create a facies contrast that was recorded as an elementary sequence (“missed beats”; Goldhammer et al. 1990). If there are more than 5 elementary sequences in a small-scale sequence, autocyclic processes were involved that created sequences independent of orbitally controlled sea-level changes. In the hemipelagic sections, small-scale se-quences can be better identified when assuming that a lime-stone-marl couplet represents 20 kyr. It is seen that in many cases thicker limestone beds can be interpreted to be situated at the limits of small-scale sequences (assuming that lowstand deposits are dominated by more carbonate production and/or input; Colombié 2002; Colombié & Strasser 2005).
Medium-scale sequences (corresponding to the 400-kyr long eccentricity cycle) are prominent on the platform (Figs. 4 – 12). In the basinal sections, their boundaries are not clearly expressed but generally coincide with intervals of thick lime-stone beds and, in the case of Châteauneuf-d’Oze (Fig. 9), with a slump. In most cases, the large-scale sequence boundaries identified by Gygi et al. (1998) and Hardenbol et al. (1998) are also medium-scale sequence boundaries. This is thought to be due to the fact that orbitally controlled sea-level changes are superimposed on the long-term (2nd-order) sea-level trend.
44 43 42 41 40 39 ? ? Kim1 Reuchenette Formation Kim2 Kim3 m M W P G 10 20 40 30 50 12 Péry-Reuchenette 60 m 33 38 34 35 36 37 10 20 Planula 30 40 50 m 20 Crussol Platynota Hypselocyclum Divisum Lothari Hippolytense Galar "Orthosphinctes" Desmoides Guilh. ? ? ? ? ? 9 Gorges de Court m M W P G 10 20 40 m 30 Reuchenette Formation m M W P G 10 20 30 40 7 Pichoux 50 m Reuchenette Formation
Depending on the basin configuration and on the amplitude of the sea-level drop, the 400-kyr cycles will produce features that are interpreted either as 3rd-order sequence boundaries or as more subtle boundaries that will not be labelled as such (Strasser et al. 2000).
In the present study, no time-series analyses based on ac-commodation changes or repetitive facies changes have been performed to confirm that the observed stacking of sequences corresponds to the hierarchy of orbital cycles (e.g., Weedon 2003). On the carbonate platform, bed thickness does not cor-respond to accommodation if sediment did not fill the avail-able space (subtidal cycles; Osleger 1991), and rapid lateral and vertical facies changes preclude a simple pattern of facies evolution (Strasser & Védrine 2007). Furthermore, bed thick-nesses would have to be decompacted according to facies, and water depth would have to be estimated for each maximum flooding and each sequence boundary in order to reproduce a “true” sea-level curve as input for time-series analysis (Strasser et al. 2004). In the hemipelagic sections, high-resolution calci-metric and/or geochemical analyses would have to be per-formed in order to produce a representative time series that reflects cyclic environmental changes (Einsele & Ricken 1991). These time-consuming procedures have not been undertaken for the present study. In the Méouge section, however, Boulila et al. (2006) have measured the magnetic susceptibility at high resolution and recognized Milankovitch cyclicity (20-, 40-, 100-and 400-kyr cycles).
Astronomical time scale
For the Neogene, the astronomical time scale is tied to the Re-cent and allows tuning of the chronostratigraphic scales, better define GSSPs and intercalibrate radiometric dating methods (e.g., Hilgen et al. 2003; Kuiper et al. 2004). For the Oxfordian, Kimmeridgian and Tithonian, the stage boundaries are dated with error margins of 3 to 4 million years (Gradstein et al. 1995, 2004). However, the cyclostratigraphical approach demonstrated in this study allows establishing a floating astro-nomical time scale (Hilgen et al. 2004) with a time resolution of at least 100 kyr (corresponding to one small-scale se-quence). Where elementary sequences can be identified with confidence, the time resolution reaches 20 kyr. This permits a relatively precise evaluation of the durations of stages, large-scale depositional sequences (Fig. 13) and ammonite zones (Fig. 14).
The duration of the Kimmeridgian (sensu gallico) thus is evaluated at 3.2 to 3.3 myr by cyclostratigraphy (32 small-scale sequences between Kim1 and Kim5, plus possibly one small-scale sequence between Kim5 and the Kimmeridgian-Tithon-ian boundary; see discussion below). Gradstein et al. (1995) give a value of 3.4 myr to this stage, Gradstein et al. (2004) 3.75 myr. The durations of large-scale (3rd-order) sequences
10 20 Planula 30 m 21 Châteauneuf-d'Oze Platynota Hypselocyclum Divisum Lotha. Hippolytense Galar "Orthosph." Desmoid. Guilh. Acanthicum 10 20 Planula 30 m 22 Méouge Platynota Hypselocyclum Divisum Lothari Hippolytense Galar ? ? ? ? ? ? ? ? ? ? ?
m M W P G 10 20 30 40 7 Pichoux 50 m Reuchenette Formation Kim3 Kim4 45 49 48 52 51 50 53 54 55 56 ? 10 20 Divisum 30 m 20 Crussol Acanthicum Eodoxus 10 Divisum 20 m 22 Méouge Acanthicum Eudoxus ? ? Reuchenette Formation m M W P G 10 20 40 m 30 12 Péry-Reuchenette ? ? ? ? 47 46 Texture marls mudstone wackestone packstone grainstone floatstone / rudstone boundstone m M W P G F/R B
Sequence- and Cyclostratigraphy
100-ka sequence boundaries 400-ka sequence boundaries or sequence-boundary zones sequence boundaries according to Hardenbol et al. (1998) Kim4
Facies
limestone with quartz limestone with dolomite peloids oncoids ooids lithoclasts brachiopods echinoderms bryozoans foraminifera corals green algae bivalves gastropods ostracodes serpulids charophytes plant fragments evaporites L.V rigula Sedimentary Structures birdseyes keystone vugs bioturbation cross-stratification microbial mat root traces
Fig. 10. Interval containing sequence boundary Kim4, with platform-to-basin correlation. For the basinal sections, ammonite zones are indicated. For discussion refer to text.
Fig. 11. Interval above sequence boundary Kim4. For discussion refer to text, for the legend to Fig. 10. Reuchenette Formation m M W P G 10 20 40 30 12 Péry-Reuchenette 50 m m M W P G 10 20 30 40 7 Pichoux Reuchenette Formation 53 57 56 60 59 58 50 m 10 20 30 17 Noirvaux m M W P G 40 50 m Reuchenette Formation Kim4 55 54 ? ? 10 20 19 Cirque des Avalanches m M W P G 30 40 m Reuchenette Formation ? ? L.V rigula L.V rigula
63 62 65 64 61 68 Reuchenette Formation m M W P G 10 20 30 m 12 Péry-Reuchenette 10 20 30 17 Noirvaux m M W P G 40 50 60 m Reuchenette Formation T wannbach Formation Kim5 10 20 30 18 La Dôle m M W P G 40 Reuchenette Formation Tw annbach Formation 71 69 70 72 50 m 74 73 Ti1 67 76 75 ? ? Upper V irgula 66 m M W P G 10 20 30 7 Pichoux Reuchenette Formation 40 m
are evaluated at 400 kyr or multiples thereof (Fig. 13; Strasser et al. 2000), whereas the estimations of Hardenbol et al. (1998) are based on the interpolated ages of the sequence boundaries and may deviate considerably from our cy-clostratigraphical interpretation (especially for the interval Kim5 – Ti1). In north-eastern Spain, Late Kimmeridgian ramp carbonates display characteristic stacking patterns. Spectral analysis of the bed thicknesses in one outcrop sug-gests that orbital cycles were involved (Bádenas et al. 2003) while elsewhere this control cannot be demonstrated with cer-tainty (Aurell & Bádenas 2004). For the interval between se-quence boundaries Kim4 and Kim5, Bádenas et al. (2003) in-dicate 1.06 myr, while the study presented here suggests 1.2 myr (Fig. 13). Based on a platform-to-basin correlation in north-eastern Spain, Strasser et al. (2005) proposed a dura-tion of 2.8 myr for the interval between Ox4 and Ox8, which is consistent with the value given in Figure 13.
The evaluation of the durations of ammonite zones is not straightforward (Fig. 14). Where only platform sections are available, the positions of the ammonite zone boundaries have been estimated based on the scheme of Gygi (1995; Fig. 2A). Also in the basinal sections the ammonite zone boundaries can not always be placed with precision (Atrops 1982). Some of the estimated durations are in good agreement with the values given by Hardenbol et al. (1998), others are quite different. For the Middle Oxfordian to Middle Kimmeridgian interval in southern Germany, Ruf et al. (2005) defined medium-scale (400-kyr) sequences based on a chemostratigraphic and paly-nofacies analysis of deeper ramp carbonates. The durations of the corresponding ammonite zones are in the same order as those defined in the present study (Fig. 14). Also in southern Germany, Pittet & Strasser (1998b) counted 14 small-scale se-quences within the Bimammatum ammonite zone, which would imply a duration of 1.4 myr (versus 1.2 myr in the pre-sent study). Weedon et al. (2004) established an astronomical time scale for the Kimmeridge Clay in southern England by spectral analysis of the variability of magnetic susceptibility, photoelectric factor and gamma ray. The resulting durations of ammonite zones, however, diverge considerably from the values presented here (Fig. 14). This may be at least partly due to problems with correlating ammonite zones between the Tethyan and the boreal realms (Colombié & Rameil 2007).
Discussion
A prerequisite for establishing astronomical time scales of course is that all orbitally induced cycles are recorded in the sediment. In greenhouse periods such as during the Oxfordian and Kimmerdigian, cyclical climate changes translated into low-amplitude sea-level changes through waxing and waning of mountain glaciers and possibly also some small polar ice caps (Fairbridge 1976), through thermal expansion and retrac-tion of the ocean surface water (Gornitz et al. 1982), through modifications in thermohaline oceanic circulations (Schulz & Schäfer-Neth 1998) and/or through changes in water storage 19 Cirque des Avalanches 10 20 m M W P G 30 40 50 m T wannbach Formation Reuchenette Formation 23 Clue de Taulanne 10 20 30 40 50 m Hybonotum Eudoxus Beckeri ? turbidite ? Upper V irgula radiolarian peak
in lakes and aquifers (Jacobs & Sahagian 1993). On the shal-low Jura platform, these sea-level fluctuations were recorded quite faithfully because relatively high subsidence rate (Wildi et al. 1989) created enough accommodation space. Emersion and non-deposition occurred mostly on the top of elementary sequences, and some small-scale sequences lack the topmost elementary sequence(s). The hierarchical stacking pattern, however, is not affected by this systematic, short-term lack of sedimentary record (Strasser et al. 1999). Differential sub-sidence was important on the Jura platform and caused the laterally variable thicknesses of the depositional sequences (Figs. 4 – 12). Export of carbonate mud from the platform to the basin may also have been controlled by high-frequency, low-amplitude sea-level fluctuations (Pittet et al. 2000), thus at least partly governing the hemipelagic limestone-marl al-ternations. Clay input was probably controlled by a combina-tion of sea-level changes and fluctuacombina-tions of rainfall pattern in the hinterland from where the clays originated. Deep-water resediments are common especially in sections close to the slope. The irregular pattern of the limestone-marl alternations in the studied sections of south-eastern France demonstrates that the responsible processes were not simple. In the Kim-meridgian, an analysis has been attempted (Figs. 9, 10, and 12). Oxfordian hemipelagic sections of south-eastern France, however, have not been included in this work because it is often not clear if a limestone-marl couplet resulted from an episodic process or if it represents a “true” elementary se-quence (e.g., at Château-neuf-d’Oze or at Vergons; Bom-bardiere & Gorin 1998).
It is of advantage to include as many sections as possible in the cyclostratigraphic analysis: effects of autocyclic processes and of synsedimentary tectonics can thus be filtered out. Plat-form-to-basin correlations furnish an improved
biostratigraph-ic frame because basinal sections are usually better dated. Fur-thermore, because platform systems and hemipelagic systems react differently to the same cyclical changes, a cross-check of the cyclostratigraphical interpretation becomes possible. In the present study it appears that elementary sequences are rela-tively well developed in the Kimmeridgian hemipelagic sec-tions (limestone-marl couplets). On the platform, however, the small-scale sequences are easy to identify while the elemen-tary sequences often are difficult to interpret.
Through the platform-to-basin correlation, two discrepan-cies are revealed. The first one concerns the medium-scale se-quence boundary above small-scale sese-quence 40 (Fig. 9). In the well-dated Crussol section, the Hypselocyclum zone com-prises 27 limestone-marl couplets, corresponding to 540 kyr. The duration of this zone is estimated at 620 kyr by Hardenbol et al. (1998). At Méouge, which was chemostratigraphically correlated with Crussol by De Rafélis (2000), this interval also contains 27 limestone-marl couplets. At Châteauneuf-d’Oze, however, only 17 couplets are counted (including the slump), and the Lothari subzone appears reduced. It is well possible that a medium-scale sea-level drop caused erosion and/or non-deposition at Châteauneuf-d’Oze, although no traces of this are visible in the field. At Crussol and Méouge, however, ir-regular beds at the base of the Divisum zone may testify to such an event. The number of limestone-marl couplets within the Divisum zone varies between 10 and 12, but the duration of this zone is estimated at 610 kyr by Hardenbol et al. (1998). The correlation to the platform sections suggests that the same interval contains about 4 small-scale sequences, which would correspond to 400 kyr. More well-dated sections should be studied to resolve this mismatch.
The second discrepancy appears around sequence bound-ary Kim5 (Fig. 12). According to Hardenbol et al. (1998), this Fig. 13. Duration of intervals between sequence boundaries as given in the sequence-chronostratigraphic chart of Hardenbol et al. (1998), and compared to the number of small-scale sequences implied from the cyclostratigraphic analysis. One small-scale sequence represents 100 kyr. For discussion refer to text.
Chronostratigraphy Tithonian Kimmeridgian (s. gallico) Oxfordian Early Middle Early Late Late
Early Kim. (s. anglico
) Sequence boundaries Ti 1 Kim 5 Kim 1 Kim 2 Kim 3 Kim 4 Ox 8 Ox 7 Ox 3 Ox 4 Ox 5 Ox 6 Biostratigraphy Beckeri Eudoxus Plicatilis Transversarium Bifurcatus Bimammatum Planula Platynota Hypselocyclum Divisum Acanthicum Hybonotum Number of small-scale sequences between sequence boundaries Age of sequence boundaries Time between sequence boundaries (kyr) 157.4 157.0 155.8 155.2 154.6 154.0 153.5 152.7 152.0 150.9 150.0 157.9 400 1200 600 600 600 500 800 700 1100 900 4 4 12 8 8 8 12 4 4 4 150.7 + 3.0 154.1 + 3.2
boundary is situated in the Autissiodorensis ammonite zone (Fig. 2). However, if the correlation proposed in Fig. 12 and the dating is correct, Kim5 would be situated at the very base of the Hybonotum ammonite zone (which at Clue de Taulanne is implied by a peak in radiolarian abundance; Rameil 2005). Consequently, the Upper Virgula Marls would rather belong to the base of the Tithonian than to the top of the gian (Fig. 2). Kim5 would then correspond to the Kimmerid-gian-Tithonian boundary. Again, more sequence- and bio-stratigraphic studies are needed to clarify this issue.
Conclusions
Through detailed facies analysis and the interpretation of the evolution of depositional environments through space and time it can be shown that Oxfordian and Kimmeridgian plat-form and basin carbonates hold a record of orbital (Mi-lankovitch) cycles. The cycles of the precession of the equinox-es and of short and long eccentricity controlled sea-level changes that caused the formation of hierarchically stacked de-positional sequences. The general biostratigraphic and se-quence-chronostratigraphic framework of the studied sections furnishes a rough timing, which confirms that the durations of the depositional sequences indeed correspond to the expected orbital frequencies. It is thus implied that the observed ele-mentary sequences formed within 20 kyr, whereas the small-and medium-scale sequences correspond to 100 small-and 400 kyr, respectively. Through lateral correlation of the sequences be-tween the platform sections and from platform to basin, local and autocyclic factors are eliminated and a high-resolution time frame is established.
However, Figures 13 and 14 reveal some important dis-crepancies in the estimation of the duration of sequences and biozones depending on the applied method (interpolation be-tween radiometric ages, different cyclostratigraphical ap-proaches). Consequently, more effort has to be invested in the precise biostratigraphical positioning of sections and in the careful analysis of depositional sequences. The more sections are analysed in different depositional settings and correlated, the better the allocyclic control on deposition can be evaluated and used for establishing an astronomical time scale.
The precise timing of depositional sequences allows for a very detailed interpretation of the evolution of depositional environments. The time resolution approaches that of the Pleistocene and Holocene where the controlling parameters are much better known than in the deep geologic past. Conse-quently, sedimentation rates, speeds of ecological and evolu-tionary changes, or the timing of porosity development in reservoir rocks can be evaluated with unprecedented resolu-tion. From the correlation of the platform sections it also be-comes evident that lateral facies changes within small-scale (and, where identifiable, within elementary) sequences are common and imply a highly structured carbonate platform where several depositional environments were juxtaposed (Strasser & Védrine 2007).
Any geological time scale is not a research goal by itself but serves as a base for the analysis of geological processes. Therefore, the here presented astronomical time scale is seen as a starting point for future research. It is hoped that it will be useful to better constrain the timing of ecological, sedimento-logical and diagenetic processes that governed the Jura plat-form during Oxfordian and Kimmeridgian times.
Fig. 14. Duration of ammonite zones according to different authors and compared with the present study. Correlation of Tethyan and boreal ammonite zones based on Hardenbol et al. (1998). For discussion see text.
Duration in kyr according to Ammonite zones (Tethyan) Beckeri Eudoxus Transversarium Bifurcatus Bimammatum Planula Platynota Hypselocyclum Divisum Acanthicum Hybonotum
Hardenbol et al. (1998) Ruf et al. (2005) this work Weedon et al. (2004)
Ammonite zones (boreal) 1400 670 740 520 610 620 250 530 1050 520 1060 Baylei >290 Cymodoce Eudoxus Mutabilis Autissiodorensis Elegans >745 >1486 >1062 >243 >287 ~500 ~1000 ~600 ~300 ~500 ~800 ~600 500-700 700-800 ~1200 300-400 540 ~400 400 ~700 ~800 ?
Acknowledgements
I am indebted to Virginie Bard, Thomas Bühler, Claude Colombié, Christophe Dupraz, Philippe Gsponer, Wolfgang Hug, Philippe Jordan, Daniel Oswald, Bernard Pittet, Niels Rameil and Gaëtan Rauber who logged and sampled the sections conscientiously and analysed the facies in much detail. Without their work this synthesis would not have been possible. I also thank the reviewers Bruno D’Argenio and Pierre-Yves Collin for their constructive remarks, and the guest editors Helmut Weissert and Hanspeter Funk for the careful editing. The financial support of the Swiss National Science Foundation is gratefully acknowledged (Projects No. 20-67736.02 and 109214.05). This paper is dedi-cated to Rudolf Trümpy who has initiated me to the science of stratigraphy.
REFERENCES
Allenbach, R.P. 2001: Synsedimentary tectonics in an epicontinental sea: a new interpretation of the Oxfordian basins of northern Switzerland. Eclo-gae Geologicae Helvetiae 94, 265–287.
Aurell, M. & Bádenas, B. 2004: Facies and depositional sequence evolution controlled by high-frequency sea-level changes in a shallow-water carbon-ate ramp (lcarbon-ate Kimmeridgian, NE Spain). Geological Magazine 141, 717–733.
Atrops, F. 1982: La sous-famille des Ataxioceratinae (Ammonitina) dans le Kimméridgien inférieur du Sud-Est de la France. Systématique, évolution, chronostratigraphie des genres Orthosphinctes et Ataxioceras. Document du Laboratoire de Géologie de Lyon 83, 463 pp.
Bádenas, B., Aurell, M., Rodriguez-Tovar, F.J. & Pardo-Igúzquiza, E. 2003: Sequence stratigraphy and bedding rhythms of an outer ramp limestone succession (Late Kimmeridgian, Northeast Spain). Sedimentary Geology 161, 153–174.
Bard, V. 1999: Géologie de la région de Vuillafans (Doubs, France). Unpub-lished Diploma Thesis, University of Fribourg, 87 pp.
Berger, A., Loutre, M.F. & Dehant, V. 1989: Astronomical frequencies for pre-Quaternary palaeoclimate studies. Terra Nova 1, 474–479.
Bolliger, W. & Burri, P. 1970: Sedimentologie von Schelf-Carbonaten und Beckenablagerungen im Oxfordien des zentralen Schweizer Jura. Beiträge zur geologischen Karte der Schweiz (N.F.) 140, 96 pp.
Bombardiere, L. & Gorin, G. 1998: Sedimentary organic matter in condensed sections from distal oxic environments: examples from the Mesozoic of SE France. Sedimentology 45, 771–788.
Boulila, S., Galbrun, B., Collin, P.-Y. & Schnyder, J. 2006: High-resolution cy-clostratigraphic analysis of magnetic susceptibility record from a Kim-meridgian alternating marl-limestone succession (La Méouge, Vocontian Basin, France). Abstract 7thInternational Congress on Jurassic System,
Jurassica 4, 149.
Bühler, T. 1997: Géologie de la région de la Combe Tabeillon (Sud-Ouest de Glovelier), avec une analyse séquentielle d’une coupe de l’Oxfordien moyen (Formation de St-Ursanne). Unpublished Diploma Thesis, Uni-versity of Fribourg, 79 pp.
Clari, P.A., Dela Pierre, F. & Martire, L. 1995: Discontinuities in carbonate successions: identification, interpretation and classification of some Italian examples. Sedimentary Geology 100, 97–121.
Colombié, C. 2002: Sédimentologie, stratigraphie séquentielle et cyclostrati-graphie du Kimméridgien du Jura suisse et du Bassin vocontien (France): relations plate-forme – bassin et facteurs déterminants. GeoFocus 4, Fri-bourg, 198 pp.
Colombié, C. & Rameil, N. 2007: Tethyan-to-boreal correlation in the Kim-meridgian using high-resolution sequence stratigraphy (Vocontian Basin, Swiss Jura, Boulonnais, Dorset). International Journal of Earth Sciences 96, 567–591.
Colombié, C. & Strasser, A. 2005: Facies, cycles, and controls on the evolution of a keep-up carbonate platform (Kimmeridgian, Swiss Jura). Sedimentol-ogy 52, 1207–1227.
D’Argenio, B., Fischer, A.G., Premoli Silva, I., Weissert H. & Ferreri V. (Eds.)(2004): Cyclostratigraphy: approaches and case histories. SEPM Special Publication 81, 311 pp.
De Rafélis, M., Emmanuel, L., Renard, M., Atrops, F. & Jan du Chene, R. 2000: Geochemical characterisation (Mn content) of third order eustatic sequences in Upper Jurassic pelagic carbonates of the Vocontian Trough (SE France). Eclogae Geologicae Helvetiae 94, 145–152.
Dercourt, J., Ricou, L.E. & Vrielynck, B. 1993: Atlas: Tethys palaeogeograph-ic maps. CCGM, Paris.
Dunham, R.J. 1962: Classification of carbonate rocks according to deposition-al texture. AAPG Memoir 1, 108–121.
Dupraz, C. 1999: Paléontologie, paléoecologie et évolution des faciès récifaux de l’Oxfordien Moyen-Supérieur (Jura suisse et français). GeoFocus 2, Fribourg, 247 pp.
Einsele, G. Ricken, W. 1991: Limestone-marl alternation – an overview. In: Einsele, G., Ricken, W. & Seilacher A. (Eds.): Cycles and Events in Stratigraphy. Springer, Heidelberg, 23–47.
Enay, R., Contini, D. & Boullier, A. 1988: Le Séquanien-type de Franche-Comté (Oxfordien supérieur): datations et corrélations nouvelles, con-séquences sur la paléogéographie et l’évolution du Jura et régions voisines. Eclogae Geologicae Helvetiae 81, 295–363.
Fairbridge, R.W. 1976: Convergence of evidence on climatic change and ice ages. Annals of the New York Academy of Sciences 91, 542–579. Fischer, A.G., D’Argenio, B., Premoli Silva, I., Weissert, H. & Ferreri, V.
2004: Cyclostratigraphic approach to Earth’s history: an introduction. SEPM Special Publication 81, 5–13.
Goldhammer, R.K., Dunn, P.A., & Hardie, L.A. 1990: Depositional cycles, composite sea-level changes, cycle stacking patterns, and the hierarchy of stratigraphic forcing: examples from Alpine Triassic platform carbonates. Geological Society of America Bulletin 102, 535–562.
Gornitz, V., Lebedeff, S. & Hansen, J. 1982: Global sea-level trend in the past century. Science 215, 1611–1614.
Gradstein, F.M., Agterberg, F.P., Ogg, J.G., Hardenbol, J., van Veen, P., Thierry, J. & Huang, Z. 1995: A Triassic, Jurassic and Cretaceous time scale. SEPM Special Publication 54, 95–126.
Gradstein, F., Ogg, J. & Smith, A. 2004: A geologic time scale 2004. Cam-bridge University Press, CamCam-bridge, 589 pp.
Gsponer, P. 1999: Etude géologique et sédimentologique de l’anticlinal du Chasseral dans le région de La Heutte. Unpublished Diploma Thesis, University of Fribourg, 107 pp.
Gygi, R.A. 1995: Datierung von Seichtwassersedimenten des Späten Jura in der Nordwestschweiz mit Ammoniten. Eclogae Geologicae Helvetiae 88, 1–58.
Gygi, R.A. 2000: Integrated stratigraphy of the Oxfordian and Kimmeridgian (Late Jurassic) in northern Switzerland and adjacent southern Germany. Memoir of the Swiss Academy of Sciences 104, 152 pp.
Gygi, R.A. & Persoz, F. 1986 : Mineralostratigraphy, litho- and biostratigraphy combined in correlation of the Oxfordian (Late Jurassic) formations of the Swiss Jura range. Eclogae Geologicae Helvetiae 79, 385–454. Gygi, R.A., Coe, A.L. & Vail, P.R. 1998: Sequence stratigraphy of the
Oxfor-dian and Kimmeridgian stages (Late Jurassic) in northern Switzerland. SEPM Special Publication 60, 527–544.
Hardenbol, J., Thierry, J., Farley, M.B., Jacquin, T., De Graciansky, P.-C. & Vail, P.R. 1998: Jurassic sequence chronostratigraphy. SEPM Special Pu-blication 60, chart.
Heer, O. 1865: Die Urwelt der Schweiz. Schulthess, Zurich, 622 pp.
Hilgen, F.J., Abdul Aziz, H., Krijgsman, W., Raffi, I. & Turco, E. 2003: Inte-grated stratigraphy and astronomical tuning of the Serravallian and lower Tortonian at Monte dei Corvi (Middle-Upper Miocene, northern Italy). Palaeogeography, Palaeoclimatology, Palaeoecology 199, 229–264. Hilgen, F.J., Schwarzacher, W. & Strasser, A. 2004: Concepts and definitions
in cyclostratigraphy (second report of the cyclostratigraphy working group). SEPM Special Publication 81, 303–305.
Hillgärtner, H. 1998: Discontinuity surfaces on a shallow-marine carbonate platform (Berriasian – Valanginian, France and Switzerland). Journal of Sedimentary Research 68, 1093–1108.
Hug, W. 2003: Sequenzielle Faziesentwicklung der Karbonatplattform des Schweizer Jura im Späten Oxford und frühesten Kimmeridge. GeoFocus 7, Fribourg, 156 pp.
Jacobs, D.K. & Sahagian, D.L. 1993: Climate-induced fluctuations in sea level during non-glacial times. Nature 361, 710–712.